


In financial markets, quick and accurate decision-making can be the difference between profit and loss. One of the key tools for analyzing and managing these decisions is the TradingView risk reward tool. This tool allows traders to estimate potential risk and reward before entering a trade, enabling them to enter the market with greater confidence. In this article, we will provide a comprehensive overview of this tool and how to use it effectively. If you want to improve your trading performance and approach the market with more certainty, stay with us until the end of this article.

- The TradingView risk reward tool helps you accurately assess potential risk and reward before entering a trade.
- The Long Position and Short Position tools in TradingView are useful for precisely setting entry points, stop losses, and take profits.
- The TradingView tool is also available on mobile, although there are some limitations, such as less precision when dragging tools.
- The main difference between the TradingView tool and Forex calculators is its integration with technical charts.
What is the TradingView risk reward tool and how is it useful?
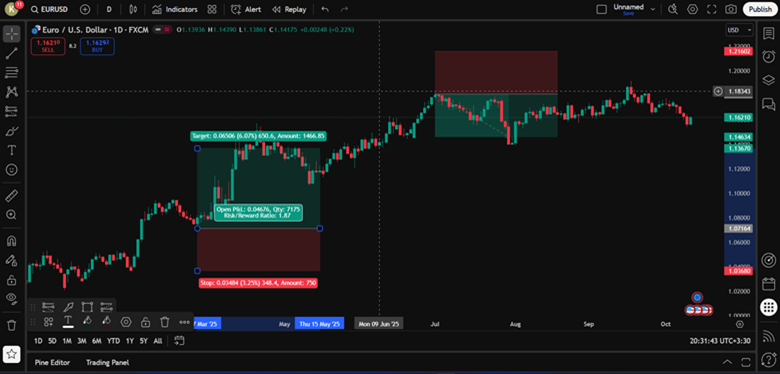
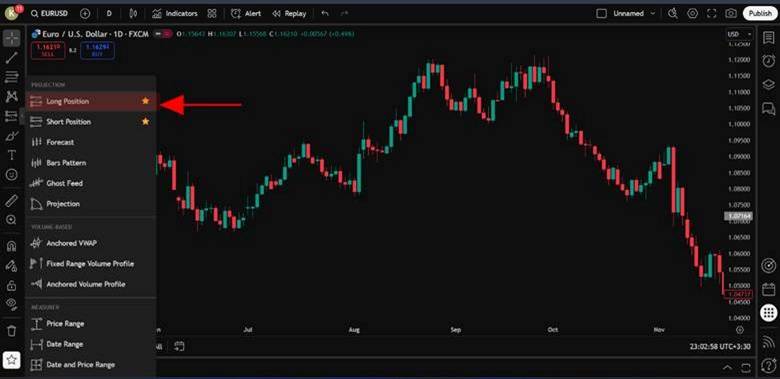
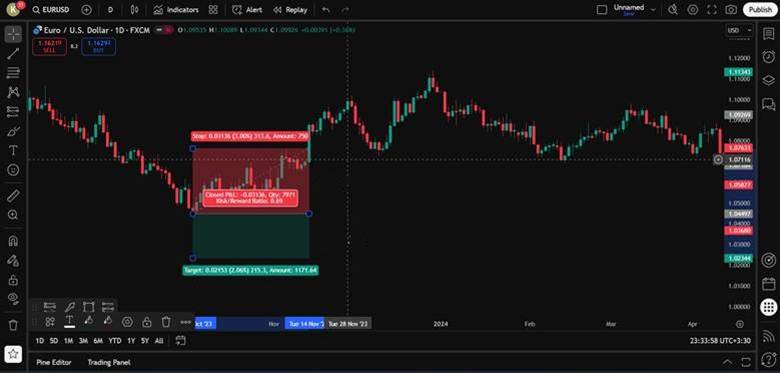
The TradingView risk reward tool utilizes the Long Position and Short Position tools to allow traders to accurately assess the potential risk and reward before entering a trade. These tools are specifically designed to analyze the Risk-to-Reward Ratio and to set entry points, stop losses, and take profits.
To use these tools, first, select either the Long Position or Short Position from the drawing tools menu in TradingView. Then, click on the chart to set your entry point, and drag the horizontal lines to mark your stop loss and take profit levels. After setting these points, the tool will automatically display information such as the percentage of potential profit or loss, risk, reward, and the account balance after the trade is closed.
Using these tools helps traders enter the market with more confidence and make better informed decisions in their trading strategy. Additionally, they are very useful for practicing and testing strategies in real market conditions without financial risk.
The Difference Between the TradingView Profit and Loss (P&L) Tool and the Simple Measurement Tool (Ruler)
In the TradingView platform, there are two main tools for measuring and analyzing trades: the TradingView Profit and Loss (P&L) tool and the simple Ruler tool. While these tools may seem similar, they have significant differences in their applications and features, which we will explore here.
The P&L tool helps traders estimate the potential profit and loss before entering a trade. This tool allows you to set entry points, stop losses, and take profits, enabling you to calculate the Risk-to-Reward Ratio and view your account balance after reaching the specified points.
In other words, the TradingView profit and loss tool automatically displays the percentage of profit or loss, the risk and reward amount, and even your account balance after the trade is closed. This tool is especially helpful for those who want to predict the performance of their trades before entering the forex market.
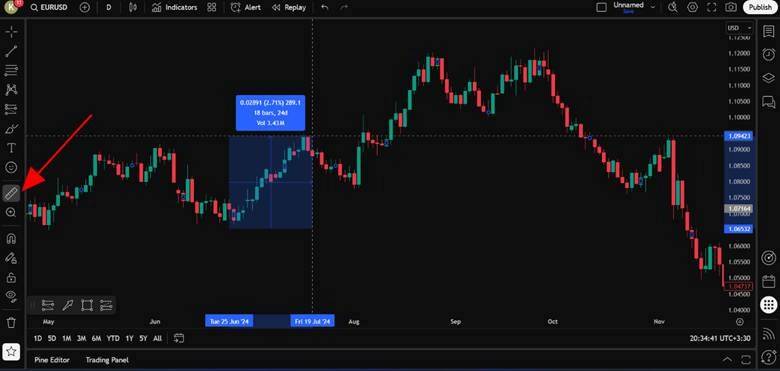
On the other hand, the Ruler tool is mainly used to measure the price distance between two points on the chart. This tool allows you to measure pips or price distances accurately, but it cannot display financial information such as profit and loss or the Risk-to-Reward Ratio. In fact, the Ruler tool is more suitable for measuring precise distances and is intended for technical analysis, not for predicting profit and loss or risk management.
For example, if you wanted to enter a buy trade in the EUR/USD pair, the P&L tool would help you set the entry point, stop loss, and take profit levels, then allow you to view the Risk-to-Reward Ratio and account balance after the trade closes. However, if you used the Ruler tool, you would only be able to measure the price distance between your entry point and stop loss or take profit levels, without receiving financial information or a more detailed analysis of your position.
Complete Guide to Using the Long Position Tool in TradingView
The TradingView risk reward tool is one of the key tools for analyzing trades. By using the Long Position tool, you can easily set entry points, stop losses, and take profits. This tool helps traders accurately assess potential profit and loss before entering a trade.
How to Activate the Long Position Tool from the Chart Toolbar
To activate the Long Position tool, go to the Chart Toolbar at the top of the page and select Long Position from the Drawing Tools section. After selecting this tool, your mouse cursor will change to a special symbol. Then, click on the chart to set your entry point and drag the horizontal lines to set your stop loss and take profit levels.
Precisely Setting Entry Points, Stop Loss, and Take Profit
After activating the Long Position tool, you can adjust the stop loss and take profit levels by dragging the lines. You can also manually input the prices or use ticks for more precise distance adjustments. These settings help you accurately define entry and exit points while setting your take profit and stop loss levels.
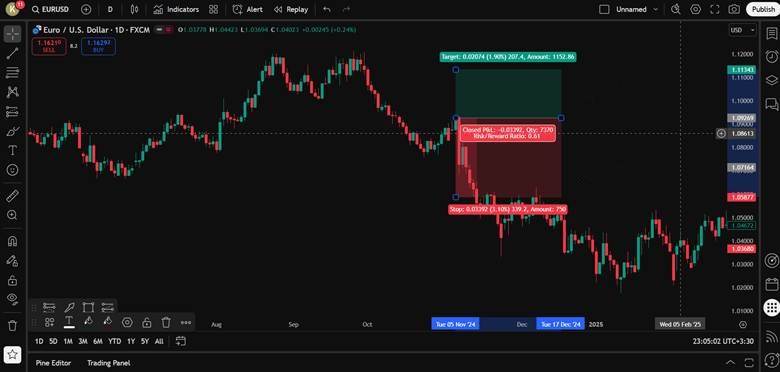
Viewing Profit, Loss Percent, and Risk-to-Reward Ratio on the Chart
Once you’ve set the entry points, stop loss, and take profit levels, the tool automatically displays the percentage of potential profit or loss, the risk and reward amount, and the account balance after closing the trade. This information allows you to assess the risk and potential profit before entering the trade. For more detailed guidance on this tool, TradingView tutorials can help you better understand these tools and use them more effectively.

According to Investopedia, enabling Compact Stats in the Long Position tool optimizes chart space and allows you to display multiple positions simultaneously without cluttering the chart, which is especially useful for multi-chart analysis.
How to Use the Short Position Tool for Sell Trades
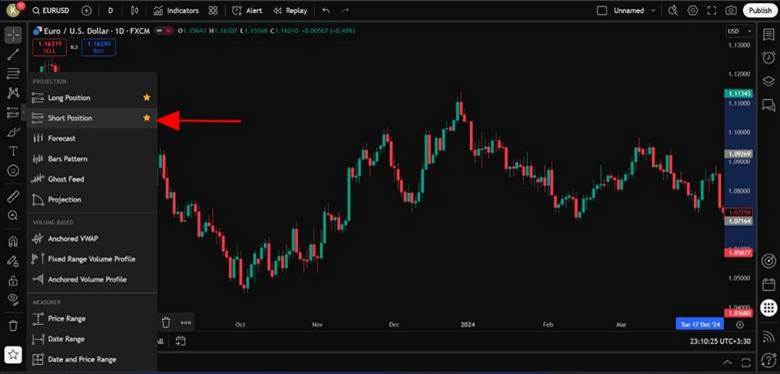
The Short Position tool is another feature of the TradingView risk reward tool, designed to assist traders in executing short trades. In a short sale, traders predict that the price of an asset will decrease. By using this tool, you can set entry points, stop losses, and take profits, as well as evaluate potential risk and reward before entering a trade.
How to Activate the Short Position Tool from the Chart Toolbar
To use the Short Position tool, first go to the Chart Toolbar at the top of the page and select Short Position from the Drawing Tools section. Once you select this tool, your cursor will change, and you can click on the chart to define your entry point.
Precisely Setting Entry Points, Stop Loss, and Take Profit
After activating the Short Position tool, simply click on the point where you wish to enter the trade. Then, by dragging the horizontal lines, you can set the stop loss and take profit levels. Typically, in short trades, the stop loss should be set above the entry point, while the take profit should be set below the entry point. These settings help you limit your losses if the market moves unexpectedly and protect your profits.
Viewing Profit, Loss Percent, and Risk-to-Reward Ratio on the Chart
One interesting feature of this tool is that it displays detailed information on the chart. After setting the stop loss and take profit, the Short Position tool will automatically show the percentage of potential profit or loss, risk and reward amounts, and your account balance after the trade closes. This information helps you accurately assess the risk and reward before entering the trade, enabling you to make more informed decisions.
The Difference in Displaying Profit and Loss in the Short Position Tool
In the Short Position, the display of profit and loss is reversed. In a Long Position, profit is displayed in the green zone (below), and loss is shown in the red zone (above). However, in Short Position, this order is reversed. Profit occurs when the price decreases and is displayed in the green zone, while loss occurs when the price increases and is shown in the red zone. This difference in display helps traders recognize that they are engaging in a sell trade.
Can You Use the TradingView Risk Reward Tool on Mobile?
Yes, you can use the TradingView risk reward tool on the mobile version of the platform. The TradingView mobile app is available for both iOS and Android devices and provides a wide range of features for analyzing and managing trades.
In the mobile version, tools like Forecasting & Measurement, including Long Position and Short Position, are available. With these tools, you can set entry points, stop losses, and take profits, as well as calculate the Risk-to-Reward Ratio. These features help you assess the potential profit and loss before entering a trade, giving you a clearer understanding of the risks and rewards involved.
While the mobile version may have slightly less precision when adjusting tools compared to the desktop version, the tools are still very effective and can greatly assist you in risk management and analyzing trades.
Although the mobile version of TradingView offers similar features to the desktop version, some functionalities, such as precisely adjusting tools, may have limitations. However, this version is still ideal for managing trades and viewing profit and loss at any time and from anywhere.
The Difference Between the TradingView Risk Reward Tool and Forex Calculators
Both the TradingView risk reward tool and Forex calculators like Myfxbook are designed to evaluate profit and loss in trades, but they differ significantly in terms of presentation and application.
The TradingView risk reward tool operates visually within the chart. It automatically calculates the position size, Risk-to-Reward Ratio, and account balance after hitting the stop loss or take profit levels. Additionally, by using Position Size Calculator scripts in TradingView, traders can determine the position size based on their desired risk, without needing to perform manual calculations.
On the other hand, Forex calculators like Myfxbook are primarily numerical and separate from the chart. These tools generally focus on calculating lot size, and to use them, you need to manually input values such as lot size, entry price, exit price, and currency pair.
The key advantage of the TradingView risk reward tool is its integration with technical analysis and the visual representation within the chart. This allows traders to analyze their trades without switching between different pages. This feature is especially useful for risk management and making quick decisions during trades.
Conclusion
Using the TradingView risk reward tool helps you assess your trade performance accurately. By displaying information such as the Risk-to-Reward Ratio, position size, and account balance, this tool makes your decision-making in the market more precise. To enhance your trading strategies, you can combine this tool with other analysis tools. We recommend testing the tool in a demo environment first to familiarize yourself with how it works, and then you can confidently use it in real trades.