


In the highly volatile and complex world of financial markets, one of the main challenges traders face is dealing with temporary declines in their capital. These declines, known as drawdowns, can act like a “silent nightmare” in a trading account. At first glance, they may not seem critical, but the psychological pressure they create can gradually have a serious negative impact on trading performance and decision-making.
Drawdown is the decrease in the value of a trading account from its highest point (equity peak) to the lowest point reached afterwards. It can reveal the vulnerability of a trading strategy or weaknesses in risk management.
The good news is that drawdown can be managed. A proper understanding of drawdown helps traders turn these periods of loss into opportunities to refine their trading approach and improve their strategies.
In this article, we examine why drawdown matters and look at strategies that help you get through this “silent nightmare” and continue trading with more confidence.

- A persistent decline in equity is a sign of weakness in the trading framework, and a drawdown acts as an early warning signal for every trader.
- The lower the percentage of drawdown, the faster the recovery path of the account, and the lower the psychological pressure.
- Repeated deep drawdowns usually indicate poor risk management and improper use of leverage.
- Psychological stability and sticking to the trading plan during drawdown phases are the most important factors for preserving capital over the long term.
What Is Drawdown and Why Does It Matter?
Drawdown is the reduction in capital from the highest equity level to the lowest point reached afterward, usually due to consecutive losing trades. This metric provides a realistic picture of a trading strategy’s risk profile and the trader’s ability to control losses.
Contrary to what many people think, drawdown is not just a single number. It reflects the quality of trading decisions and the level of discipline in executing a strategy.
According to information from Investopedia, drawdown is a key measure for assessing the stability and safety of a trading account. High drawdowns are often associated with poor risk management, excessive or irrational leverage, or the lack of a stop-loss. Ultimately, this can lead to margin calls or even a complete account blow-up.
A trader who truly understands the concept of drawdown is both mentally prepared for such periods and designs their trading structure based on the market’s actual behaviour, not on wishful thinking.
Types of Drawdown in Trading
Understanding the different types of drawdown helps traders analyse their performance more accurately and gain a clearer picture of their real risk exposure. The three main types of drawdown in trading are:
Absolute Drawdown
Absolute Drawdown shows the difference between the initial deposit (or the lowest previous balance) and the account’s lowest point over the entire trading period. This value is independent of previous profits or losses and focuses only on the initial decline.
Formula for Absolute Drawdown:
Absolute Drawdown = Lowest Recorded Equity − Initial Capital
Example:
- Initial trading capital: $10,000;
- After a series of profitable trades, the equity grows to $12,000;
- Then, due to a market downturn, equity falls to $9,000.
In this case:
- Initial capital = $10,000;
- Lowest recorded equity = $9,000.
So, the Absolute Drawdown is:
$9,000 − $10,000 = −$1,000
In practice, we consider the absolute value, so the account has experienced an absolute drawdown of $1,000.
Relative Drawdown
Relative Drawdown measures the decline in equity as a percentage, relative to the highest previous balance (the maximum equity level reached). This type of drawdown is a key indicator for assessing how robust a trading strategy is against volatility and how much pressure is placed on the account.
Formula for Relative Drawdown (conceptually):
Relative Drawdown (%) =
(Equity Peak − Lowest Equity After Peak) ÷ Equity Peak × 100
Using the previous example:
- Equity peak: $12,000;
- Lowest equity after the peak: $9,000.
Relative Drawdown:
(12,000 − 9,000) ÷ 12,000 × 100 = 25%
So, the trading account has experienced a 25% relative drawdown.
Maximum Drawdown (MDD)
Maximum Drawdown is the largest recorded decline in equity over the entire trading period, measured from a peak to the lowest point that follows it, without the equity fully recovering in between. This is one of the most important metrics for evaluating the overall risk of an account.
Formula for Maximum Drawdown (MDD) (conceptually):
Maximum Drawdown (%) =
(Maximum Peak − Subsequent Lowest Trough) ÷ Maximum Peak × 100
Example:
A trader opens an account with an initial capital of $1,000. Over time, the equity changes as follows:
- The account generates profit, and equity rises to $2,000 (first peak);
- Then, due to a bearish market, equity falls to $1,500;
- Afterwards, equity increases again to $1,800;
- In the next phase, a new series of losing trades pushes equity down to $1,200 (lowest recorded equity).
In this example, the Maximum Drawdown is calculated from the highest peak ($2,000) to the lowest point that follows ($1,200):
(2,000 − 1,200) ÷ 2,000 × 100 = 40%
In other words, this trading account has experienced a maximum drawdown of 40%.
A true “silent nightmare” for any trading account.

In maximum drawdown, the term initial peak refers to the highest recorded equity level before it declines to the lowest recorded equity level.
How Can We Analyse Drawdown in a Trading Account?
According to an article on the BabyPips website, analysing drawdown in trading accounts, especially on platforms like MetaTrader, is very simple and fully trackable. You only need to export the full trading history from the “Account History” tab and then generate a statistical report via the “Report” option.
In the final report, the Maximum Drawdown and Relative Drawdown values are displayed. In live accounts, these figures clearly show the period during which the most significant capital decline occurred. This information serves as a warning signal for the trader, as large swings in equity can result from improper use of leverage (trading leverage) or a lack of risk management structure.
By also reviewing the patterns recorded in a trading journal, you can identify recurring drawdowns and, by adjusting your strategy, prevent them from happening again. What truly matters is the continuous monitoring of drawdown after each trading period, as it reflects both the health of trading performance and the trader’s psychological stability in the face of losses.
The ratio between the profit earned after a drawdown and the depth of that drawdown (Recovery Factor) is an advanced metric for assessing the quality of a strategy. A value below 1.5 indicates a structural weakness in the system.
Step-by-Step Guide to Exporting and Analyzing Drawdown in MT4/MT5
Below is a step-by-step visual guide to exporting and analysing drawdown in MetaTrader:
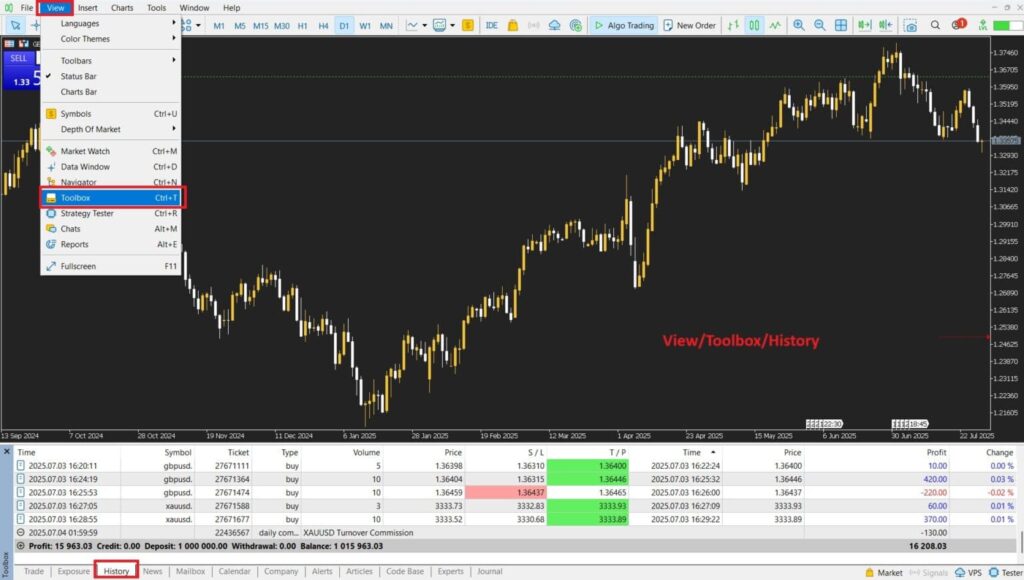
Step 1: Open the “Account History” tab
- In MT4, go to the View menu and open the Terminal window at the bottom of the platform.
- In MT5, go to the Toolbox at the bottom of the platform.
- Select the History tab.
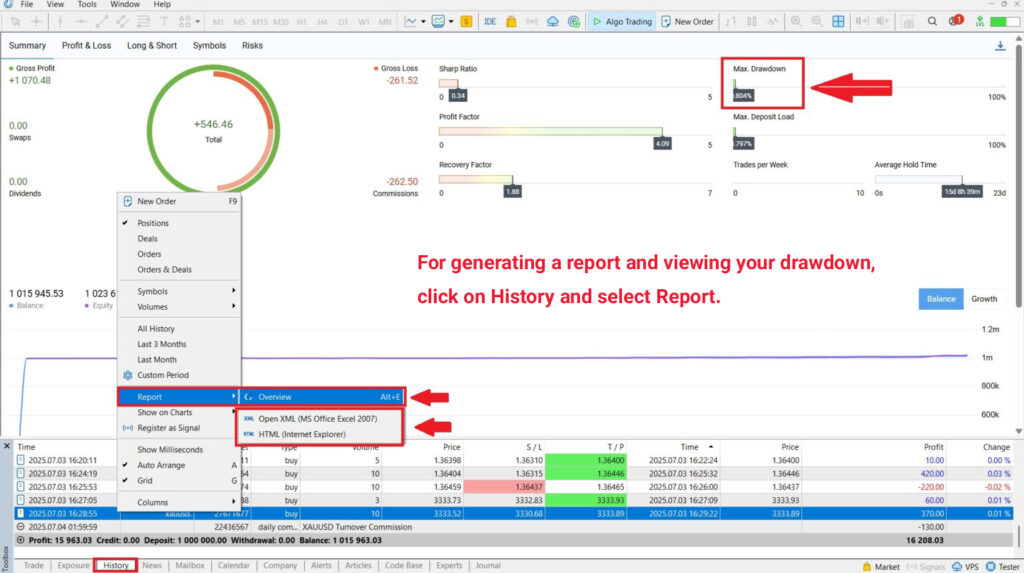
Step 2: Generate the Trading Report
In the same History tab, right-click and select:
- In MT4: Save as Report;
- In MT5: Report → HTML or Open XML.
A full report of your account will then be saved in HTML format or opened in your browser. In this report, you can see the values for Maximal Drawdown and Relative Drawdown.
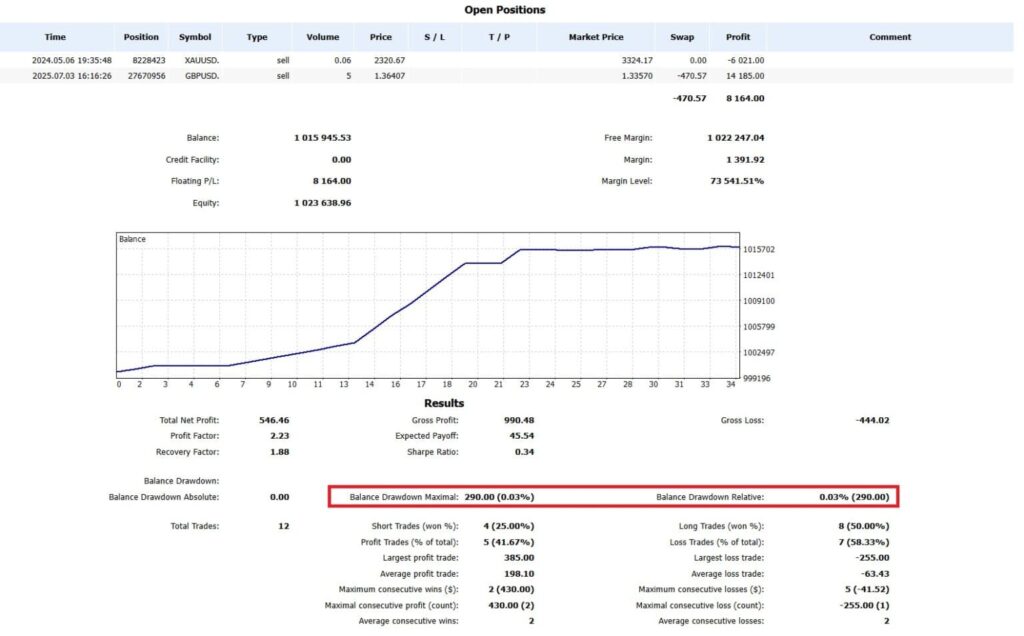
- Or click on Report.
- By selecting Report, a concise visual summary is displayed directly within the MetaTrader window.
- Because this report is simplified, it only shows the Maximum Drawdown (MDD).
How to Interpret Relative Drawdown and Maximum Drawdown in MetaTrader
If a strategy is profitable but has a high Maximum Drawdown (MDD), using it in practice can be difficult due to the psychological pressure and the increased risk of a margin call.
By contrast, Relative Drawdown is more flexible and often gives a better description of the overall state of the account, especially when equity is growing over time.
In general, the following ranges are useful when interpreting drawdown percentages:
| Metric | Good | Average | Dangerous |
|---|---|---|---|
| Maximum Drawdown | Below 10% | 10%–25% | Above 30% |
| Relative Drawdown | Below 10% | 10%–20% | Above 25% |
If your strategy shows more than 20-25% Relative Drawdown or more than 30% Maximum Drawdown, it probably needs a review of money management and entry/exit rules.
The Impact of Drawdown on a Trader’s Psychology and Capital
Drawdown is not just a number; its psychological pressure can be more destructive than the financial loss itself. A decline in equity, especially when it happens repeatedly, directly undermines a trader’s confidence. This can lead to anxiety, fear of entering new positions, and, in severe cases, abandoning the market altogether.
In periods of deep drawdown, emotional decision-making increases. A trader may start revenge trading without proper analysis, which only accelerates the decline in equity. In some cases, a margin call is the direct result of this behaviour.
Chronic drawdown can also create a cycle of mental defeat that is extremely hard to break. At such times, trading psychology and awareness of the psychological impact of drawdown in Forex become crucial. To get through this phase, using a trading journal, carefully analysing the pattern of equity declines, and consulting with experienced traders can act as an anchor for psychological stability.
How Can We Reduce Drawdown?
Reducing drawdown requires a combined approach that includes trading strategy, market psychology, and strict risk management rules. The first step is to reduce position size and control the risk-reward ratio. Traders should avoid opening large positions, especially in uncertain market conditions.
Using clearly defined stop-loss levels, setting realistic profit targets, and reviewing past trades through a trading journal are all effective methods. Lowering dependence on high leverage and focusing on trade quality rather than quantity directly reduces drawdown.
In addition, designing strategies that diversify and do not rely entirely on a single market or instrument helps lower the risk of equity decline. Continuous education and testing strategies on demo accounts also play an essential role in this process.
The Relationship Between Drawdown and Money Management
Without a clear capital management framework, drawdown can quickly wipe out a trading account. Money management means defining the exact risk per trade, adhering to margin rules, and controlling leverage use. Traders who enter the market without a plan often experience both psychological and financial breakdown after the first severe drawdown.
Planning an acceptable maximum drawdown level (for example, 20% of total equity) can serve as a strong defensive shield. This threshold should be set so that recovering from it is realistically possible, without forcing the trader into aggressive or irrational behaviour. In practice, the more disciplined the money management, the more controlled the drawdown will be, and the smoother the capital growth path becomes.
What Is an Acceptable Drawdown in Forex?
The answer to what constitutes a “good” drawdown in Forex depends on experience level, strategy type, and market conditions. However, in professional trading, a drawdown of 5% to 15% is generally considered reasonable and acceptable. In some conservative strategies, even a drawdown of 10% or less is considered ideal.
A drawdown of more than 20% is usually treated as a serious warning. The reason is that recovering from a significant drop requires disproportionately higher returns. For example, if your account falls by 50%, you need a 100% gain to get back to break-even. Keeping drawdown within a controllable range not only protects capital but also minimizes psychological pressure on the trader.
Does a High Drawdown Indicate High Risk?
A high drawdown is often a sign of excessive risk-taking in trading. This risk may stem from large position sizes, improper use of leverage, or the neglect of risk management rules. The higher the risk per trade, the more likely it is to experience sharp equity declines.
That said, a high drawdown does not always mean the strategy itself is fundamentally flawed. In some cases, markets go through periods of exceptional volatility during which even robust strategies suffer temporary equity declines. However, if such deep drawdowns recur, it is necessary to question the strategy’s structure.
Overall, a high drawdown is a red flag for any trader. If you are facing significant drawdowns, it is time before the market “settles the score” with you to review your trading journal, identify weaknesses, and implement the required adjustments.
Advanced Performance Analysis: What Is the Recovery Factor?
The Recovery Factor is one of the key metrics in performance analysis. It helps you understand how well a system can return to profitability after a significant loss.
According to Medium, the Recovery Factor shows how effectively a strategy recovers to its initial profitability after a drawdown. Its formula is:
Recovery Factor = Net Profit ÷ Maximum Drawdown
In this formula:
- Net Profit: The total profit generated by the trading system from the start until now.
- Maximum Drawdown: The most significant drop in account equity from a peak to a trough before a new peak is reached.
A strategy with a high Recovery Factor rebounds quickly after significant losses. A low Recovery Factor indicates weak recovery from drawdowns and suggests the system may not be reliable in the long term.
From another angle, the Recovery Factor is a quality metric for a trading strategy’s performance: it shows how much profit the system has generated relative to the risk taken, with the Maximum Drawdown representing that risk.
- The higher this ratio, the more stable the strategy and the lower its relative risk.
- A ratio below one usually signals a high-risk or inefficient system.
Example:
Assume a trader uses two strategies, A and B, and wants to evaluate their stability and efficiency using the Recovery Factor.
- Strategy A:
- Net Profit = $1,000;
- Maximum Drawdown = $500;
- Recovery Factor = 1,000 ÷ 500 = 2 → efficient and relatively stable.
- Strategy B:
- Net Profit = $1,000;
- Maximum Drawdown = $1,000;
- Recovery Factor = 1,000 ÷ 1,000 = 1 → high risk with only average return;
In essence, the Recovery Factor helps you look beyond how much profit a system makes and evaluate the quality and sustainability of that profit.
Daily and Overall Drawdown in Prop Firms: The Rules Every Trader Must Know
In prop trading, where traders operate with the firm’s capital, respecting drawdown rules is the most essential requirement for passing evaluations. Two key metrics, Daily Drawdown and Overall (Maximum) Drawdown, determine how much risk a trader is permitted to take. Understanding these rules prevents instant violations and increases the chances of getting funded.
What Is Daily Drawdown?
Daily Drawdown is the maximum loss you are allowed to take within a single trading day, measured based on equity, not just balance. It includes both closed losses and floating drawdowns during the day.
Most prop firms calculate the daily limit from the previous day’s closing equity. It means the limit does not increase during the day, even if you make profits.
Example
- Yesterday’s closing equity: $10,000;
- Daily loss limit: 5%.
You must keep your equity above $9,500 at all times. Even a short intraday dip below this level results in a violation.
What Is Overall / Maximum Drawdown?
Overall Drawdown is the maximum amount your account can fall from its highest approved value over the entire evaluation period. Unlike daily Drawdown, this limit does not reset each day.
Prop firms use two main models:
Static Drawdown
A fixed level below the initial balance. For example, with a 10% max loss on a $10,000 account, your equity must never fall below $9,000.
Trailing (Relative) Drawdown
The limit rises as profits rise. If the account grows from $10,000 to $12,000, and the max loss is 10%, the new protected level becomes $10,800. Trailing Drawdown usually locks at the initial balance once reached.
Example of Maximum Drawdown
- Starting balance: $10,000;
- Equity peak: $15,000;
- Later drops to: $9,000.
Maximum Drawdown = 40%, since the drop is measured from the highest point.
Why These Rules Matter
- Daily Drawdown protects the firm from high intraday risk.
- Overall, Drawdown ensures long-term discipline.
- Even a momentary dip in equity below the limit triggers an automatic failure.
Mastering both rules is essential for successfully passing prop firm challenges.
Daily drawdown measures changes in equity over a single day, whereas overall drawdown measures changes in the account balance over a longer period.
Why Is Strict Risk Management Critical for Passing Prop Firm Challenges?
Strict risk management is essential for passing prop firm challenges because these firms enforce tight daily and overall drawdown limits. Breaching either limit results in an immediate failure of the challenge, and excessive drawdown is statistically the most common reason traders lose these accounts.
To stay within allowable drawdown thresholds, traders must apply:
- Well-defined stop-loss rules;
- Proper position sizing and fixed risk per trade;
- Active position management;
- Continuous monitoring of both equity and balance drawdown.
These practices provide precise risk control and significantly reduce the probability of violating firm rules.
Additionally, understanding how to use pending orders, such as Buy Limit and Sell Limit, can help traders secure better entry prices and tighter stop-loss distances, indirectly improving drawdown management.
Conclusion
Drawdown is not just a number; it is the red line of survival and an accurate measure of the quality of your strategy and risk management: the lower and more controlled the drawdown, the faster the recovery and the lighter the psychological burden. A professional trader has learned to manage losses, not just chase profits.
The vital but straightforward rule is: Survival first, profitability second. If you control drawdown, the market will always offer you new opportunities to grow your capital.