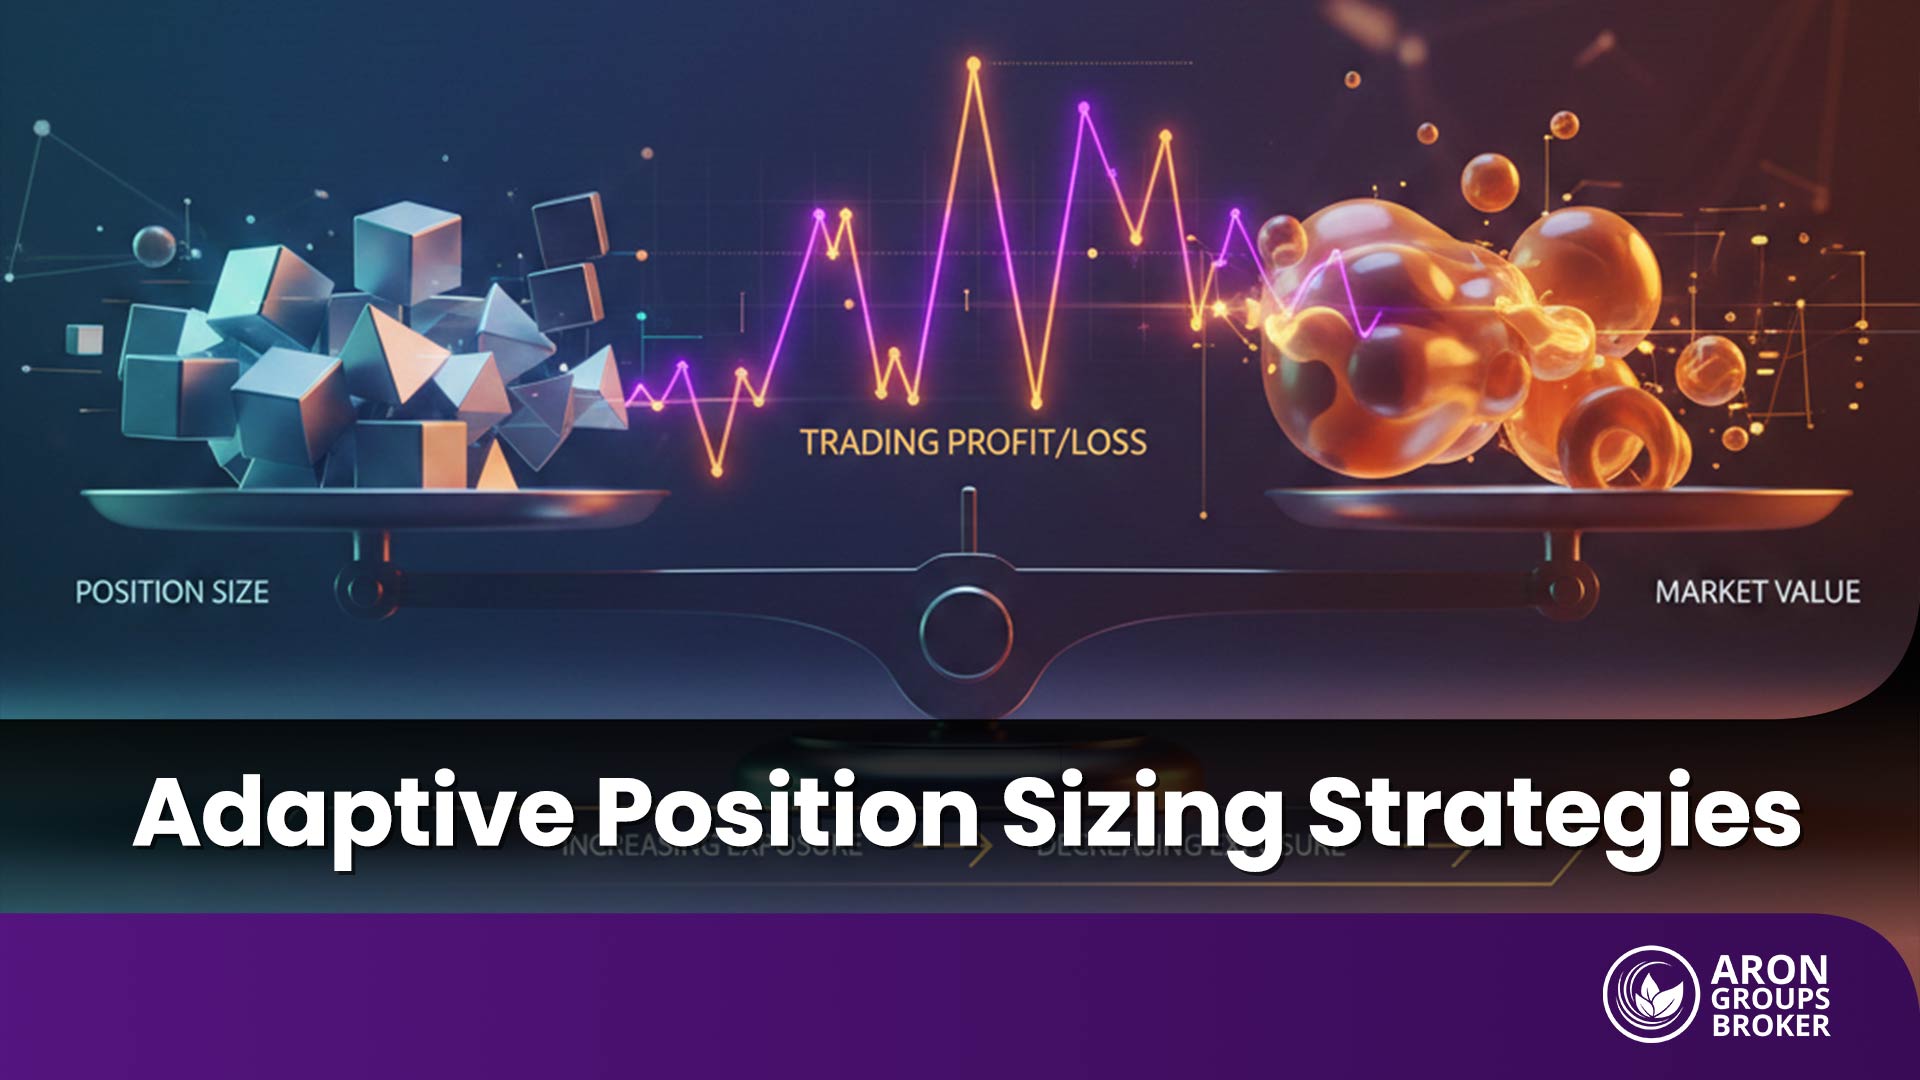


Most heavy losses come from choosing the wrong position size for the trade. Markets do not keep risk conditions stable, so a fixed lot size produces unstable exposure as volatility changes.
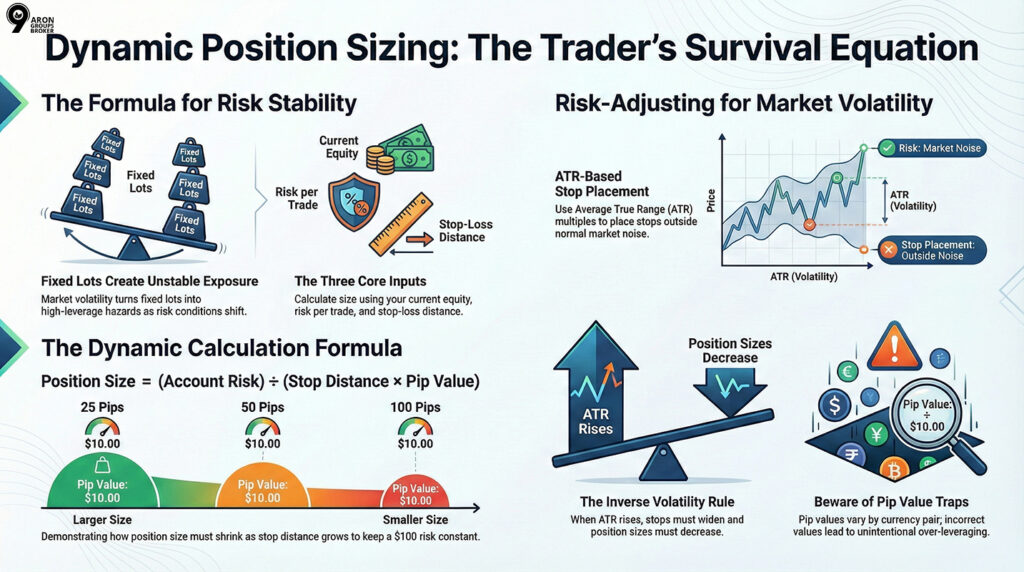
This is why dynamic position sizing matters for survival. Instead of keeping the lot size fixed, you keep the risk fixed and let the size adjust to conditions. The framework is mechanical and repeatable.

- Dynamic position sizing treats risk as the constant, and lets lot size flex with stop distance and volatility.
- ATR position sizing converts market movement into a measurable input, so sizing adapts before volatility damages your equity curve.
- A position sizing model fails fastest when pip value is wrong, especially on cross pairs and non-USD accounts.
- Portfolio sizing is not “more trades”; it is volatility scaling plus correlation control to avoid hidden concentration.
What Is Dynamic Position Sizing?
According to the International Trading Institute website, Dynamic position sizing means your trade size is not fixed; it adjusts with risk conditions. What becomes “dynamic” is not the lot number itself, but its relationship to stop distance and market volatility. So, instead of trading a constant size every time, you recalculate the size using risk inputs on each trade.
The Difference Between Position Size and Risk Per Trade
Position size is the output of the calculation: the lot size you finally place. The inputs are clear:
- equity,
- risk per trade,
- and stop-loss distance.
You first decide how much of your capital you are willing to risk on that trade. Then you derive the position size from the stop distance.
The main objective is to keep cash risk stable, even when the stop distance changes due to structure or volatility. In simple terms, when the stop must be wider, the position size must be smaller to keep the same monetary risk.
Why This Is Risk-Adjusted Position Sizing
This approach is risk-adjusted position sizing because it removes emotion from sizing decisions. Sizing should be guided by a formula, not by fear or excitement.
A simple example:
Assume you always risk 1% of your equity.
- If the first trade uses a 25-pip stop, you can set a larger position size.
- If the second trade uses a 75-pip stop, your position size must be smaller.
The risk stays constant while the size changes. That is real risk control, not discretionary changes in lot size.
Q: Can dynamic position sizing improve a losing strategy?
A: No. Dynamic position sizing does not create an edge. It controls how risk behaves while your edge plays out. If a strategy has negative expectancy, better sizing only slows the loss; it does not reverse it.
Why Fixed Lot Sizing Fails in Changing Markets
Fixed lot sizing stays loyal to a constant number, but the market does not stay loyal to constant risk conditions. Risk inputs shift continuously, so a fixed lot creates unstable exposure over time.
Risk Is Not Constant Because Stop-Loss and Pip Value Are Not Constant
In real trading, a “lot” is not a unit of risk. Your risk unit is the product of the stop-loss distance and the pip value.
Even if your stop distance does not change, your monetary risk can still change. That is because pip value is not identical across symbols and forex pairs, and it depends on your account currency.
So, one lot on two different pairs can produce two very different cash risks. You may think you are trading consistently, but you are not risking consistently. This is why a robust position-sizing model cannot rely solely on fixed lots.
How Volatility Damages Stops, Exposure, and Your Equity Curve
When volatility rises, the market not only moves faster; it also becomes less orderly. Ranges expand, and price has more room for normal movement within each session. Stops that were sensible in a calm regime can end up inside noise. Traders often widen their stops to avoid being stopped out mechanically.
If you keep the lot size fixed at that moment, your exposure becomes heavier. Cash risk inflates, and losses start clustering across consecutive trades.

That is the logic of a market regime:
The market does not exist in a single stable state. Your sizing should not behave as if conditions are always the same. This is exactly where dynamic position sizing becomes a survival tool.
Quick Comparison: Fixed Fractional vs Dynamic Position Sizing
To make the difference practical, use this comparison:
| Method | What stays fixed? | Main weakness |
|---|---|---|
| Fixed fractional | Risk as a % of equity | Breaks if the stop placement or pip value is misestimated |
| Dynamic position sizing | Risk + stop distance + volatility regime | Requires consistent volatility measurement and precise execution of the formula |
Position Sizing Model: Three Core Inputs and One Output
A practical position-sizing model requires only three inputs and produces one output. The inputs are:
- equity,
- risk per trade,
- and stop-loss distance.
The output is your position size the trade volume you enter on the platform.
When these inputs are accurate, your sizing becomes logical and repeatable. If one input is wrong, even strong analysis yields the wrong risk.
Risk Per Trade as the Primary Input
Your risk per trade should match your experience level and drawdown tolerance, not your profit target. Newer traders usually survive longer with lower risk because execution errors are more common early on.
As a baseline, risking 0.5% to 2% of equity per trade is widely used. The right number depends on your trading style, trade frequency, and acceptable drawdown. The key point is repeatability. Each trade should be sized using the same logic, not the mood of the day.
Equity and the Common Mistake: “A Bigger Account Means Bigger Risk”
A higher equity should increase your position size gradually, not increase your risk percentage. If you raise the risk percentage, you increase the speed of account damage as well.
The correct growth logic is simple:
- Keep the risk percentage constant.
- As equity grows, the risk amount increases.
- Then the position size expands naturally and in a controlled way.
The objective is stable growth, not short-term spikes with heavy drawdown risk.
Regime Detection Before Sizing: High vs Low Volatility
Before you calculate position size, you need to identify the market regime. In high-volatility regimes, execution error and slippage risk increase materially.
Practical Signals for Regime Identification
Common signals of high volatility include:
- Rising ATR and larger-than-normal candle ranges.
- Long candles and rapid back-and-forth swings over short windows.
- Unstable spreads or sudden spread expansions during sensitive periods.
ITI sources also reference ATR and even VIX as inputs for regime identification.
Sizing Logic Across Regimes
- In low volatility, stops are usually tighter and more precise. So you can size larger within the same risk limit because the stop distance is smaller.
- In high volatility, the stop must sit further away to avoid normal noise. So your position size must be smaller to keep cash risk stable and control slippage.
ATR Position Sizing: A Practical Method for Volatility-Based Position Sizing
ATR position sizing is one of the most practical ways to implement volatility-based position sizing. In this approach, you measure volatility using ATR, set your stop based on that volatility, and then size the trade.
The objective is simple:
Keep your monetary risk, or cash risk, stable across changing conditions.
Why ATR Works Well for Position Sizing
ATR has one key advantage: it measures price movement, not direction. It does not tell you whether the market is bullish or bearish; it tells you how far the price typically travels.
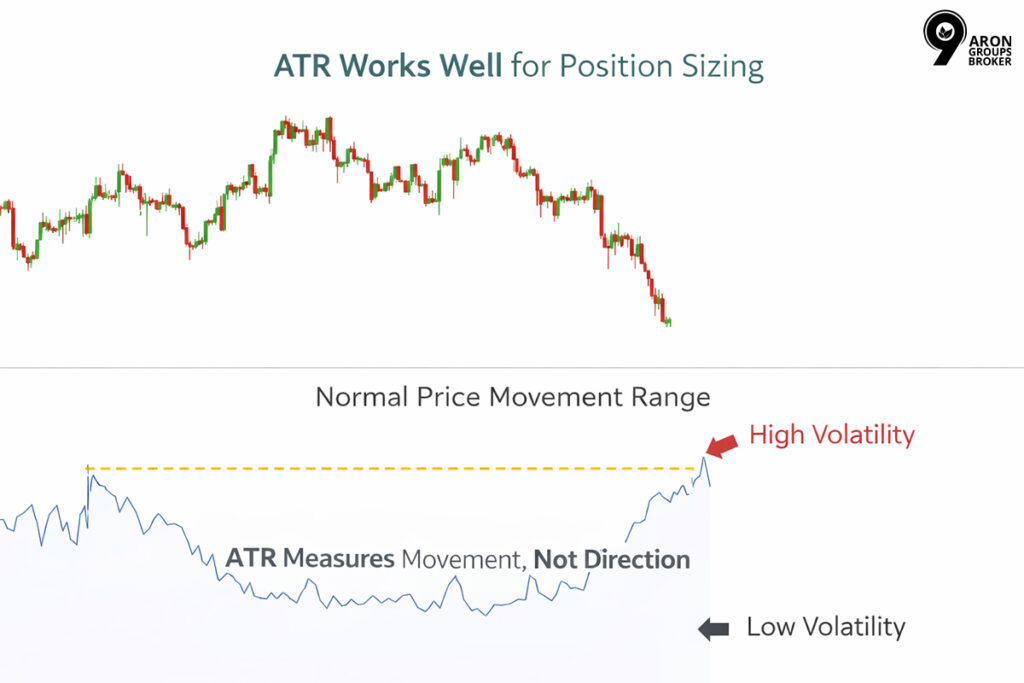
For sizing, that is exactly what you need. Your position size should match the market’s “normal movement range,” not your directional conviction. When the movement range expands, a sensible stop usually needs to sit further away. ATR helps you set that distance using data rather than emotion.
Building an ATR Stop Using ATR Multiples
First, choose an ATR period that fits your timeframe. Many traders start with 14 periods, but it is not a universal rule. On shorter timeframes, a shorter period may respond faster to volatility shifts. For swing trading, longer periods often provide more stable readings.
Next, choose an ATR multiple, how many ATR units you use for stop distance. This should not be a random number. The multiple must match your strategy logic:
- If your entry is precise and close to a level, a smaller multiple may be sufficient.
- If the market is more volatile or the structure needs breathing room, a larger multiple is usually more appropriate.
In practice, a 1.5× to 3× ATR range is common for stops. The right value is the one that remains stable in your backtests and in live execution.
The Core Relationship: When ATR Rises, Position Size Falls
The logic of ATR position sizing is straightforward. When ATR rises, the market is moving more, so your stop usually needs to be wider to avoid normal noise. Once the stop is wider, your position size must be smaller to keep cash risk constant.
This is mechanical risk control, not a change in confidence. You are simply executing a consistent position sizing model under a new volatility regime.
Example:
Assume your equity is $10,000 and your risk per trade is 1%. Your risk budget is therefore $100 per trade.
Using ATR and your chosen multiple, assume your ATR stop distance is 50 pips. If the pip value for 1 standard lot on that pair is $10, then the risk for 1 lot is:
50 × 10 = $500
To keep your risk at $100, your dynamic lot size calculation becomes:
100 ÷ 500 = 0.20 lots
The point of this example is to show how the sizing output comes directly from risk inputs. As the stop gets wider, the lot size naturally decreases.
Portfolio Models for Forex: Risk-Adjusted Position Sizing Across Multiple Pairs
When you trade a single instrument, sizing mainly depends on the stop and the risk on that one trade. In a forex portfolio, the problem becomes larger: several pairs can load the same underlying risk at the same time. That is why risk-adjusted position sizing must account for both each pair’s volatility and the correlation between pairs.
Volatility-Scaled Positioning Across Instruments
Not all forex pairs carry the same risk behaviour. For example, EURUSD often shows smoother movement and more stable spreads. By contrast, GBPJPY frequently delivers wider ranges and sharper intraday swings.
If you trade both pairs with a fixed lot or even a similar size, your risk will not be equal. The core rule of volatility-scaled positioning is simple: the higher the volatility, the smaller the position size, keeping risk contributions more balanced across the portfolio.
This prevents you from unintentionally placing larger bets on the most volatile pairs.
Correlation Spikes and Hidden Risk Concentration
In forex trading, the danger is not only the volatility of one pair; it is also the synchronised movement across pairs. You may hold EUR/USD, GBP/USD, and AUD/USD at the same time and believe you are diversified. But if the US dollar trend strengthens or risk-off sentiment hits, those positions can behave like one trade.
This is hidden risk concentration:
Different-looking positions driven by the same risk engine. A practical solution is to cap exposure at the correlated cluster level. Instead of limiting each trade in isolation, you limit the combined risk across a correlated group.
Kelly Criterion: Practical Overview and Limits
The Kelly Criterion attempts to calculate an optimal bet size from your edge. Its main weakness is sensitivity: it relies on accurate estimates of win rate and payoff ratio. When those inputs are estimated with error, Kelly amplifies that error into larger position sizes.
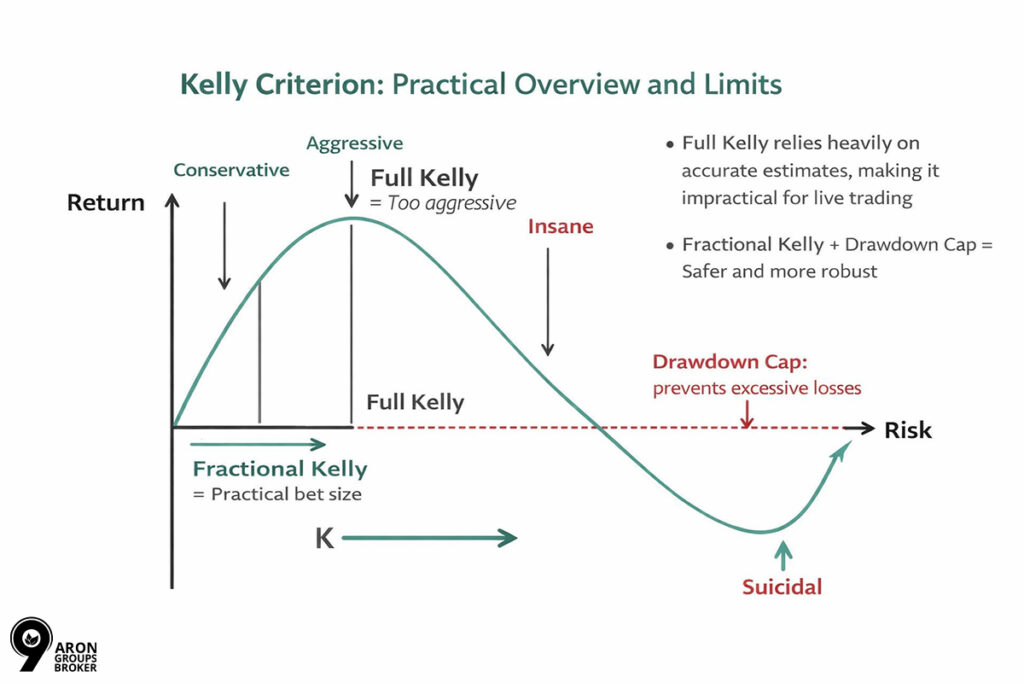
That is why full Kelly is usually too aggressive in live trading. A more practical approach is fractional Kelly, combined with a strict drawdown ceiling. Without a drawdown cap, sizing can become destructive during adverse regimes.
Equity Curve Feedback to Reduce Risk of Ruin
One of the most effective account protection tools is equity curve feedback. You adjust risk based on the account state, not on emotion or a short run of wins or losses.
The basic rule is straightforward: After a predefined drawdown threshold, you reduce your risk percentage. You restore risk only after the account has recovered a meaningful portion of the decline.
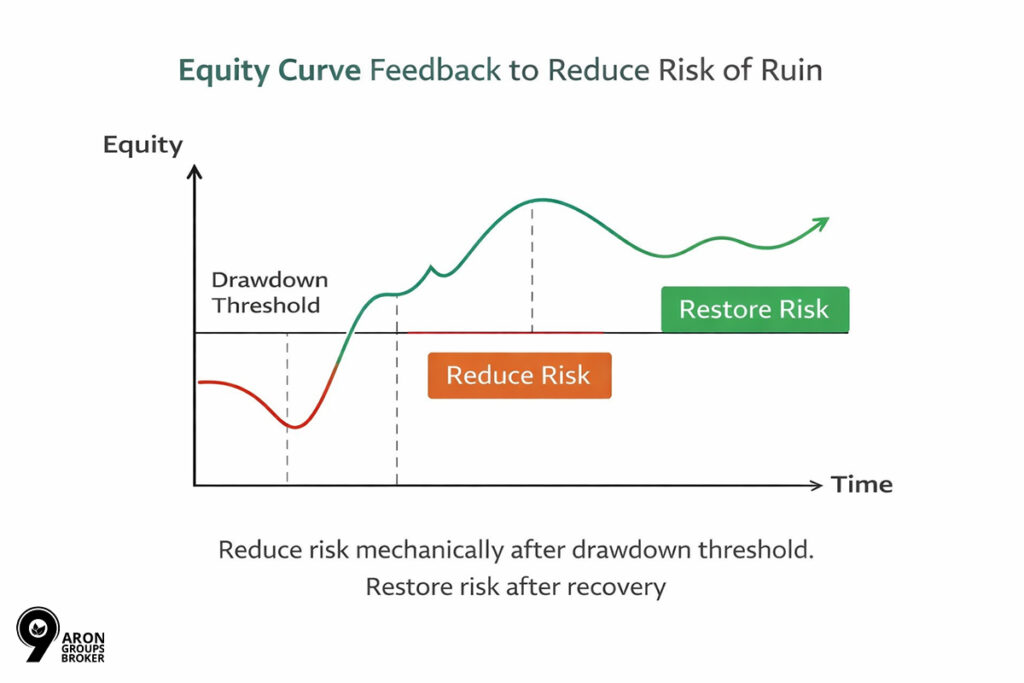
This is directly linked to the risk of ruin. If you keep risking the same amount through a bad regime, the chance of reaching an unrecoverable drawdown rises. By reducing risk mechanically during drawdowns, you slow the damage and increase survival odds.
Dynamic Lot Size Calculation: Formula, Lot Conversion, and a Position Size Calculator
Until you can perform dynamic lot size calculation correctly, dynamic position sizing remains an idea, not a process. This section provides a clean formula, key details on pip value, and a practical execution checklist.
The Core Dynamic Lot Size Calculation Formula
In forex, trade size is derived directly from your monetary risk and your stop distance. First, define the cash amount you are willing to lose on the trade. Then divide it by the cost per pip at the chosen size.
Formula:
Position size = (Account risk per trade) ÷ (Stop distance in pips × pip value)
One point matters here: if your pip value is wrong, your position size output is wrong. That breaks the entire position sizing model and defeats risk-adjusted position sizing.
Pip Value Across Different Forex Pairs
The biggest sizing trap is assuming the pip value is always the same.
This mistake is most common with cross pairs, such as EURGBP, GBPJPY, or AUDCAD.
Why? Because pip value depends on:
- Your account currency;
- The pair’s quote currency;
- Your broker’s contract size and lot definition.
Mini-check before calculating pip value:
- Account currency: USD, EUR, or something else?
- Quote currency: USD or another currency?
- Contract type: standard lot or mini/micro?
- Decimal format: pip vs pipette definition on your platform
If you do not verify these inputs, you may believe you are risking 1%, while actually risking 2% or 3%.
When to Use a Position Size Calculator
A position size calculator is useful when you want a fast, low-error sizing output. It is especially helpful for cross-pairs, where currency conversion is less intuitive.
The main advantages are speed and fewer manual errors at entry. But there is a critical warning: always verify your broker’s contract specs. If lot size definitions, contract size, or pip conventions differ, the calculator output can mislead you.
Quick Pre-Entry Checklist
Before you press Buy or Sell, confirm the following:
- Entry: the exact entry price or entry zone
- Stop: stop location and stop distance in pips
- Risk per trade: the percentage or cash amount you will risk
- Pip value: calculated and verified for that pair and account currency
- Size: the final position size (lots or units)
- Execution costs: spread, commissions, and slippage risk, especially near news
If these six items are not clear, your sizing becomes random, even if your strategy is strong.
Adapting Dynamic Position Sizing to Trading Style and Account Type
Dynamic position sizing follows a consistent formula, but the implementation must match your trading style and account constraints. Real risk is not only theoretical; execution costs, slippage, and broker or prop rules define the outcome in practice.
Scalping vs Intraday vs Swing
- Scalping:
In scalping, entries and exits are fast, and execution costs become a large part of performance. Spread, commissions, and slippage can turn a strong setup into a poor trade. That is why sizing must be more conservative, with an error margin for imperfect fills. - Intraday:
For intraday trading, the “session regime” matters more than many traders expect. During session overlaps or around scheduled news, both volatility and spreads can change quickly. Before you set the size, you need to know the market conditions you are trading in that day. - Swing:
Swing trades typically require wider stops to allow normal price movement. Here, ATR helps you build a stop that fits the market’s movement range. When the stop distance increases, the position size must decrease to keep the cash risk stable. This is where ATR position sizing becomes a practical form of risk-adjusted position sizing.
Small Accounts vs Large Accounts
- Small accounts:
Small accounts face two common constraints. First is the minimum lot size, which may prevent fine-grained sizing. Second is cost pressure, because spreads and commissions represent a larger percentage of capital. In this context, accurate pip value estimation and low-cost setups matter more. - Large accounts: In larger accounts, the minimum lot size is usually not the bottleneck. The bigger issue is liquidity and market impact. If the trade size is too large, filling at the intended price becomes harder. Even with a solid position sizing model, you must verify that the market can absorb your size.
Prop Firm Challenges: Rules and Risk Model
In prop trading, risk should be derived from the rules, not personal preference. Two numbers typically define your constraints: the daily loss limit and the max loss limit. Your risk per trade must be set so that even a losing streak does not breach those limits.
For Example: If the max loss is tight, you cannot swing trade with the same risk you use elsewhere. You must reduce risk or limit concurrent positions. This is where dynamic position sizing must align with account rules to protect survival.
High-Impact News and Extreme Volatility
In extreme volatility, sizing calculations alone may not be sufficient. Price can open with a gap, or orders can be filled with meaningful slippage.
A simple operational rule is this:
Before major news, reduce your risk per trade or reduce your position size. The reason is clear: if execution is worse than expected, your cash risk can exceed your plan.
This is the difference between “paper risk” and real execution risk.
Q: Should position sizing change when execution quality deteriorates?
A: Yes. During periods of poor liquidity, widening spreads, or unstable fills, theoretical risk calculations underestimate real exposure. In these conditions, reducing size or risk per trade is often more effective than adjusting stops alone.
Backtesting a Dynamic Position Sizing Model Before Going Live
Before applying dynamic position sizing to a live account, you should backtest it. The goal is not only to see “how much it profits.” The main goal is to confirm whether your model is durable and reliable across different market regimes.
ATR vs Historical Volatility in Backtests
If your model is built around stop placement and stop distance, ATR is usually the better fit. ATR measures the market’s movement range directly, which aligns well with stop-based sizing. As a result, ATR position sizing can connect stop logic and position size more cleanly in backtesting.
By contrast, historical volatility is more useful for risk scaling at the portfolio level. It helps when you compare multiple instruments and balance risk across them. In that context, volatility is measured from returns and supports portfolio scaling decisions.
What Metrics You Should Measure
In backtesting, do not fixate on total profit. Profit without drawdown control can be a statistical illusion.
Three metrics deserve serious attention:
- Drawdown: the maximum equity decline and how long the account stays underwater.
- Worst streak: the most damaging run of consecutive losses, because streaks break accounts.
- Time to recovery: how long it takes the equity curve to recover after a drawdown.
The key point is this:
In sizing models, survival matters more than return. If your model cannot survive a bad regime, the profits from a good regime are not meaningful.
Common Backtesting Traps
One of the most dangerous mistakes is over-optimisation of the ATR multiplier. This happens when you keep adjusting the multiplier until the past looks perfect. The model then collapses later because it was fitted to a specific historical window.
The second trap is ignoring real execution costs. If you do not include spread and slippage in the backtest, the results look excellent on paper. But in live trading, especially when markets are volatile, performance tends to fall short of expectations.
A proper backtest produces smaller, more realistic results, not large, imaginary ones.
Q: How do you know if your position sizing rules are working over time?
A: A sizing framework is working if drawdowns stay within planned limits, losing streaks remain survivable, and recovery time does not expand as equity grows. Stability metrics matter more than short-term return spikes.
Common Mistakes in Lot Size Calculation and Sizing Execution
Most sizing errors do not come from a “complex formula.” They come from wrong inputs and inconsistent execution. If the lot size calculation is incorrect, even a profitable strategy can end in a severe drawdown.
Sizing Without a Defined Stop-Loss
Without a stop-loss, you do not know the maximum loss on the trade. If the stop is undefined, risk per trade has no meaning because the risk unit is not set.
In that situation, the lot size becomes a guess. The market will still find an exit point for you, even if you did not define one.
Pip Value Errors and Mispricing in Cross Pairs
One of the most common mistakes is miscalculating pip value in cross pairs. Pip value is not only about stop distance; it also depends on the account currency and the quote currency.
A simple example:
Assume your account is in USD and you trade GBPJPY. If you treat pip value as if it were a USD-quoted pair, your sizing output will be wrong. You may believe you are risking 1%, while actually taking a larger cash risk.
Emotional Risk Changes After Wins or Losses
Some traders increase risk after a few wins because they feel “in control.” Others cut risk sharply after losses and damage to the recovery process.
This behaviour makes risk unpredictable and prevents proper backtesting. Sizing must be rule-based, adjusted by predefined rules, not emotions.
Ignoring Real-World Execution Costs
Some traders size correctly but assume execution costs are zero. In reality, spread, commissions, and slippage are part of real risk.
In fast markets, even a gap can trigger a stop at a worse price than expected. If your model ignores these factors, your cash risk will be higher than you think.
Proper sizing means measuring risk on execution, not only on the chart.
Conclusion
Dynamic position sizing is not about trading bigger or smarter; it is about staying alive long enough for your edge to work. By fixing risk instead of lot size, you prevent volatility, execution noise, and regime shifts from silently damaging your equity curve.
ATR-based sizing, portfolio-level risk control, and equity curve feedback turn sizing into a mechanical process rather than an emotional reaction. When position size is derived from stop distance, volatility, and account state, losses become manageable, and recovery remains possible.
In the end, consistent survival, not isolated returns, is what allows performance to compound.