


The backtest results are deceptive. For example, in back-test results, the trading strategy looks perfect on historical data and yet the reality is quite different.
If trading conditions are not right for a strategy, it can break down exceedingly quickly. Especially the case in forex and crypto, where spreads are widening, liquidity changes hands all over the place and regime shifts could occur at any moment without warning.
Overfitting occurs when a system learns from noise rather than the true market structure. The result is a backtest illusion. Performance looks great; the parameters could hardly be more precise, but the results depend on a narrow time period or a unique market condition.
In leveraged markets, the cost is high. Overfitting leads to deep drawdowns, lost time and reduced confidence.
This guide cuts through the jargon and explains how a machine learning model or a rule-based system can be overfit.

- The strongest backtest is still just a hypothesis. There is no evidence yet.
- Overfitting optimizes for noise, not an edge.
- The biggest risk is strength in the in-sample period, coupled with an abrupt collapse out of it
- Exchange rate arbitrageurs offered a killer double blow.
- Forex and cryptocurrency trading have accentuated the cost, as well as leverage increases and new trading rules are adopted.
- Consider Strict validation and tests of robustness.
- In theory, minor adjustments should not dull your edge.
Overfitting in Trading Systems: The Backtest Trap and How to Avoid It
A backtest replays history in a controlled environment. Live trading is messy, changing, and expensive to execute. That gap is where overfitted strategies die.
Backtesting overfitting: why backtests can be misleading
Refine the rules to enhance historical performance and backtests from becoming unreliable.
The strategy begins to replicate chance features in the data rather than lasting behaviour. While the equity curve appears smooth, the edge may stem from the sample, not the market. This is backtesting bias at work.
Q: How to tell whether a trading strategy is robust or not?
A: If a strategy that looks robust under one set of conditions behaves similarly under slightly different ones, commentators term it robust. The evidence they pumped out:
- Try various time windows.
- Test different assets.
- Back test with as realistic as possible spreads, fees, and slippage.
- Move the parameters a bit and retest.
- Try different volatility regimes.
If a strategy is fragile, such as having to trade at the same price every time over small differences in input data, erase the edge.
Q: So, what is the risk of forex and crypto?
A: You can incur serious losses in the Forex market due to widening spreads, swings caused by news and interbank dealers’ rollover. In crypto, there is a charge for withdrawing funds; people who provide liquidity, such as exchanges or whales, suddenly stop their work; changing market structures turns into an instance that seems instantaneous. This is true in China and in each market on each occasion as well. If your backtest does not take these frictions into account, the edge could disappear overnight.

Use backtests to sense-check an idea. It's better to have a strategy which should survive or is at least robust against variations rather than one that looks good in one period of history.
What Is Overfitting in Trading and Why It Matters?
When a strategy becomes too dependent upon the very historical data it was designed to work with, overfitting occurs. Rather than simply finding a stable pattern, it will accommodate the various flukes, long sequences of luck and quirkish events.
It is often expressed in rules that seem comically specific, or in performance that is strong only within the dataset on which its building and training took place.
Q: Why Overfitting Matters?
A: It matters because trading decisions are made with real money under ambiguous circumstances. An overfitted model can lead you to size positions too aggressively, trust risk limits that are too optimistic, and deploy a system with little fortitude when normal market conditions such as spreads, volatility and regime variation crop up.
Overfitting Definition in Quantitative and Rule-Based Models
You should calibrate your model by avoiding overfitting. When a statistical model is said to be predicting overfitting, it detects patterns only evident in the training set data.
In rule-based strategies, it is possible to overfit in trading analyses by using overly tight tuning.
You may tune thresholds, filters, windows and entry and exit rules until it seems that everything is just right in the backtest reports, but then your strategy will be confined to only a small part of history.
Fundamental Characteristics of Overfitted Trading Systems
Some core fundamental characteristics of overfitted trading systems are listed below:
- Deterioration outside the build dataset.
- Brittle values mean small changes implying large jumps.
- Relying on a single regime or a single volatility state.
- Too much gratuitous logic with too many exceptions.
- Suspicious smoothness that disappears forward.
Curve Fitting in Strategy Design
Curve fitting is chart optimization gone mad, overfitting. It can resemble progress because every tweak eliminates a prior loss.
But history is often the guide, rather than the future. Favour backtests with more “errors” but fewer rule changes that are robust across trading environments.
Overfitting machine learning models in trading systems
Machine learning models can be great in research, with low error rates on historical data.
The reality of the market is that there is noise everywhere. Many patterns are ruled out. With enough size and enough trials for fitting a model, it can record beautiful backtest results without making substantial returns to investors.
In forex and cryptocurrencies, this danger is even greater than in most markets. There is strong non-stationarity of volatilities, liquidity and behaviour around news announcements, all of which change swiftly.
More features, more transformations and more hyperparameter tests will raise the possibility of finding a lucky model.
Top Takeaways for Machine Learning:
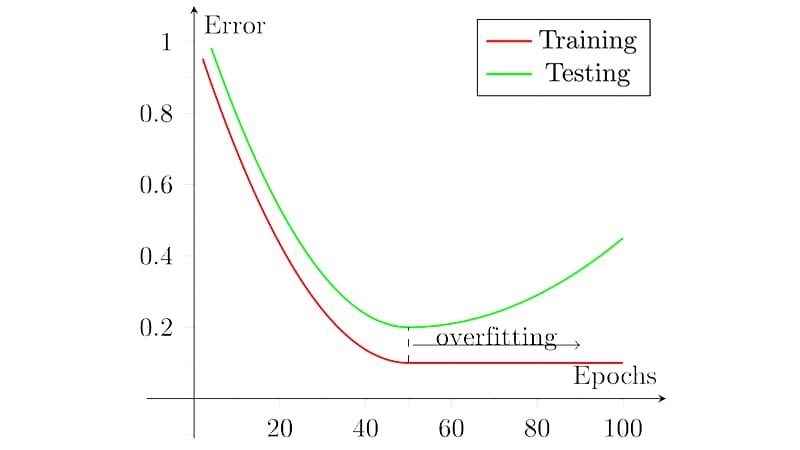
1. If a model is fitted to the sample data, it will probably be higher in-sample than out-of-sample.
2. Expect signal-to-noise to fall off, especially at short rates.
3. Do not think of regimes as fixed states; in reality, they are moving targets.
4. For example, limit the number of features and regularise.
5. Validate with time-based divisions, walk-forward testing, and realistic costs.
What is overfitting in machine learning?
A model can be overfit when it works very well, when we have fit with train data, and it does not work with other data, or any of a greater size, cannot be generalized.
The growing divide between training accuracy and actual performance is an alarm that the model has memorized the particular instance rather than the mechanism that generates subsequent results.
Why Predictive Trading Models Overfit Easily
Noise is the lifeblood of the financial market, and common signs of a trading edge are often subtle. Especially if your flexible models are fit to minimize error in any sense, they can learn to pick up noise. And the more you play, the greater the chance you will confuse random patterns for genuine signals.
Generalization Failure in Market Forecasting
Generalization failure is performance decay outside the development window. The model still outputs confident predictions, but outcomes drift. Strong backtest metrics alone are not enough. Demand acceptable performance among multiple unseen segments and conditions.
Overfitting vs Underfitting in Trading Models
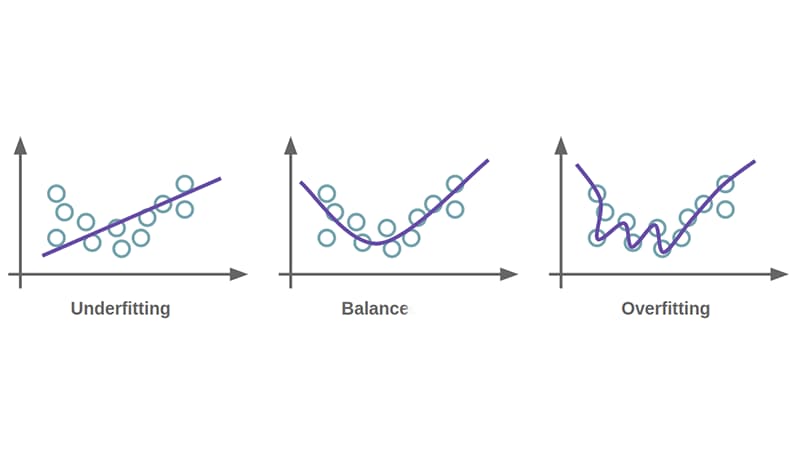
Generalisation failure means performance decays outside the development window.
The model may still produce confident outputs, but outcomes drift. Strong backtest metrics alone are not enough.
It is important for your models to produce the same results through different unseen datasets, time periods, and market conditions to be considered a robust model.
Model Intricacy and Optimal Fit
Complexity produces both patterns and noise. After a certain point, pliability captures accidental variation.
Key points to consider:
1. Release single window tables, performance, and look for acceptability in averaging across multiple time compartments.
2. Choose parameters surrounded by similarly good performance, not a single fragile optimum.
3. Keep logic explainable without special cases.
Backtest vs Live Performance Gaps
In this matter, the size of the gap is the key element:
- A small difference indicates the groundwork is solid and your system can bear heavy loads.
- A big difference shows you have built too much into your system, overly optimised it, are biased, or that hidden frictions somewhere cause real problems.
Diagnostic Signals of Poor Model Fit
Here are some key signals to consider for flagging a poor model fit:
- In-sample performance is great, while out-of-sample is poor.
- The Correlation Coefficient decreases notably when you move windows.
- An erratic parameter breaking.
- The equity curve is unreasonably smooth when compared with the noise in individual trades.
Practical Overfitting Examples in Strategy Development
Overfitting usually appears during the build, not the live stage. It occurs when repeated adjustments render a strategy the same as history in historical terms, rather than something which may always function in new conditions.
Overfitting within Algorithmic Strategy Design
The fast backtesting helps to try out thousands of variations and locate the one with the best equity curve. Without rigorous validation, taking the best-performing model often means picking the luckiest one.
Keep in mind:1.
Don't do parameter sweeps to make the curve pretty.
2. Do not try different types of models; stop with the best.
3. Do not revise rules after reviewing results.
4. Never optimize for a metric without validation.
Indicator Strategy Over-Optimisation
When you start adjusting all settings to get a tiny edge in backtest performance, that is when the indicators get dangerous.
This leads to brittle rules that only apply at a specific configuration.
Parameter Explosion in Multi-Factor Models
The more factors you add, the more combinations you can randomly “win.” Even when the edge is a mirage, a sufficiently big search space can yield a great backtest.
- As the factors & options grow, combinations grow fast.
- The optimal result is often a statistical anomaly.
- The more knobs, the more opportunities for overfitting noise.
Q: How to overcome parameter explosion in multi-factor models?
A: Limit search space, or strictly validate input.
Here we see how stuff multiplies, and this makes the final combinations grow:
| # Factors | Options per factor | Total combinations |
|---|---|---|
| 3 | 10 | 1,000 |
| 5 | 10 | 100,000 |
| 5 | 20 | 3,200,000 |
| 8 | 10 | 100,000,000 |
Hidden Risks of Over-Optimised Trading Strategies
Over-fitting not only compromises future performance. It also twists how you look at risk, scale your bets, and trust your trading method, especially in volatile forex or crypto markets.
Strategy Optimisation Bias and Parameter Errors
After trying many different combinations, if you select what seems to be a more appropriate result from this series for use in future trades, then you are effectively grabbing an outlier.
This is known as generation luck, and it normally appears as a painful discrepancy between historical testing performance compared with actual transaction results later on.
Where the bias sneaks in:
- Do not make small tweaks after each test.
- Do not pick the top performer out of dozens of trials.
- Do not freeze settings that only win in a single period.
Q: What does a parameter error look like?
A: If a marginal change in a parameter turns your outcome from a profit to a loss, then that should be considered as a warning. It implies that your strategy is sensitive to exact numbers rather than robust performance across reasonable ranges. They should tolerate small perturbations without breaking down.
False Signals and Performance Inflation
This can create a trap, where too many strategies get optimized and “find” what appears to be a market edge, but are simply capturing noise. This creates an output of artificially high returns and wrong risk estimates in backtests. When the strategy goes live, these illusions can cost a lot.
| What you see in testing | Why is it risky in live markets | Sanity check |
|---|---|---|
| Unrealistically High Win Rates with Tight Stop-Losses | Actual spreads and slippage can destroy the edge. | Re-run with wider spreads, fees, and slippage. |
| Smooth equity curve with low drawdown | The risk may be hidden by selection bias and over-tuning. | Test on a different time window. |
| Many small trades that add up perfectly | Costs, latency, and volatility spikes hit hardest within high-frequency style trading. | Test on related symbols, not just the original one. |
| Rare but huge “perfect” trades | Performance depends on a few lucky outliers rather than a repeatable edge. | Remove the top five trades and check whether it is still profitable. |
Fragility in Changing Market Conditions
Avoid being hunted by black swans in the market by following these simple steps:
- Assume break points will happen.
- Spread expectations around rollovers and releases.
- If it is made for a long time, think about expanding volatility.
- Crypto to be prepared for weekend gaps and funding flips.
Data Biases That Intensify Overfitting
Having a proven strategy on paper doesn’t necessarily translate to reality due to bias in either the data or the testing process.
These biases increase expected returns significantly and lead you to implement a rule which only works in an unrealistically strong testing environment. These effects lead to the distortion of historical performance.
Data Snooping and Multiple Testing
If you experiment with enough ideas on the same history, some will appear to be brilliant by coincidence. As the number of trials increases, it becomes easier to confuse chance with an advantage.
Practical guardrails:
- Decide evaluation rules before testing
- Keep a log of variants.
- You can still set a final test window, but then you can lock it so no one else can use it.
Look-Ahead Bias in Simulations
Look-ahead bias happens when your backtest uses information that was not available at decision time. That is generally the result of a timing error.
Survivorship Bias in Market Data
Survivorship bias appears when your dataset only contains assets that are still in operation. If failure or low investment is removed, a false sense of safety will be engendered.
Practitioners often warn to watch for these warning signs:
- Universes made up of today’s top-performing coins.
- Datasets where delisted assets simply disappear from the list without any record of loss.
- Backtests showing only strong results on pre-selected lists of assets.
Q: How to Reduce Survivorship Bias?
A:
- Utilize historical asset lists as a universe.
- Keep delisted assets in your data until they really stop trading.
- Test across different groups. Expand your asset list and compare important metrics, such as drawdown and hit rate, for each.
Validation Frameworks aimed to Detect Overfitting
A backtest isn’t enough. Validation is the process of subjecting your model to “passive” stress tests before it has to face real market conditions. The objective is to make sure that your strategy still holds up under completely different data, assumptions and conditions.
In-Sample vs Out-of-Sample Testing
In Three Steps:
- Split your historical data into two parts: In-sample construction and improvement of strategies, and Out-of-sample review.
- After tuning a strategy in the in-sample period, put it under lock and key.
- Run the strategy even once over the out-of-sample segment.
Note: Do not change your strategy or trade based on out-of-sample performance. That is your one chance to experience real-life exposure in simulation form.
A practical split guide
| If your data is | Common split | Why it works |
|---|---|---|
| Short history | 80% build, 20% test | Keeps enough data to build |
| Long history | 70% build, 30% test | Gives a tougher test window |
| Fast-changing market | The recent period was a test | Mimics real deployment |
Walk-forward analysis and strategy validation
During walk-forward testing, the data will be divided into parts repeatedly over time. This forces us to test the system gradually over time and recalculate it periodically.
What should you pay attention to?
- Check the reliability of most of the test windows.
- Look for constant parameter selection across time.
- Avoid a repeated pattern where training looks excellent, and testing looks consistently poor.
Simple configuration cases:
- Train for 3 years, then test for six months.
- Train for 5 years, then test for 1 year.
If the strategy works only right after optimizing and deteriorates quickly, it’s unstable.
Robust Backtesting Protocols
Juggle the various components because no single score is enough item:
| Item | What is the reason for the grant |
|---|---|
| Spreads and commissions | After costs, many edges vanish |
| Slippage and bad fills | Live execution does not always turn out well |
| Liquidity limits | Size has a finding in the matter |
| Trading constraints | Trading constraints also matter, such as session restrictions, financing costs, margin rules, and liquidity limits. |
Training Data Size and Overfitting Risk
Too few data points, too perfect data, or too narrow data can give the illusion of a working strategy.
More data leads to better results when it adds coverage, not just length.
Data Quantity vs Data Quality
- While quantity helps, it helps when it adds diversity: more regimes, more volatility regimes, more types of market behaviours.
- Quality is useful in removing distortions: bad timestamps, missing bars, wrong spreads, and biased universes.
Does increasing training data reduce overfitting?
It is better to say, how to increase data in a way that reduces overfitting?
Here’s how:
- Sprinkle in trend, range, crisis, and low vol regime diversity.
- Increased Instrument Diversity on Forex Majors and Liquid Crypto Pairs.
- Increase the number of independent samples with additional trades and different setups.
One simple rule: Add data before increasing complexity.
Feature Selection and Dimensionality Control
Feature expansion can outpace stable implementations. Redundant indicators multiply noise.
Q: How to avoid weak signals?
A:
- Limit feature count before experimenting.
- Regularisation is a way to shrink weak signals
- Favour stable feature families instead of single-use patterns.
- Drop one attribute at a time, and recheck robustness.
How to reduce overfitting in trading strategies?
Prevention is simple in principle. The tactic should be robust enough to withstand minor variations. The chase for the best back-test is not as important as developing a model which is reasonable across a number of slices, then validating it aggressively before risking capital.
Controlling Model Sophistication
Here’s how it’s done:
- Simple signals, 1 to 3 core signals, destroy 10 weak filters.
- Fewer rules, fewer indicators, fewer if clauses.
- Use rounded parameters, reasonable ranges, and simple position sizing.
If you cannot explain why it should work, treat it as noise until proven otherwise.
Robust Parameter Setting Methods
Robust Parameter Setting Methods to implement:
- Avoid sharp peaks. Prefer parameter regions where performance stays acceptable across nearby values.
- Make your first pass tuning with wide steps and stop when the gains get small.
- Don’t aim too hard for high profits: add drawdown and number of trades to your target, optimize for stability.
- Re-Test with Small Changes: If results switch from good to bad, it is most likely a Curve Fit.
Cross-Validation in Trading Systems
The aim is to perform “good” across many tests, not “great” in a specific test.
- Perform proper time-aware train (test) splits: only train, test on the past, only test on the future.
- Use cross-validation (rolling windows) so that one lucky time period does not deceive you.
Note: Do not leak the selection and adjustment of features, and keep them inside each fold.
Evaluating Strategy Robustness Pre-Deployment
Assume your backtest is optimistic. Test the strategy under every possible kind of market condition until it falls apart, or doesn’t, and do so in a manner that you can articulate.
Stress Testing Across Market Regimes
Example:
If they were testing a calm period and a turbulent period, then test at least one calm and one turbulent.
- Include gap risk and sudden volatility jumps.
- Verify risk controls under fast price moves.
- Test trend expansion.
- Test range chop.
- Test volatility spikes.
- Test liquidity stress.
Parameter Sensitivity Analysis
Keep in mind:
- You need a vast buffer zone, not a millimetre-thin ideal.
- Perturb each parameter, and repeat the test.
- Choose settings that have a wide range and are stable.
- Go into curve fitting and treat one number collapse.
Quick sensitivity table template:
| Parameter | Test range | Healthy outcome | Overfit outcome |
|---|---|---|---|
| Entry threshold | ± 10% | Performance changes mildly | Profit turns into a loss |
| Lookback window | Nearby values | Similar trade behaviour | Completely different behaviour |
| Stop or take profit | Small shifts | Risk profile stays bounded | Drawdown jumps sharply |
Detecting Instability in Optimised Models
Optimised models often show cracks under testing conditions that are not their comfort zone. When the equity curve is on the side. He can:
- Look at the range of wave allowances that work only out of a given, defined cycle.
- and look to shift the data window.
A major red flag is when the equity curve improves only within the optimisation window but degrades elsewhere.
If your model delivers inconsistent out-of-sample results across different time slices or shifts its decisions dramatically with the addition of only minimal new data, you’re likely looking at an unstable system.
Monitoring Overfitting in Live Trading
The ultimate inspection is live trading itself. This tells whether your historical performance was real or only an illusion.
One of the key goals when launching live is to pick up initial indications that a model’s edge has vanished-or that the market has moved into an area different from those it was trained on.
Performance Degradation Signals
- Returns consistently fall below the backtested range for the same level of risk.
- Drawdown threshold expectations are exceeded.
- Metrics like win rate, profit factor, or average trade shrink after allowing for slippage and transaction costs.
- A noticeable change in trade frequency without a structural explanation is another note of caution.
Most importantly, when your strategy begins to sustain losing periods longer than anything ever observed during testing, it may be time to pause trading and re-evaluate the system.
Why Model Drift and Regime Changes Matter?
Model drift is a term used to describe a slow, steady deterioration in the performance of any system. Meanwhile, regime changes are abrupt shifts within market structure. Both can put a model which was previously performing well over a long period.
Key considerations:
1. When metrics move slowly away from their original trade values, smaller trade volume is key to limiting exposure.
2. Suspend trading and run back-tests on different regime data to see if the strategy still works after a big change in structure.
3. Always compare the performance of your model to the strategies of your peers and benchmarks.
4. Check to see if it’s just your strategy which is losing money or whether you’ve made mistakes in how the strategy works completely.
Adaptive Recalibration Techniques
When a model is recalibrated with new market data, it should be done very cautiously. Otherwise, it is simply a case of noise chasing – one should not seek to return to the original position.
A good method to use here is to retrain a model on a rolling window of data, using conservative regularisation in order to avoid overfitting. Some systems also benefit from making use, when needed, of earth-and tire configurations for low-volatility and high-volatility modes.
This is why updates must only be made when live metrics show a clear departure, rather than small losses or day-to-day oscillations.
Needless fine-tuning for temporary perturbations erodes overall reliability.
Is overfitting always bad?
If a model gets too hung up on the noise, it starts to be harmful. But in dynamic markets, being too rigid can sometimes result in equal danger.
A model that never adapts properly may remain technically stable while sinking into irrelevance.
Real difficulty is controlled adaptation: modifying just enough so that one remains pertinent without losing reliability.
Controlled Overfitting in Adaptive Systems
For certain applications, strategic overfitting is not only permissible but necessary.
Some trading systems need to be more responsive to recent data. It is important, for example, that these strategies are able to act on trends within their timeframes or else they run the risk of being snuffed out like sparks in the wind.
Where this is the case, frequent recalibrations are essential:
- Such models include those based on micro-structural dynamics and correlation-related models, as well as volatility targeting systems.
- As for the second law, repeated refinement on a proud part of the sample data or minor changes from optimal values are usually signs of failure.
Balancing Adaptability & Generalization
To maintain the balance between being able to adjust to new circumstances while also staying stable in your underlying logic or groundwork for all trading decisions, do not let too many points be moved about at once, but change them only when a clear new state has emerged.
Before approving any such change, check it out on completely fresh out-of-sample data, so you actually know whether anything has broken.
Acceptable Thresholds of Model Fit
One must have objective standards for stating when a model is “fit enough” without being over-tuned. Basically, there are three rules.
- The first is that any new trading idea should retain a substantial part of the Sharpe ratio or return which it had in its sample period.
- The second demands enough robustness to insulate the website parameters from slight language translation changes, from destroying performance altogether.
- Thirdly, one insists on getting net results which stay positive even after one has made realistic allowances for costs.
And finally, the number of “free” parameters should be small relative to the number of trades and the amount of data you have.
Conclusion
Is it a machine to fit something for you? An overfitted walk-forward backtest is not only a technical flaw but one of the quickest ways to take a promising backtest back into poverty once brought to life.
In “volatile” markets such as forex and crypto, where the spread changes size from moment to moment, and market liquidity is always in a state of flux, the dangers of over-fitting are even greater.
Every backtest is a hypothesis, not a conclusion. Test it across different time scales. Test it on different instruments with varying price models, costs, and different volatility regimes.
Always keep some untouched out-of-sample data. Carry out a walk-forward test. Try every single version of that strategy under stress testing for half a year. Then, if the results hold stable at realistic expense levels, you might consider going live with a very small quantity and only until drift is seen to set in.
Q: What to do next?
A: The simpler the strategy, the better. Verify with out-of-sample and walk-forward testing, adding realistic costs. Start with a modest size. Observe whether it drifts. Only increase when the strategy proves itself in real market conditions.
FAQ
Q: How can you tell if a model is overfitting or underfitting?
A: Begin by comparing in-sample and out-of-sample results. Then make minor changes to key parameters and introduce transaction costs. If there is a big collapse in performance with these small changes, it is probably overfitting. If the model performs dismally in both sets, then you may be underfitting.
Q: How much performance decay is acceptable out-of-sample?
A: Some decay is normal. It is the overall shape that counts, not intricate detail. If profit comes down but stays positive and drawdowns are within limits, then it is likely your model is robust. Conversely, if everything falls apart or turns inside out, it’s a signal that things are in the soup.
Q: What is the simplest guardrail against data snooping?
A: Define your evaluation rules before conducting tests. Log each version of strategy you try out. Reserve your final holdout window and test just once. If anything is modified after looking at that window, it’s not a valid test anymore.
Q: Does walk-forward testing guarantee robustness?
A: No. It reduces the possibility of overfitting but doesn’t erase this risk. Walk-forward testing can still be cheated by data leakage, unreal execution assumptions, and over-tuning. Use it wisely, based on practical cost assumptions and minimal parameter search.
Disclaimer
This content is for educational purposes only. It is not investment advice, trading signals or anything of a performance guarantee. Trading, particularly with leverage, entails the risk of substantial loss to your capital. Before investing money, always do a good job of researching.