


Most retail traders focus only on price. Institutions focus on where price spends time. This is the foundation of value-area trading, a method based on market structure and statistical distributions.
This guide explains the value area step by step. You will learn about the 80% rule, fair value price, and Time Price Opportunity (TPO) charts. Whether you are a beginner or an expert, these practical guidelines will help you improve your entries and exits.

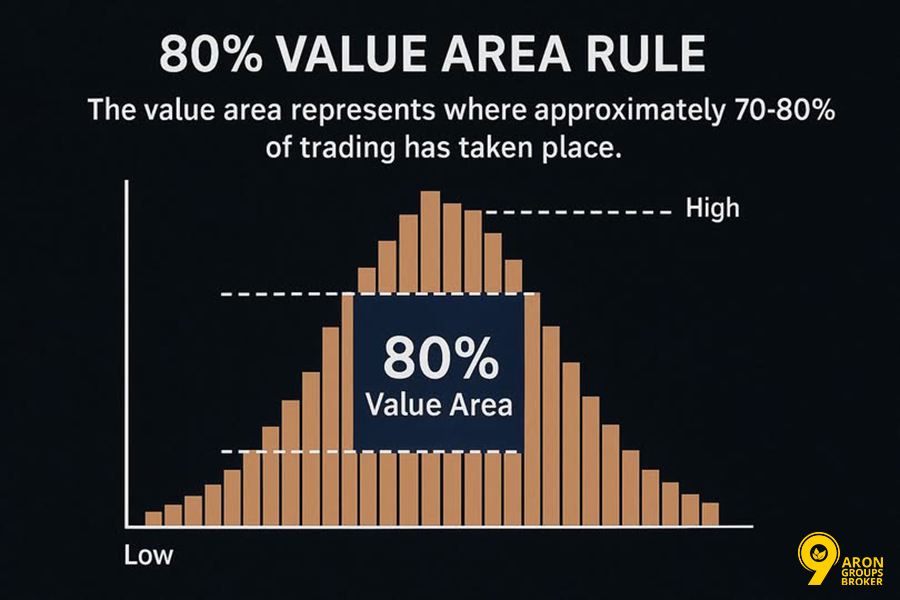
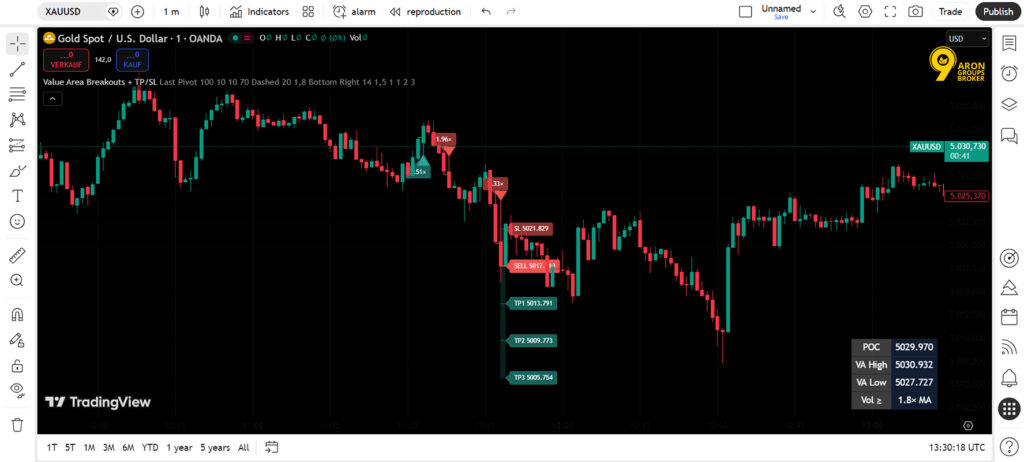
- The Value Area identifies the fair price where 70%-80% of trading occurs, showing you where buyers and sellers are in total agreement.
- By tracking the Value Area, you are following the high-volume zones created by banks and hedge funds rather than chasing retail noise.
- The boundaries of the Value Area (VAH and VAL) act as natural barriers where price is likely to either bounce or break out.
- The Point of Control (POC) represents the most liquid price level, often acting as a magnet that pulls the market back to its centre.
Discovering the Value Area Concept
To trade like an institution, you must stop looking at price as a single number and start seeing it as a range of agreement. The Value Area concept identifies exactly where the big money decided to do business.
By finding these zones, you can stop chasing random price spikes and start trading where the market is most active.
What Makes a Value Area in Trading?
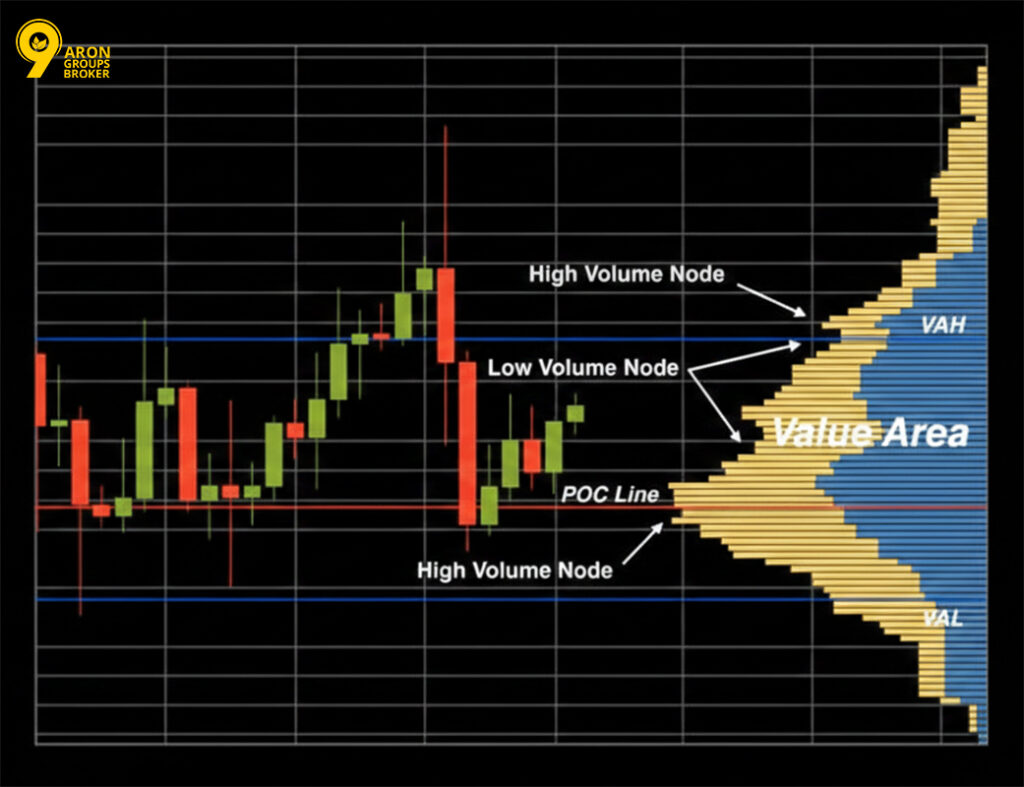
The Value Area (VA) is the price range where 70% of the previous session’s volume took place. It represents the “comfort zone” where buyers and sellers reached a broad agreement.
There are three key levels to watch:
| Level | Definition |
|---|---|
| Value Area High (VAH) | The upper boundary of the 70% volume zone. |
| Value Area Low (VAL) | The lower boundary of the 70% volume zone. |
| Point of Control (POC) | The single price level with the highest traded volume. |
- Inside the VA: The market is in balance or sideways.
- Outside the VA: The market is searching for a new fair price.
Fair Value Price and Why It Matters
The fair value price is the level at which the market traded most, usually the Point of Control (POC). It is the most efficient “meeting point” between buyers and sellers.
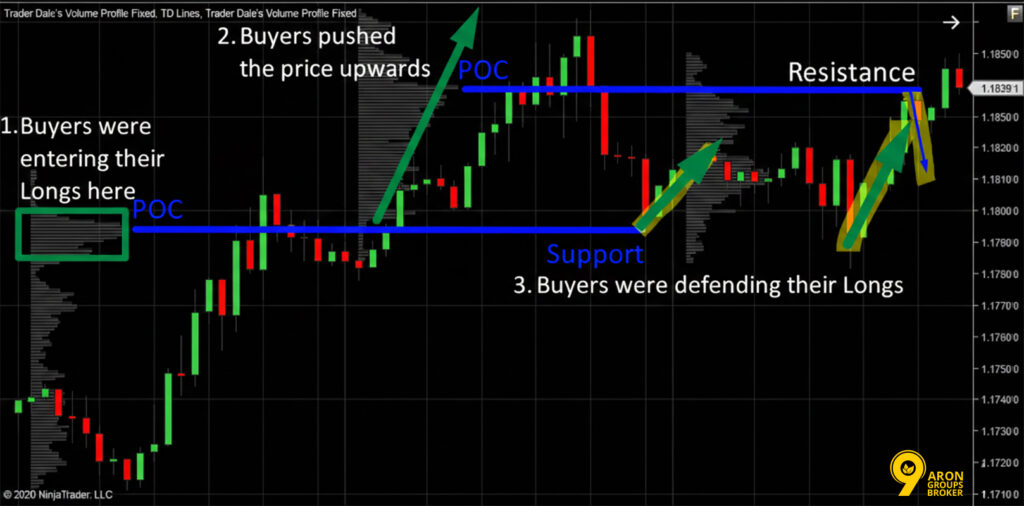
Institutional traders use this for mean reversion. Because price frequently gravitates back to the POC after moving away, it acts like a magnet. Understanding where fair value sits helps you anticipate where the price is likely to return.

Key Point:
Fair value is not a prediction of the future. It is a reference level showing where the most recent trading activity was concentrated.
Understanding Standard Deviation & the Bell Curve
Value area analysis is rooted in standard deviation, a statistical measure of how far prices spread from the average. When plotted over time, price distribution tends to follow a bell curve shape.
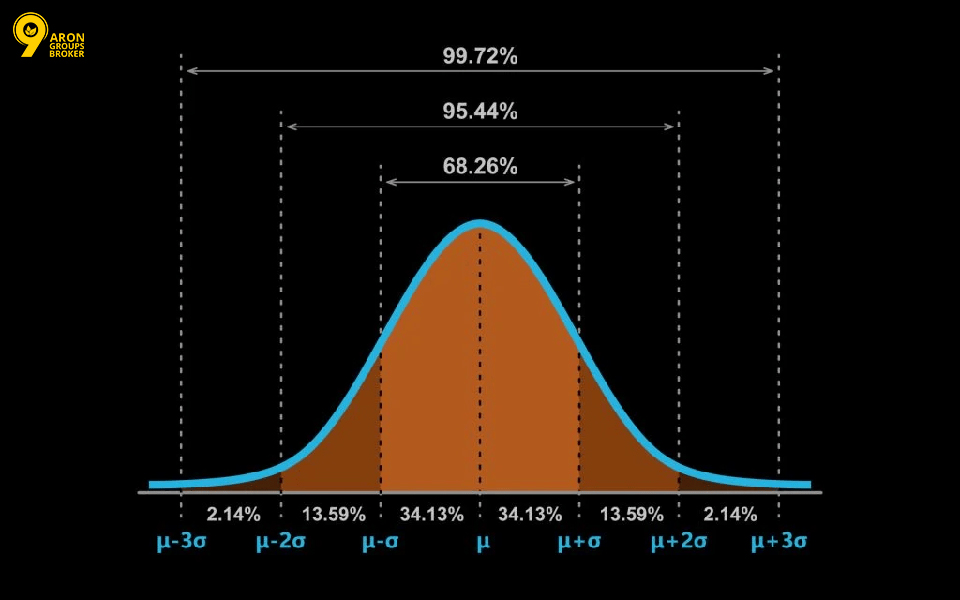
In a typical session, around 68% of prices cluster near the mean (fair value). The value area extends to capture approximately 70% of volume, which corresponds closely to one standard deviation from the POC.
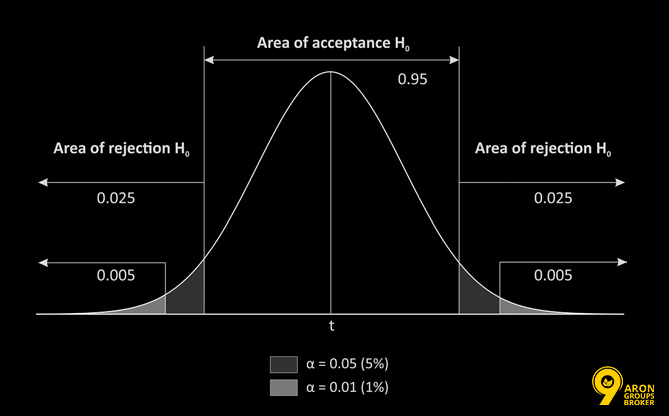
Prices at the extreme edges of the curve, far above VAH or far below VAL, represent statistical outliers. These extremes often attract mean reversion activity, as the market tends to pull the price back towards the centre of value.
Core Principles of Value Area Trading
This section explores the “why” behind market movements. Understanding these principles allows you to start following the footprints of the world’s largest financial players.
How Institutional Liquidity Shapes Price Moves
Institutional liquidity refers to massive buy or sell orders from banks, hedge funds, and professional desks. Institutions cannot fill massive orders at once. They build positions across a specific price range, which actively creates the Value Area.
- Above VAH: Large institutions may see the price as expensive and begin selling.
- Below VAL: They may see the price as cheap and begin buying.
By recognizing these zones, retail traders can align themselves with the dominant order flow rather than fighting against it.
Important:
You can’t always see institutional orders directly. Instead, use the Value Area and POC as signals of where big-money interest is hiding.
Acceptance vs Rejection Around the Value Area
To time your entries correctly, you must distinguish between two market reactions:
- Acceptance: Price enters a new zone and stays there (closing multiple candles). This shows traders are comfortable with the new price.
- Trade Signal: Acceptance above VAH suggests a bullish trend continuation.
- Rejection: Price enters a zone but quickly reverses, often leaving a long wick on a candle.
- Trade Signal: A rejection at the VAH suggests the price will likely return (mean-revert) toward the POC or VAL.
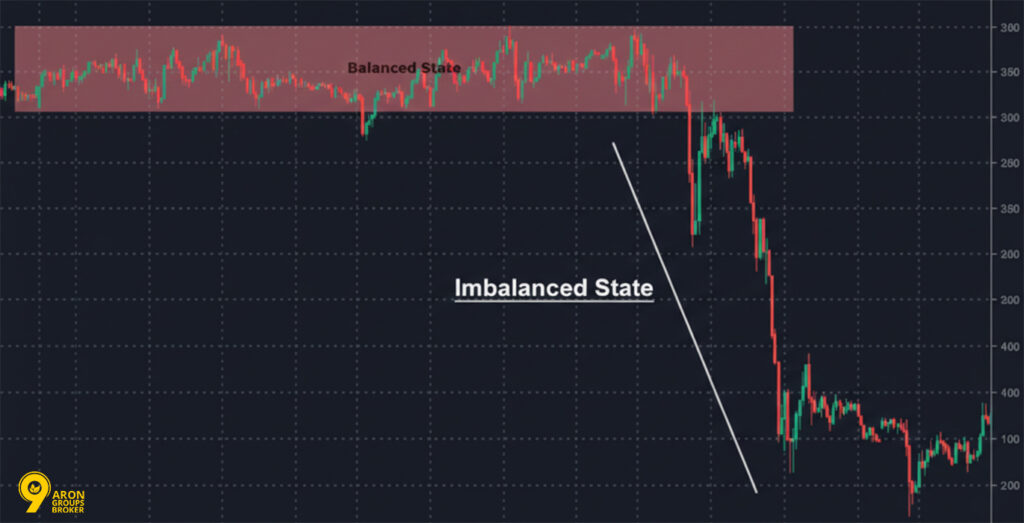
Spotting Balanced and Unbalanced Markets
A balanced market is one where the price oscillates within a defined value area over multiple sessions. Buyers and sellers are in equilibrium, with no clear directional trend. In this environment, the 80% rule and mean reversion strategies perform well.
An unbalanced market is characterised by price consistently trading outside the previous session’s value area. This signals directional conviction often driven by news, earnings releases, or macroeconomic shifts. In unbalanced conditions, mean reversion trades carry greater risk, and trend-following approaches may be more appropriate.
| Market State | Characteristic | Preferred Approach |
|---|---|---|
| Balanced | Price stays within the prior Value Area | Mean reversion, 80% Rule |
| Unbalanced | Price breaks out of prior Value Area | Trend continuation, reduced size |
Applying the 80% Value Area Rule
This rule is a statistical edge used by professional traders. It describes a specific behaviour: once the market moves back into its “comfort zone,” it tends to stay there until it reaches the other side.
Setting the 80% Threshold in Your Trades
The 80% Value Area Rule states: If the price opens outside the Value Area but then moves back inside, there is an 80% probability that it will travel all the way to the opposite side.
- The Bullish Setup: Price opens below the VAL, then pushes back up into the Value Area. The target is the VAH.
- The Bearish Setup: Price opens above the VAH, then drops back down into the Value Area. The target is the VAL.
Key Point:
While 80% is a high historical probability, it is not a 100% guarantee. You must always use a stop-loss.
Step-by-Step Guide to Fair Value Area Strategy
Use this structured process to trade the Value Area effectively:
- Mark Your Levels: Before the market opens, identify the previous session’s VAH, VAL, and POC.
- Watch the Open: Check if the price opens inside or outside the prior Value Area.
- Identify the Trigger: If the price opens outside and then re-enters the VA, get ready to trade.
- Confirm Acceptance: Wait for at least two consecutive candle closes inside the VA to ensure it isn’t a “fake-out.”
- Set Your Target: Aim for the opposite boundary (if you entered at the VAL, aim for the VAH).
- Place Your Stop-Loss: Put your stop just outside the VA boundary where you entered.
- Manage the Trade: Take partial profits at the POC, then let the rest of the position run to the final target.
Common Pitfalls Traders Make with the 80% Rule
Even with a high-probability rule, many traders fail due to these two mistakes:
- Entering Too Early: A single candle touching the Value Area is not enough. You need acceptance (multiple closes) to prove the price isn’t just visiting before reversing.
- Ignoring Market Context: The 80% rule works best in balanced markets. If the market is in a strong trend (unbalanced) due to major news, the price is more likely to ignore the Value Area entirely.
Warning:
Never trade without a defined stop-loss. 20% of the time, the rule fails, and the price can move very fast against you.
Advanced Techniques to Read the Value Area
Beyond the basics, professional traders use specialised charts and timing tools to gain a clearer view of market intent.
Getting the Most from Time Price Opportunity (TPO) Charts
A Time Price Opportunity (TPO) chart, often called a Market Profile, shows how much time the market spent at each price level. Typically, each 30-minute block is represented by a letter. This creates a visual “bell curve” that highlights the market’s structure.
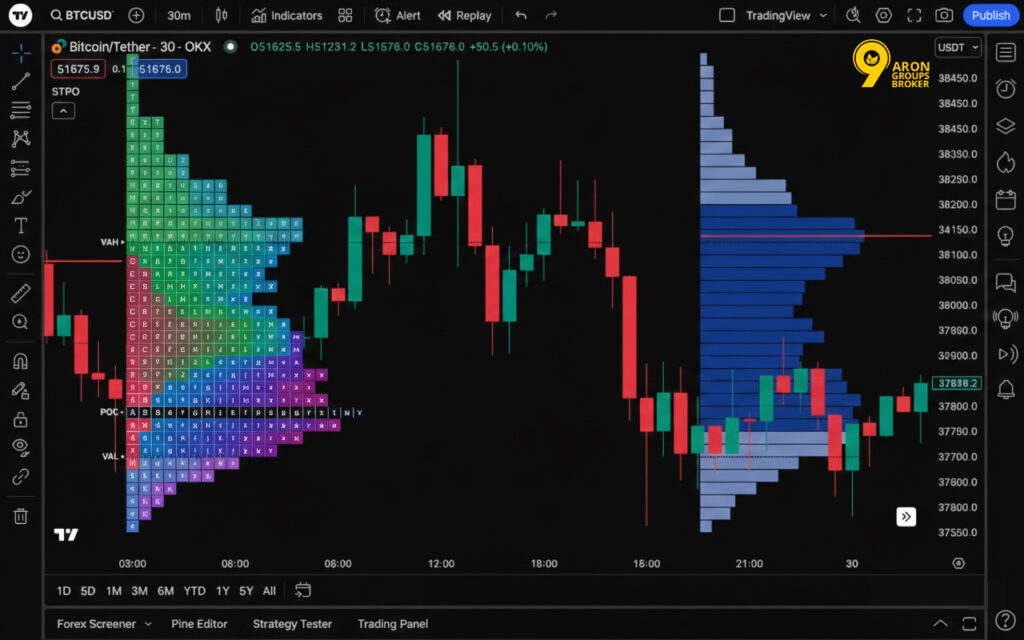
TPO charts reveal details hidden in standard candlestick charts:
- Single-Prints: Price levels visited only once, showing weak acceptance.
- Poor Highs/Lows: Rounded edges that suggest the price will return to “test” that area again.
- Excess: A sharp, thin tail at the top or bottom, signalling a strong rejection by institutions.
| TPO Pattern | Visual Appearance | What It Means | Trader Action |
|---|---|---|---|
| Single-Prints | A price level with only one letter block. | Weak acceptance. Price moved through too quickly. | Expect the price to eventually return and "fill" this area. |
| Poor Highs/Lows | Flat, rounded top or bottom with multiple letters. | Unfinished auction. Buyers/Sellers lacked the final push. | Anticipate a breakout to test beyond this flat level. |
| Excess (Tail) | A long, single column of letters at an extreme. | Aggressive institutional rejection. | Look for mean-reversion entries in the opposite direction. |
Initial Balance and Its Impact on Market Direction
The Initial Balance (IB) is the price range created during the first hour of the trading session. It acts as the “foundation” for the day.
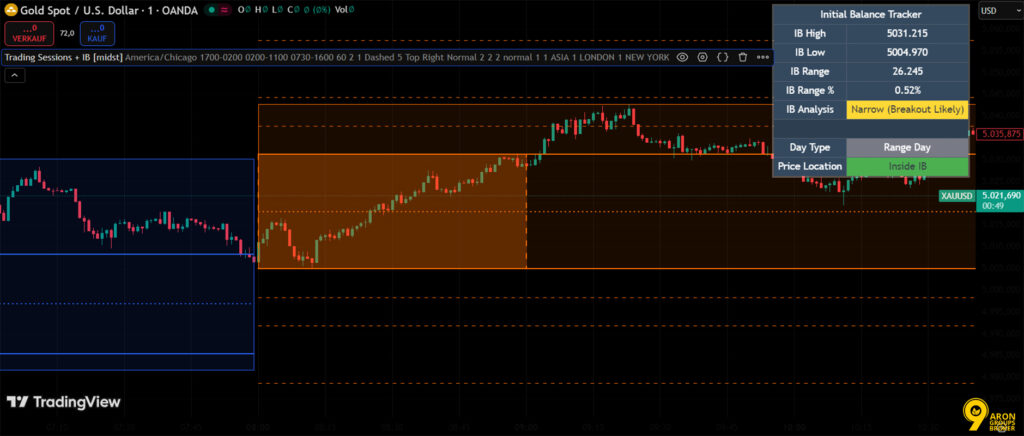
- Narrow IB: Suggests the market is searching for direction and may break out significantly.
- Wide IB: Suggests early volatility; the price is more likely to stay within that range for the rest of the day.
If the price breaks above or below the IB later in the session, it often signals a strong trend. Using the IB alongside the previous day’s Value Area gives you a powerful “map” of where the market might go.
Key Point:
The Initial Balance is most effective in liquid markets with clear opening times, like stock indices and major Forex pairs.
Using Mean Reversion Within the Value Area
Mean reversion is based on the “rubber band” effect: when price stretches too far from the Point of Control (POC), it tends to snap back. In a balanced market, the POC represents the highest agreement on value.
When the price reaches the Value Area High (VAH) or Value Area Low (VAL), it is testing the boundaries of that agreement. If the market rejects these levels, meaning it cannot sustain closes outside the zone, it signals that the extension was a temporary outlier.
Traders then fade the move, entering a trade back toward the center. This strategy relies on the market’s natural gravity to pull prices back to their most efficient, high-volume levels.
Combining Value Area Analysis with Stock Picks
Using the Value Area isn’t just for day trading; it is a powerful tool for stock selection. By combining technical volume levels with fundamental data, you can find high-probability value plays.
Identifying Stocks Trading Below Book Value
Book value is the net worth of a company (total assets minus liabilities) divided by its total shares.
If a stock trades below book value, the market price is lower than what the company’s assets are worth on paper.
- The Technical Link: When a stock is fundamentally cheap (below book value) and also trading below its long-term Point of Control, it provides a double signal that the price is undervalued.
- The Catch: A low price doesn’t always mean a bargain. The market might be pricing in high debt or falling earnings.
Q: Is a stock below book value always a buy?
A: No. You must also review cash flow and debt. Sometimes a stock is cheap because the company is in serious trouble.
Fair Value Adjustments for Trading Securities Explained
Public companies often hold stocks or bonds as trading securities to generate short-term profits. Under accounting rules like IFRS or GAAP, the reported value of these assets must be updated continuously to reflect current market prices.
This requirement creates a significant impact on financial reporting because any change in the market value of these holdings is recorded as an immediate gain or loss on the company’s income statement.
From a trader’s perspective:
These adjustments can make a company’s reported earnings appear much more volatile than they actually are. When analysing a stock’s potential, it is essential to separate fair-value fluctuations from actual operating income.
Doing so allows you to see past market noise and determine if the company’s core business operations are truly healthy and stable.
Important:
These adjustments affect Net Income, which, in turn, directly impacts Earnings Per Share (EPS) and valuation ratios such as the P/E ratio.
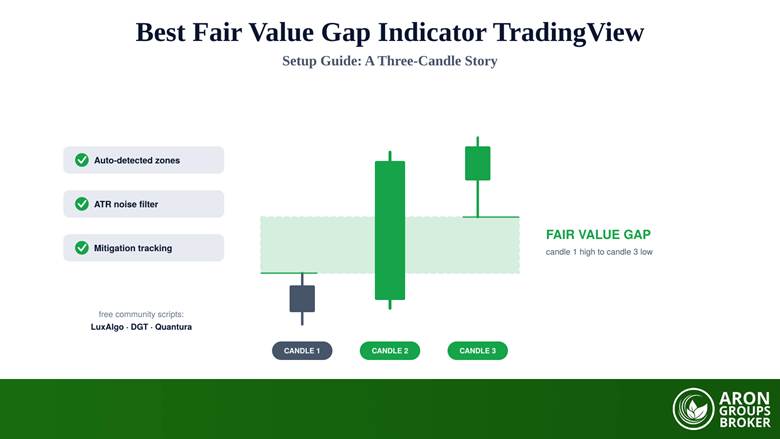
Recognising Fair Value Gaps and How They Affect Trades
A Fair Value Gap (FVG), or imbalance, happens when the price moves so fast that it leaves a hole in the price action. It is identified by looking at three consecutive candles: if the wicks of the first and third candles do not overlap, a gap is left in the middle.
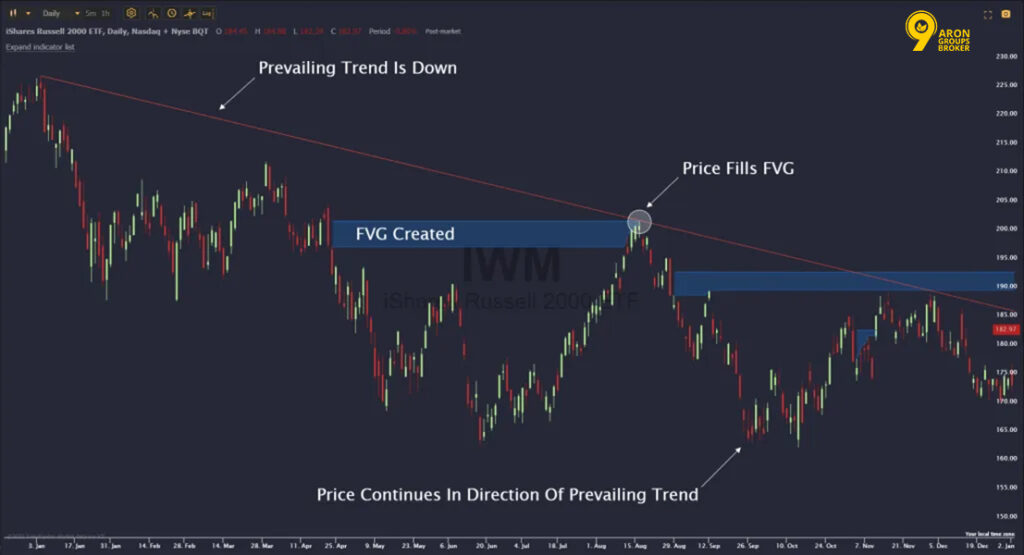
- The Magnet Effect: The market hates inefficiency. Price often returns to “fill” these gaps before continuing its trend.
- The Confluence: If an FVG aligns with a VAH or VAL, it creates a very strong signal for a trade entry.
Q: How is an FVG different from a standard price gap?
A: A standard gap is a physical jump in price between two days (common in stocks). An FVG happens within the flow of candles, where the price moves too quickly to trade every level efficiently.
Rules for Consistent Value Area Trading
Consistency in trading comes from having a repeatable plan. These rules help you move away from emotional decisions and toward a disciplined, professional approach.
Entry and Exit Guidelines that Work
Disciplined entries are essential for long-term success. Never enter a trade simply because the price has touched a specific level. Instead, wait for confirmation:
- For the 80% Rule: Require at least two consecutive candle closes inside the Value Area.
- For Mean Reversion: Look for a clear rejection wick and a strong reversal candle at the VAH or VAL.
For exits, follow a structured target plan. The POC is the natural first target for any mean reversion trade. The opposite boundary is your second target. A smart tactic is to close 50% of your position at the first target to secure profit, then trail your stop-loss for the remainder.
Smart Risk Management for Institutional-Style Trades
Your position size should be based on the distance between your entry and your stop-loss, not a random number. A professional standard is to risk only 1-2% of your total capital on any single trade. This ensures that a single loss won’t ruin your account and allows your statistical edge to work over time.
Remember that leverage is a double-edged sword; it amplifies both gains and losses. Use it cautiously, especially when the market is unbalanced or major news is coming.
Warning:
Avoid revenge trading (increasing your size after a loss). Value Area setups require patience and consistency, not larger bets to "make back" money.
Adjusting Your Strategy in Volatile or Unbalanced Markets
When a market is unbalanced, meaning price is moving strongly outside the previous session’s range, you should reduce your mean reversion trades. Trading against a strong trend means you are fighting the dominant institutional order flow.
In volatile conditions, you have two choices:
- Widen your stop-loss slightly to avoid being stopped out by random noise.
- Reduce your position size so your total dollar risk stays the same.
During major economic announcements, the safest move is often to observe from the sidelines until the market finds its new fair value.
Practise and Improve Your Value Area Skills
Mastering value area trading requires moving from theory to practical application. Use the following trading strategies to sharpen your skills before risking live capital.
Replay Exercises to Sharpen Your Eye for Value
The fastest way to build confidence is through market replay. Platforms like TradingView and Sierra Chart let you watch historical sessions bar by bar.
- Preparation: Mark the previous session’s Value Area (VAH, VAL, and POC) on your chart before starting the replay.
- Observation: Press play and watch how price interacts with these levels in real-time.
- Target: Complete at least 20 replay sessions per instrument to get a feel for the rhythm of the market.
Q: How many sessions should I study before trading live?
A: Review 30-50 prior sessions for your specific instrument. Count how many times the 80% rule triggered and reached the target. This back-testing builds the statistical confidence you need to stay disciplined during live trades.
Tracking Trades with a Simple Scorecard
A scorecard turns individual trades into valuable data. For every trade, record:
- Date & Instrument: When and what you traded.
- Session Type: Was the market balanced or unbalanced?
- Setup: Was it the 80% rule, mean reversion, or a Fair Value Gap?
- Execution: Entry, Stop-Loss, and Target.
- Context: Notes on why you took the trade and the final outcome.
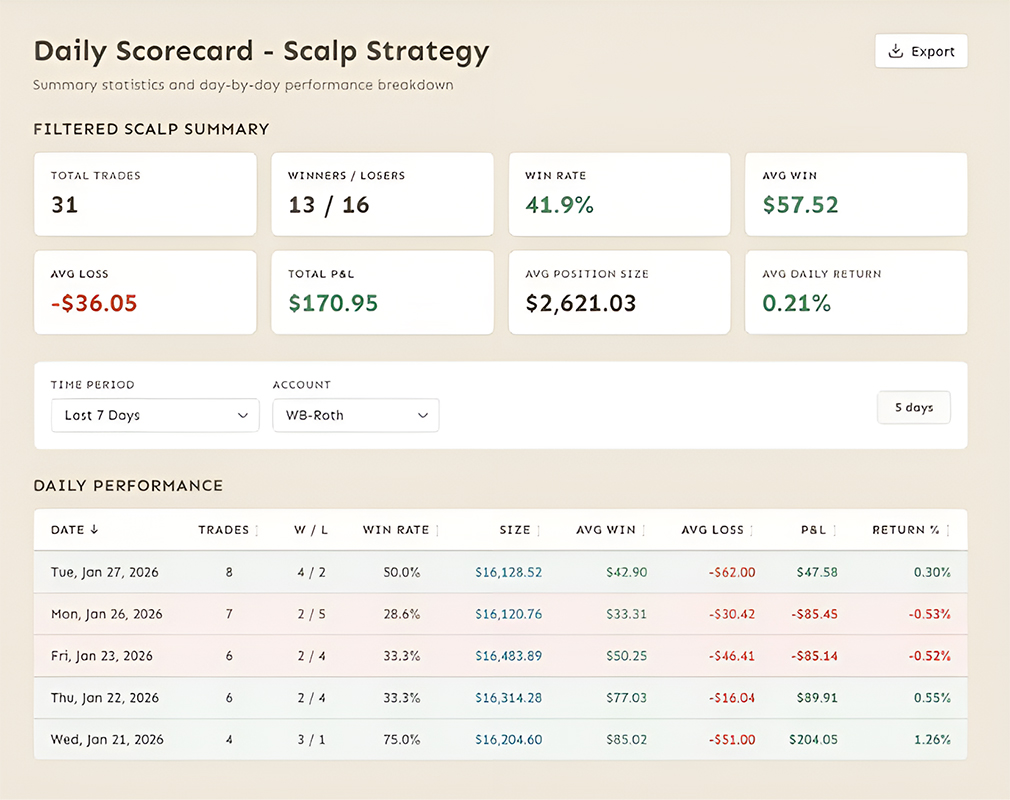
Review this scorecard weekly. Instead of relying on memory, use this evidence to see which setups are actually making you money.
Knowing When to Size Up or Pause
Increase your position size only after achieving a positive expectancy across at least 20 consistent trades.
When to Pause:
If you lose three or more trades in a row using the same setup, stop trading. The market may have shifted from balanced to unbalanced, or your timing might be off.
When to Stay Flat:
Never increase your size during a losing streak (revenge trading) or double your bet just because you are on a winning streak.
Conclusion
Value area trading is a structured, evidence-based way to understand market behaviour. By focusing on where price spends the most time, you can align your strategy with institutional order flow.
Whether you are trading forex, stocks, or commodities, your edge comes from combining the 80% rule, fair-value pricing, and TPO analysis with strict risk management. Start with a replay, build your scorecard, and always keep your stop-loss in place.