In modern trading, “Overbought and Oversold” are two of the most widely used concepts in technical analysis. You see them in stock screeners, crypto dashboards, Forex platforms, and trading bots. But many traders misuse them, treating every overbought or oversold signal as an automatic “sell” or “buy”.
Reality is less romantic.
Overbought and oversold zones are warnings, not guarantees. They highlight areas where price has moved too far, too fast, and where a pause, correction, or reversal becomes more likely but not certain.
- Trading overbought/oversold mechanically without checking the market context is the real danger.
- The same overbought signal can mean “take profit” for investors and “trend still strong” for day traders.
- Highly leveraged 24/7 markets like crypto hit overbought/oversold extremes far more often than stock indices.
- Price action after an overbought/oversold signal, especially on failed reversals, teaches more than the signal itself.
What Do “Overbought” and “Oversold” Actually Mean?
Overbought
Overbought describes a situation where the price of an asset (stock, crypto, Forex pair, etc.) has risen so much and so quickly that further buying is no longer rational for most market participants.
You can think of it as:
Overbought = “Too much buying, too fast”
A common analogy is a rubber band:
- As the price keeps rallying, that “band” is stretched further.
- At some point, it becomes so stretched that either it snaps back (correction) or at least stops stretching (consolidation).
In overbought conditions:
- Buyers are often exhausted.
- Early buyers start taking profits.
- New buyers are less willing to enter at high prices.
- The probability of a pullback or correction increases.
What is overbought in stocks and crypto?
For stocks, an overbought condition often appears after:
- Aggressive rallies driven by earnings surprises, news, or hype;
- Extended multi-day or multi-week uptrends;
- Parabolic moves where the price accelerates at the end.
For crypto, the effect can be even more extreme. Crypto markets trade 24/7, are highly speculative, and can become:
- Overbought after strong narratives (e.g., halving, ETF approvals, memecoin runs);
- Driven by leverage and FOMO, which push indicators deeply into overbought territory.
In both cases, “overbought” does not mean the asset must crash. It simply signals that upside may be limited unless fresh demand appears.
Oversold meaning
Oversold is the mirror image: price has fallen so much and so fast that further selling becomes increasingly irrational.
Oversold = “Too much selling, too fast”
Here, the analogy is a compressed spring:
- The more you compress it, the greater the potential energy.
- At some point, any relief in selling pressure can cause a sharp bounce.
In oversold conditions:
- Sellers are often exhausted.
- Short-sellers may start covering.
- Value or dip buyers become interested.
- The probability of a bounce or trend reversal increases.
What is oversold in stocks and crypto?
In stocks, oversold often follows:
- Panic selling after bad news;
- Downtrends that accelerate into a “capitulation” phase;
- Broader market risk-off events, where everything is sold.
In crypto, oversold can result from:
- Liquidations of overleveraged long positions;
- Regulatory headlines or security breaches;
- Sharp rotations from altcoins into stablecoins or Bitcoin.
Again, oversold does not guarantee a bottom. Some assets stay cheap for a long time.
Learn more
Overbought and oversold are context-dependent; the same reading can mean “trend strength” in one market and “reversal risk” in another, depending on volatility and regime.
How Traders Detect Overbought and Oversold Zones
In technical analysis, overbought and oversold zones are typically identified using oscillator indicators that move within a bounded range and compare current price action to a recent window of data.
Three of the most common are:
- RSI (Relative Strength Index);
- Stochastic Oscillator;
- CCI (Commodity Channel Index).
Quick comparison: RSI vs Stochastic vs CCI
| Feature | RSI (Relative Strength Index) | Stochastic Oscillator | CCI (Commodity Channel Index) |
|---|---|---|---|
| Core calculation | Speed and magnitude of recent price changes | Position of current price within recent high–low range | Deviation of price from a statistical moving average |
| Signal speed | Medium - good for stable trends | Faster – good for choppy or ranging markets | Very fast - sensitive to short-term volatility |
| Best use case | Spotting divergence & swing turning points | Timing entries/exits in sideways markets | Catching strong emerging moves in volatile markets |
| Typical overbought zone | RSI above 70 | Stochastic above 80 | CCI above +100 |
| Typical oversold zone | RSI below 30 | Stochastic below 20 | CCI below −100 |
Learn more
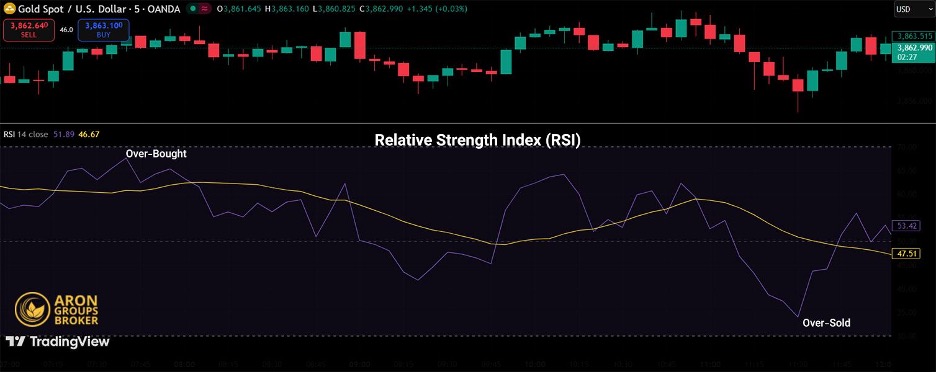
No single oscillator works best in all markets. Many traders pick one primary indicator (e.g. RSI) and use others purely for confirmation, not as extra noise.
RSI Overbought and Oversold Levels
The Relative Strength Index (RSI) is one of the most popular momentum oscillators in trading.
- It oscillates between 0 and 100.
- The default setting is usually 14 periods.
- Common levels: 30, 50, and 70.
Typical interpretation:
- RSI > 70 → asset often considered overbought
- RSI < 30 → asset often considered oversold
- RSI ≈ 50 → neutral momentum
Why traders like RSI
- It reacts well in many instruments: stocks, indices, Forex, and crypto.
- It helps capture momentum shifts rather than just the raw price.
- It’s widely available on almost every trading platform.
However, in strong trends, RSI can:
- Stay above 70 for long stretches in a powerful uptrend.
- Remain below 30 throughout an aggressive downtrend.
That is why experienced traders use RSI with context, not in isolation.
Learn more
Some advanced traders adjust RSI levels (e.g. 80/20 instead of 70/30) for very volatile assets like crypto to reduce false reversal signals.
Stochastic Overbought and Oversold Levels
The Stochastic Oscillator compares the closing price to the recent high and low range over a set period.
- It also oscillates between 0 and 100.
- It has two lines: %K (fast) and %D (signal, a moving average of %K).
- Common thresholds: 20 and 80.
Typical interpretation:
- Stochastic > 80 → potential overbought zone
- Stochastic < 20 → potential oversold zone
- Crossovers (e.g. %K crossing below %D from above 80) are often used as timing signals
Stochastic is particularly popular in ranging markets, where the price oscillates between support and resistance, and mean-reversion strategies can work well.
Learn more
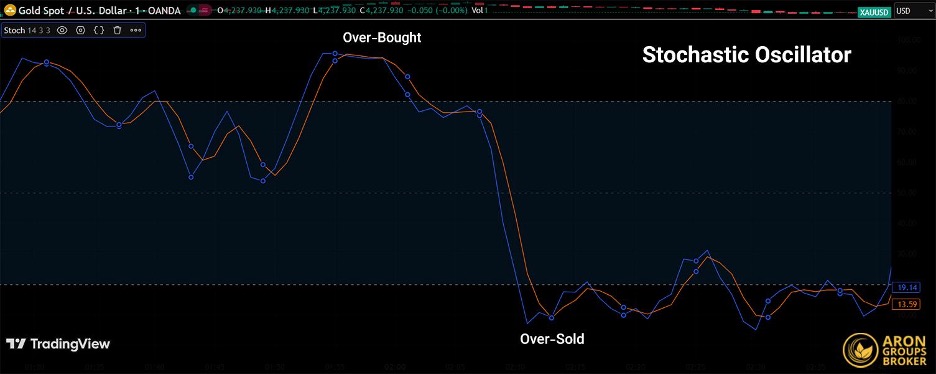
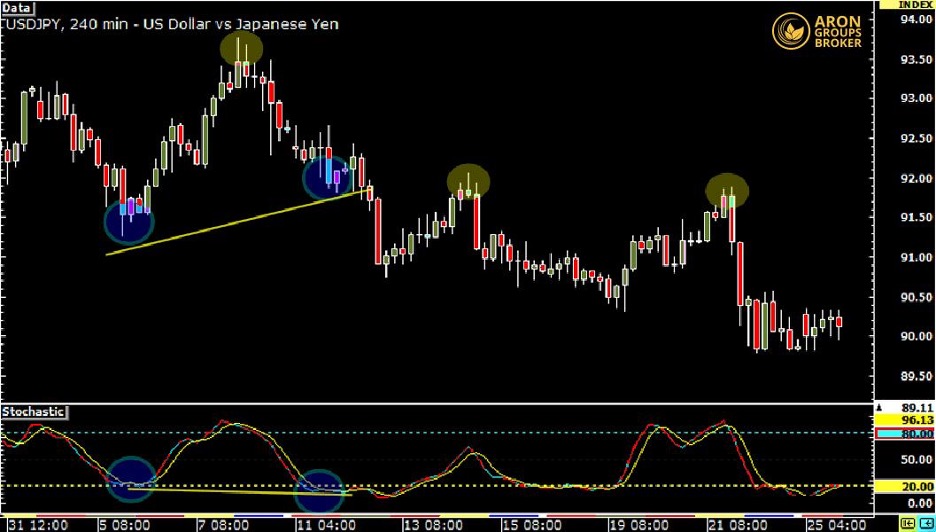
Fast Stochastic is more responsive but noisier. Slow Stochastic smooths the raw values, filtering some whipsaws at the cost of later entries.
CCI and Extreme Price Deviations
The Commodity Channel Index (CCI) measures how far the price has deviated from its statistical average.
- It is unbounded, but most values cluster between −100 and +100.
- Levels beyond this band reflect unusually strong moves.
Typical interpretation:
- CCI > +100 → market may be overbought or in a very strong up-move
- CCI < −100 → market may be oversold or in a very strong down-move
CCI is often used by traders who want to:
- Catch strong breakouts or trend accelerations
- Identify extreme conditions where the price is far away from its mean
Learn more
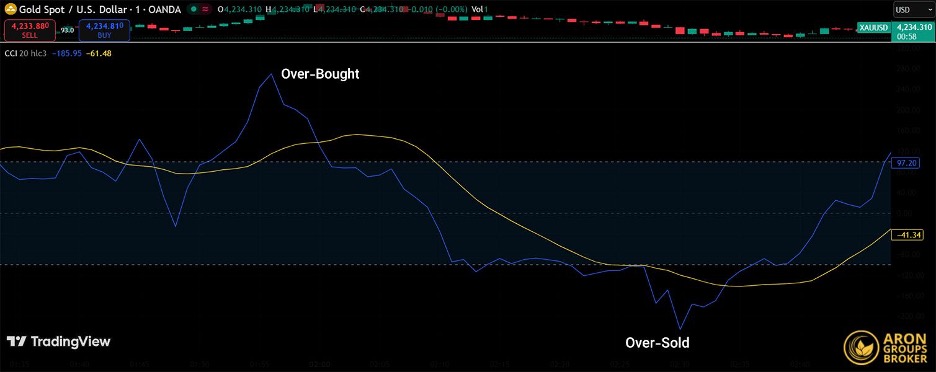
Some traders use CCI in tandem with moving averages: CCI shows the “distance” from the mean, while the moving average highlights the dominant trend direction.
Candlestick Patterns in Overbought and Oversold Areas
Indicators tell you where the price is stretched. Candlestick patterns can help refine entry timing.
Bearish engulfing in an overbought zone
A bearish engulfing pattern forms when:
- A large bearish (red) candle completely covers the body of the previous bullish (green) candle.
- It often appears near the top of an uptrend.
If this pattern appears while:
- RSI is above 70, or
- Stochastic is above 80, or
- CCI is well above +100,
then it can signal that buyers are losing control, and a downward correction may be starting, especially if volume spikes at the same time.
Hammer in an oversold zone
A hammer forms when:
- There is a small real body near the top of the candle.
- A long lower shadow shows that sellers pushed the price down, but buyers forced it back up.
- It usually appears after a downtrend.
If the hammer appears when:
- RSI is below 30, or
- Stochastic is below 20, or
- CCI sits below −100,
It may indicate that new buyers are stepping in and that a rebound is likely, especially if volume expands.
Learn more
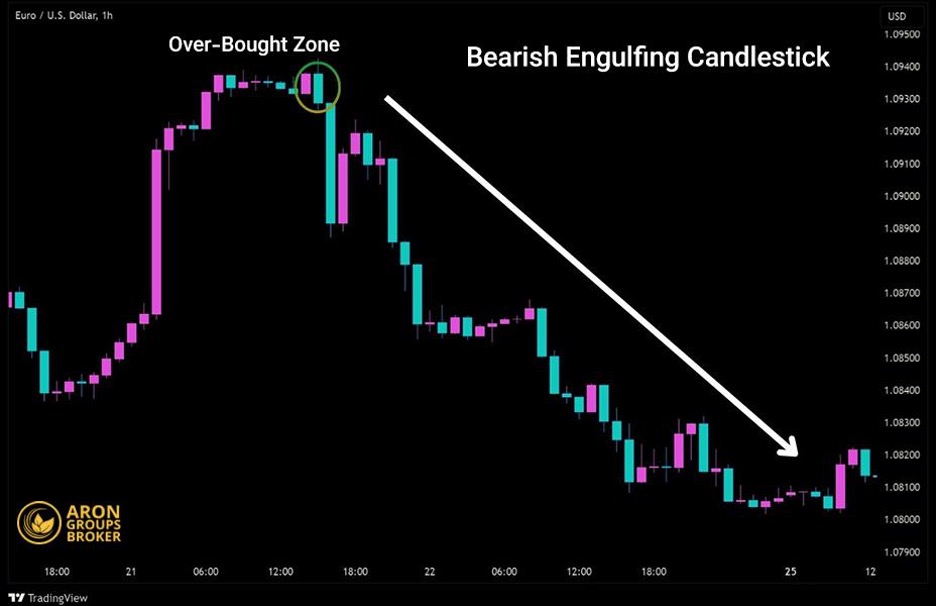
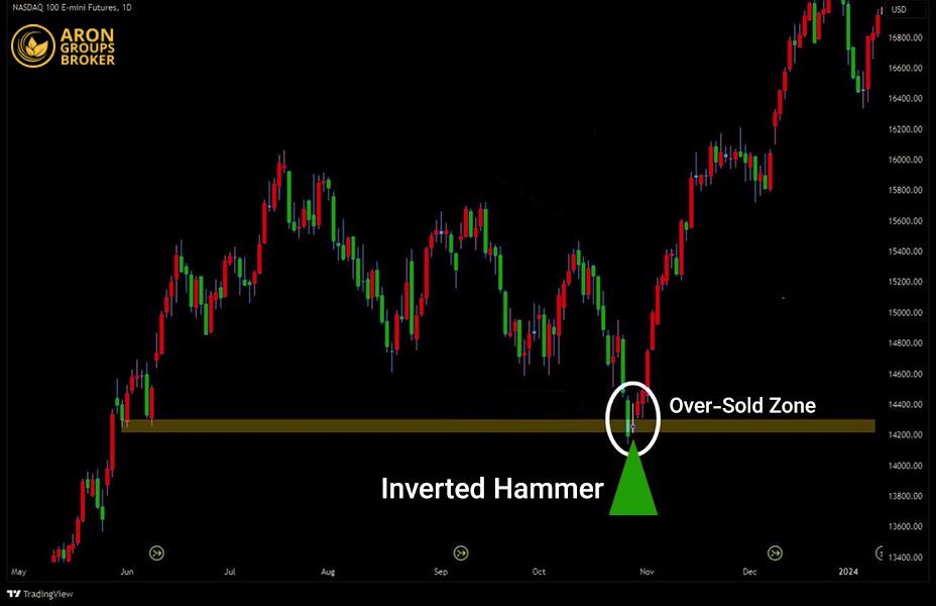
Candlestick patterns gain reliability when they line up with key support/resistance zones and overbought/oversold signals, not when they float in the middle of a noisy chart.
Overbought vs Oversold in Trending vs Ranging Markets
One of the biggest mistakes beginners make is treating overbought and oversold levels the same way in all market conditions.
In trending markets, “overbought” can mean strength
In a strong uptrend:
- RSI can stay above 70 for long periods.
- Stochastic can keep cycling around the upper band.
- Price continues to print higher highs despite overbought readings.
Here, “overbought” is often a sign of powerful momentum, not an automatic sell signal. Selling just because RSI hits 70 can mean:
- Exiting profitable trades too early.
- Missing large parts of sustained trends.
In a strong downtrend, the mirror applies:
- Oversold readings can persist.
- Prices can keep making new lows.
In both cases, smart traders:
- Use overbought/oversold to fine-tune entries in the trend direction, not to fade the trend constantly.
A simple rule of thumb:
In an uptrend, focus on oversold pullbacks for buying. In a downtrend, focus on overbought rallies for selling.
In ranging markets, overbought/oversold often mean “ready to revert”
In sideways or range-bound markets:
- Price bounces between a clear support and resistance zone.
- Momentum is not sustained in one direction.
- Overbought/oversold signals are typically more mean-reverting.
In this context:
- Overbought near resistance → often a good area to look for sell setups.
- Oversold near support → often a good area to look for buy setups.
If you combine:
- A range structure;
- Overbought/oversold readings;
- A reversal candlestick pattern.
You often get high-quality reversal opportunities.
Using Overbought and Oversold with Divergence
A powerful pattern is divergence when the price and the indicator move in opposite directions.
Bearish divergence in overbought territory
- Price makes a higher high.
- RSI or Stochastic makes a lower high.
This suggests that momentum is weakening even as the price pushes higher. If this happens in an overbought zone, it increases the probability of:
- A deeper correction.
- A full trend reversal.
Bullish divergence in oversold territory
- Price makes a lower low.
- RSI or Stochastic makes a higher low.
This signals that sellers are losing conviction. If this appears in an oversold area, it strengthens the case for:
- A relief rally;
- A potential medium-term bottom.
Learn more
Divergence is not a trigger on its own. Many traders wait for confirmation, such as a trendline break, a reversal candle, or a shift on lower timeframes, before entering.
Overbought and Oversold Trading Strategies
According to ig.com, Overbought and oversold zones are most useful as part of a complete trading plan, not as stand-alone “buy” or “sell” buttons.
1. Confluence with support and resistance
- Overbought reading + major resistance + bearish reversal candle → aggressive traders may look for short setups.
- Oversold reading + strong support + bullish reversal candle → potential long setups with defined risk.
2. Trading with the dominant trend
In a bullish trend:
- Use oversold dips to look for buy entries.
- Avoid shorting just because something looks overbought.
In a bearish trend:
- Use overbought rallies to look for sell entries.
- Avoid catching falling knives solely based on oversold readings.
3. Scaling in and out (partial positions)
Instead of going “all in” based on a single signal:
- Close a portion of your position when an asset becomes overbought in your favour.
- Add gradually on oversold pullbacks that align with the main trend.
This approach:
- Reduces emotional pressure;
- Smooths equity-curve swings;
- Allows you to participate in longer trends while still managing risk.
4. Combining with volume and volatility
Volume and volatility add extra context:
- Overbought + falling volume may indicate exhausted buyers.
- Oversold + spiking volume can signal capitulation and a possible reversal point.
- Volatility indicators (e.g. ATR, Bollinger Bands) help you size stops and targets realistically.
Using Overbought and Oversold for Investing, Not Just Day Trading
These concepts are not only for day traders.
Using overbought signals to lock in profits
Longer-term investors can use overbought zones to:
- Trim positions after strong rallies.
- Rebalance portfolios that have become overly concentrated in a single asset or sector.
- Reduce risk ahead of known events (earnings, macro announcements).
The logic is simple: when an asset looks stretched relative to its recent history, it can be a sensible time to take some money off the table, especially if valuations are also rich.
Using oversold signals to accumulate
On the buy side, oversold levels can:
- Highlight potential value opportunities in quality assets.
- Help investors scale in during market panic, rather than chasing at the top.
- Support dollar-cost averaging with a bit more timing sensitivity.
However, this only makes sense if:
- The underlying asset or company has solid fundamentals.
- You are prepared for further short-term volatility.
- You have a clear investment horizon and risk tolerance.
Common Mistakes When Using Overbought and Oversold
- Treating them as guaranteed reversal signals
Markets can stay overbought or oversold longer than you can stay patient. - Ignoring market structure
Not distinguishing between trending and ranging conditions leads to misinterpretation. - Overloading indicators
Adding every oscillator on the planet does not increase accuracy; it increases confusion. - Ignoring risk management
Even high-probability setups can fail. Stops and position sizing are non-negotiable. - Trading every signal
Quality matters more than quantity. Focus on signals that align with your broader strategy and context.
Conclusion
In the end, “overbought and oversold” are not magic reversal buttons but context clues about how stretched the price has become. Used with trend, support and resistance, volume, and tools like RSI or Stochastic, they can help you fine-tune entries, exits, and profit-taking.
The edge doesn’t come from spotting every extreme reading, but from combining them with a clear plan and strict risk management so you know when to step on the gas and when to slow down.