


 EN


Forex
-
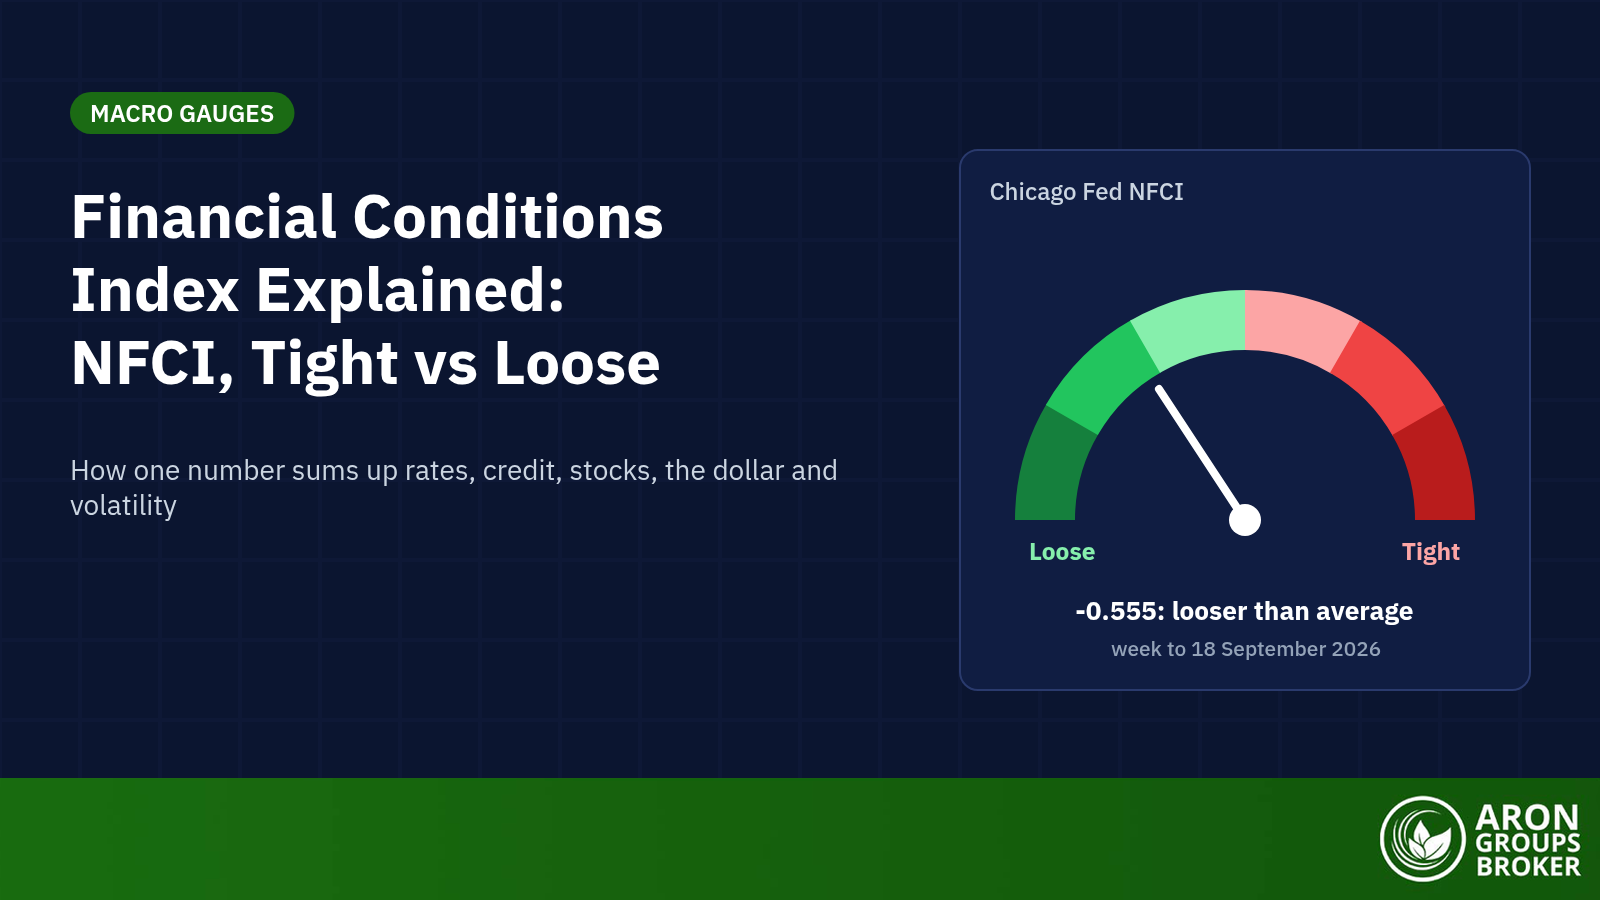
The Financial Conditions Index: How One Gauge Measures Tight or Loose Markets, and Why It Moves Gold and the Dollar
 13 October 2026
,
Abe Cofnas
A financial conditions index (FCI) is a single number that sums up how easy or hard it is to borrow, invest and take risk in an economy. It combines interest rates, credit spreads, stock prices, the exchange rate and volatility into one gauge of the financial weather. When conditions tighten, they act as a headwind […]
- Read more
-
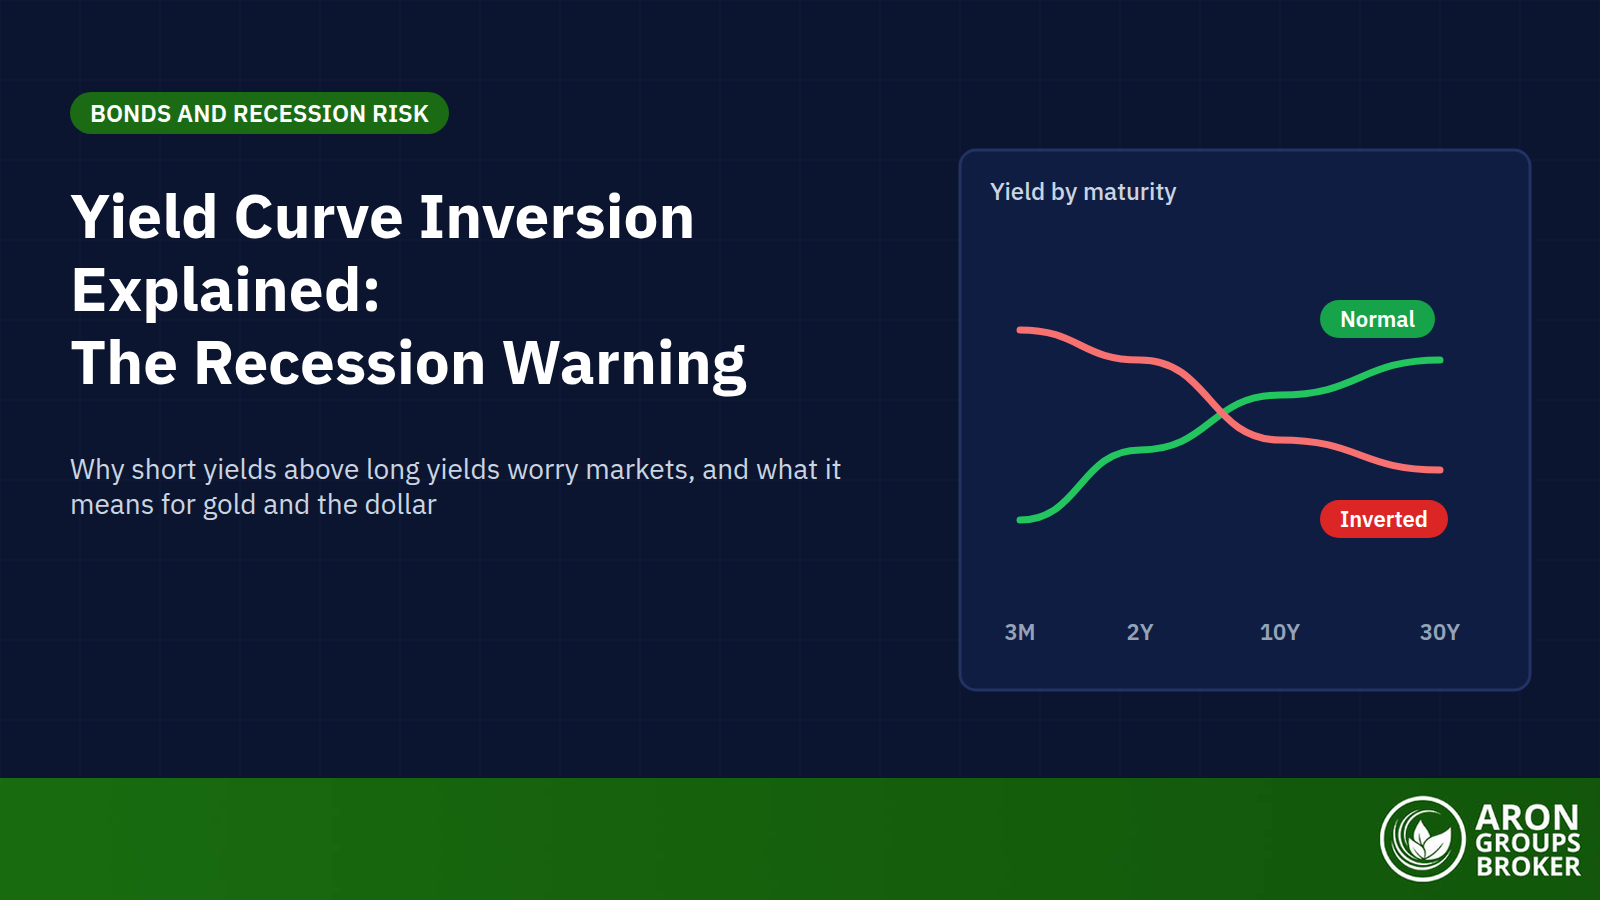
Yield Curve Inversion Explained: Why It Warns of Recession, and What It Means for Markets
13 October 2026
,
Abe Cofnas
A yield curve inversion happens when short-term government bond yields rise above long-term yields, so the yield curve slopes down instead of up. It is the bond market’s most famous recession warning, because an inverted yield curve says investors expect interest rates and growth to fall. In the United States it has preceded almost every […]
- Read more
-
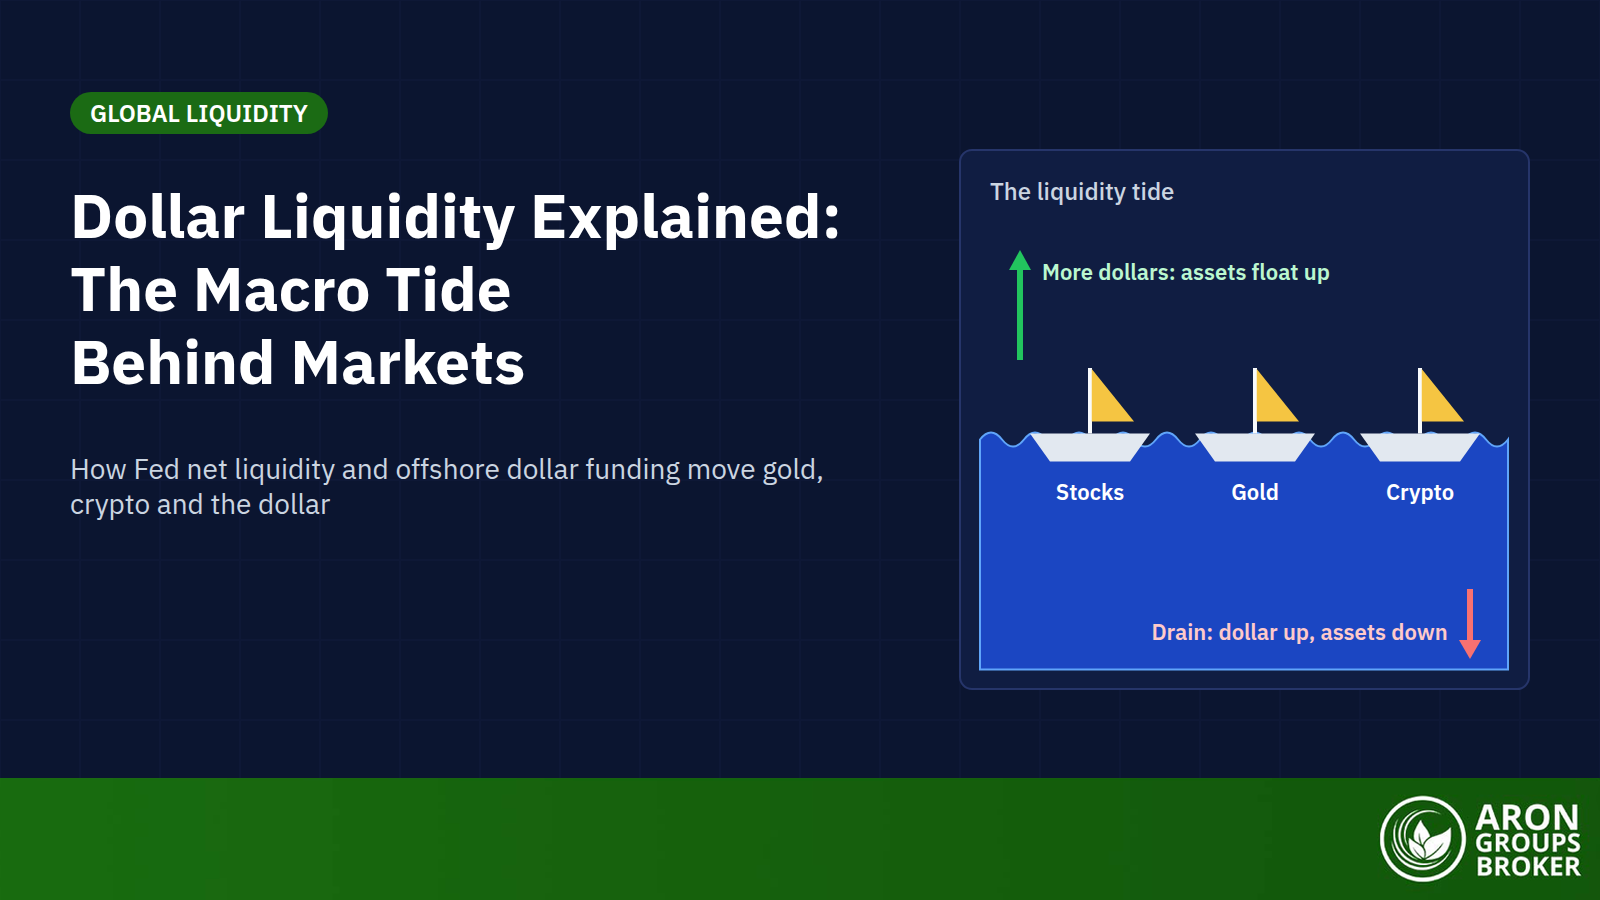
Dollar Liquidity and Global Liquidity: The Macro Tide That Moves Gold, Crypto, and the Dollar
12 October 2026
,
Abe Cofnas
Dollar liquidity is the amount of US-dollar funding available in the financial system. Because the dollar is the world’s reserve and funding currency, it feeds a broader measure called global liquidity: the total flow of money and credit across borders. When dollar liquidity is plentiful, shares, crypto and gold tend to rise. When it drains, […]
- Read more
-
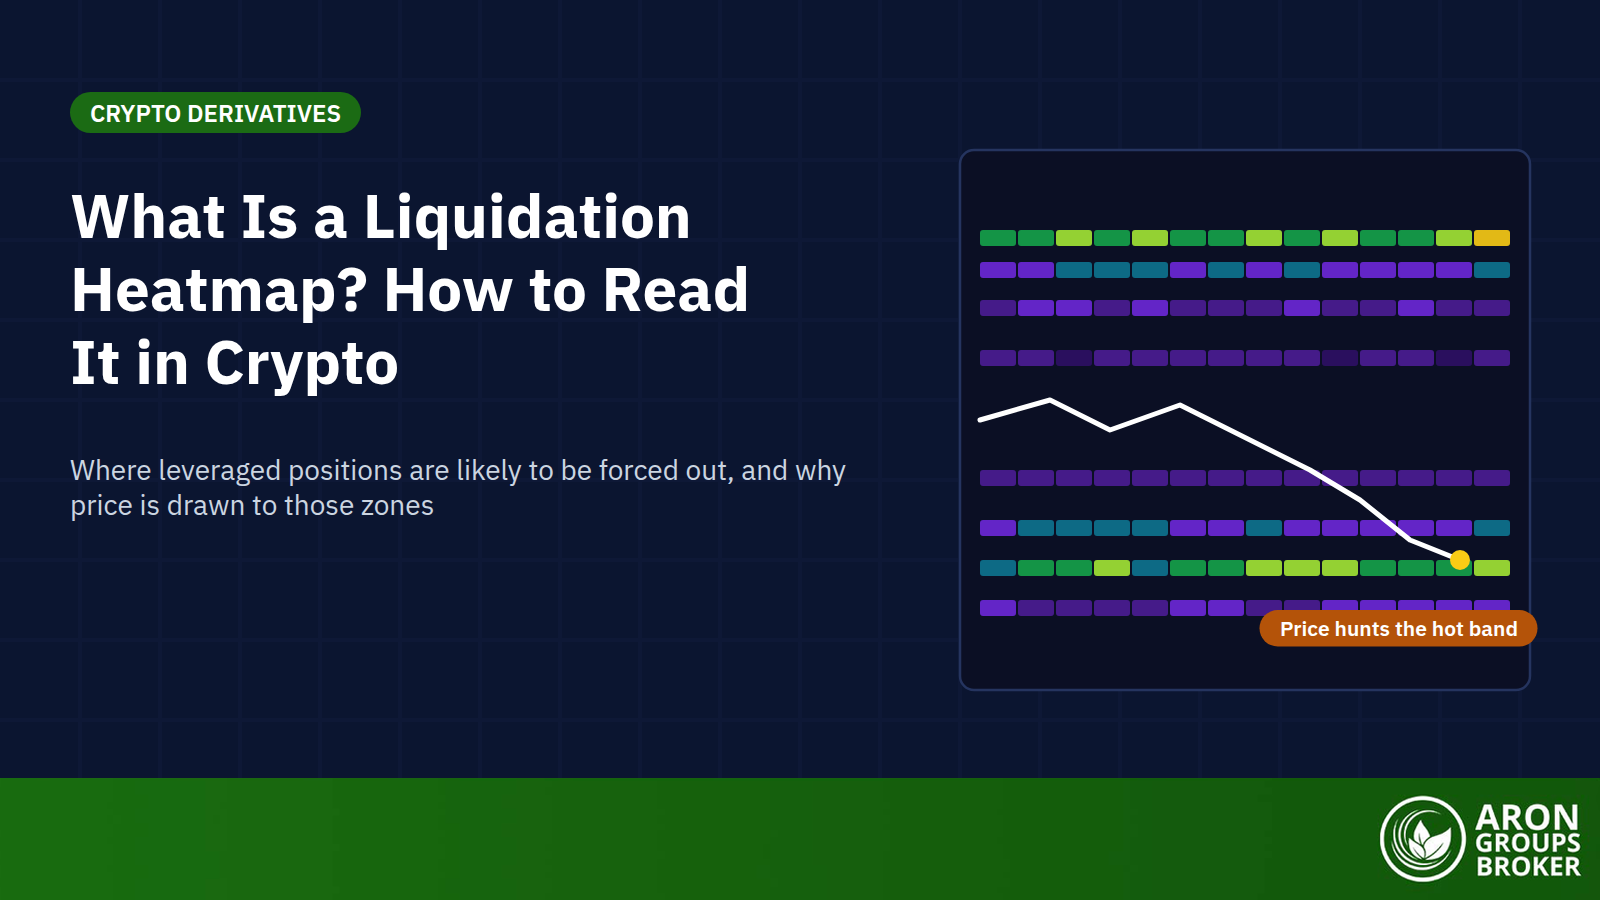
Liquidation Heatmaps: How to Read Where Leveraged Positions Get Liquidated, and Why Price Chases Them
12 October 2026
,
Abe Cofnas
A liquidation heatmap is a chart that estimates the price levels where large clusters of leveraged crypto positions would be forcibly closed. Brighter colours mark bigger estimated clusters, so the map shows at a glance where forced selling or forced buying could concentrate. Traders use it mainly for Bitcoin and Ether futures, where leverage of […]
- Read more
-
Single Stock ETFs: How Leveraged and Inverse One-Stock Funds Work, Volatility Decay, and How They Compare to CFDs
12 October 2026
,
Abe Cofnas
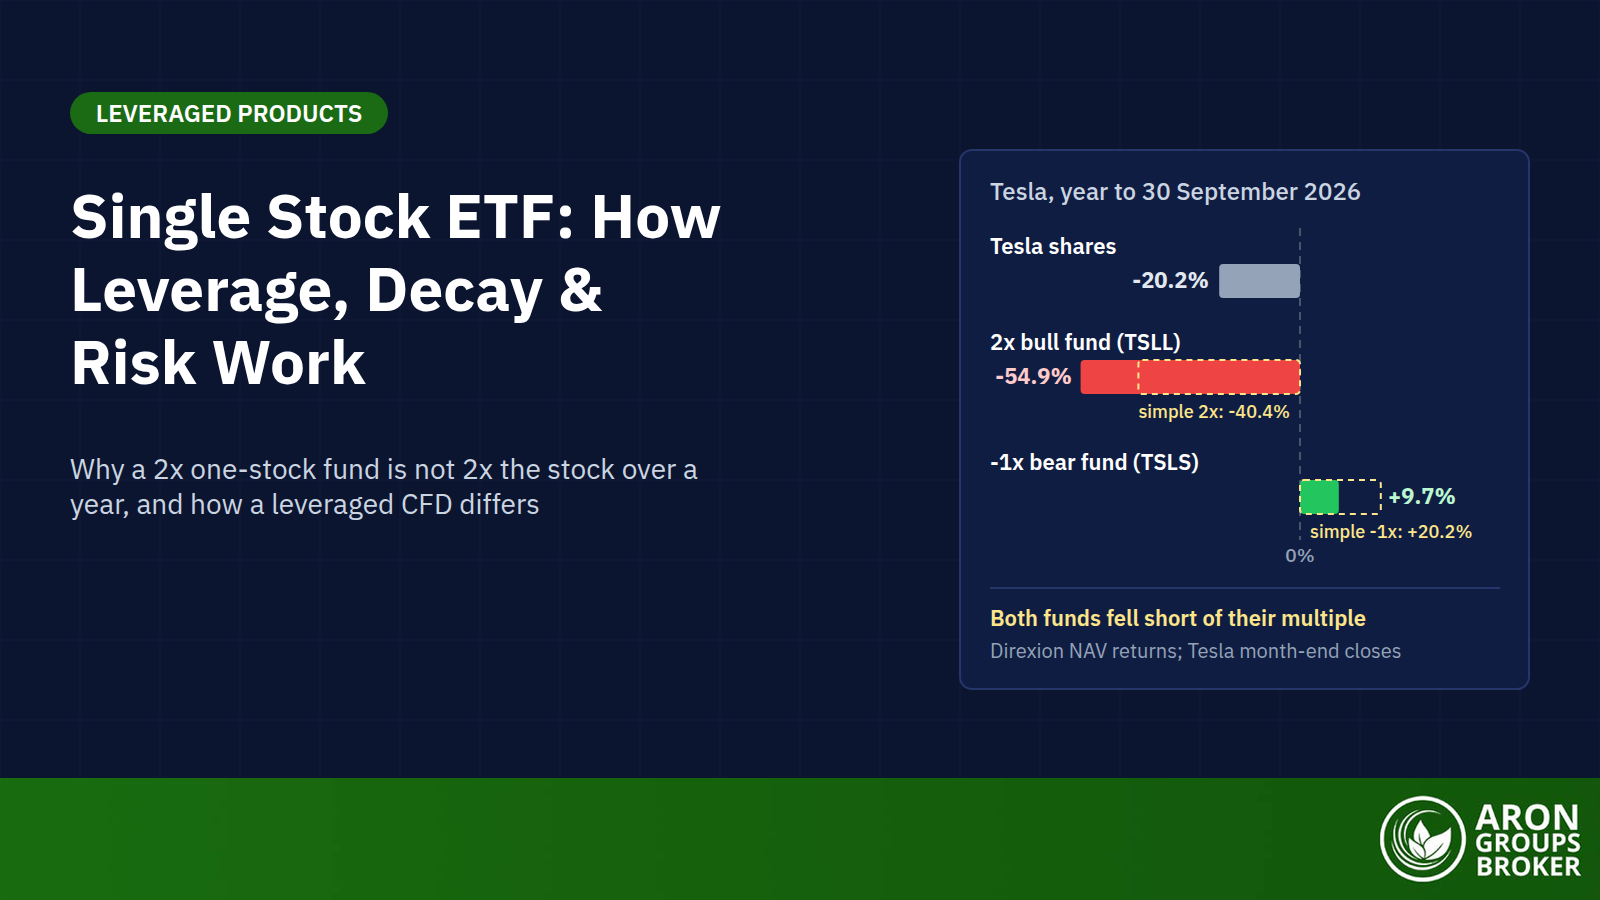
A single stock ETF is an exchange-traded fund that gives leveraged or inverse exposure to one company’s shares rather than to a basket or an index. A 2x fund aims to deliver twice the stock’s return on a single day, and a -1x fund the opposite of it, usually through swaps that reset every day. […]
- Read more
-
Prediction Market Arbitrage: How Cross-Platform Spreads Work, and Why “Risk-Free” Has a Catch
12 October 2026
,
Abe Cofnas
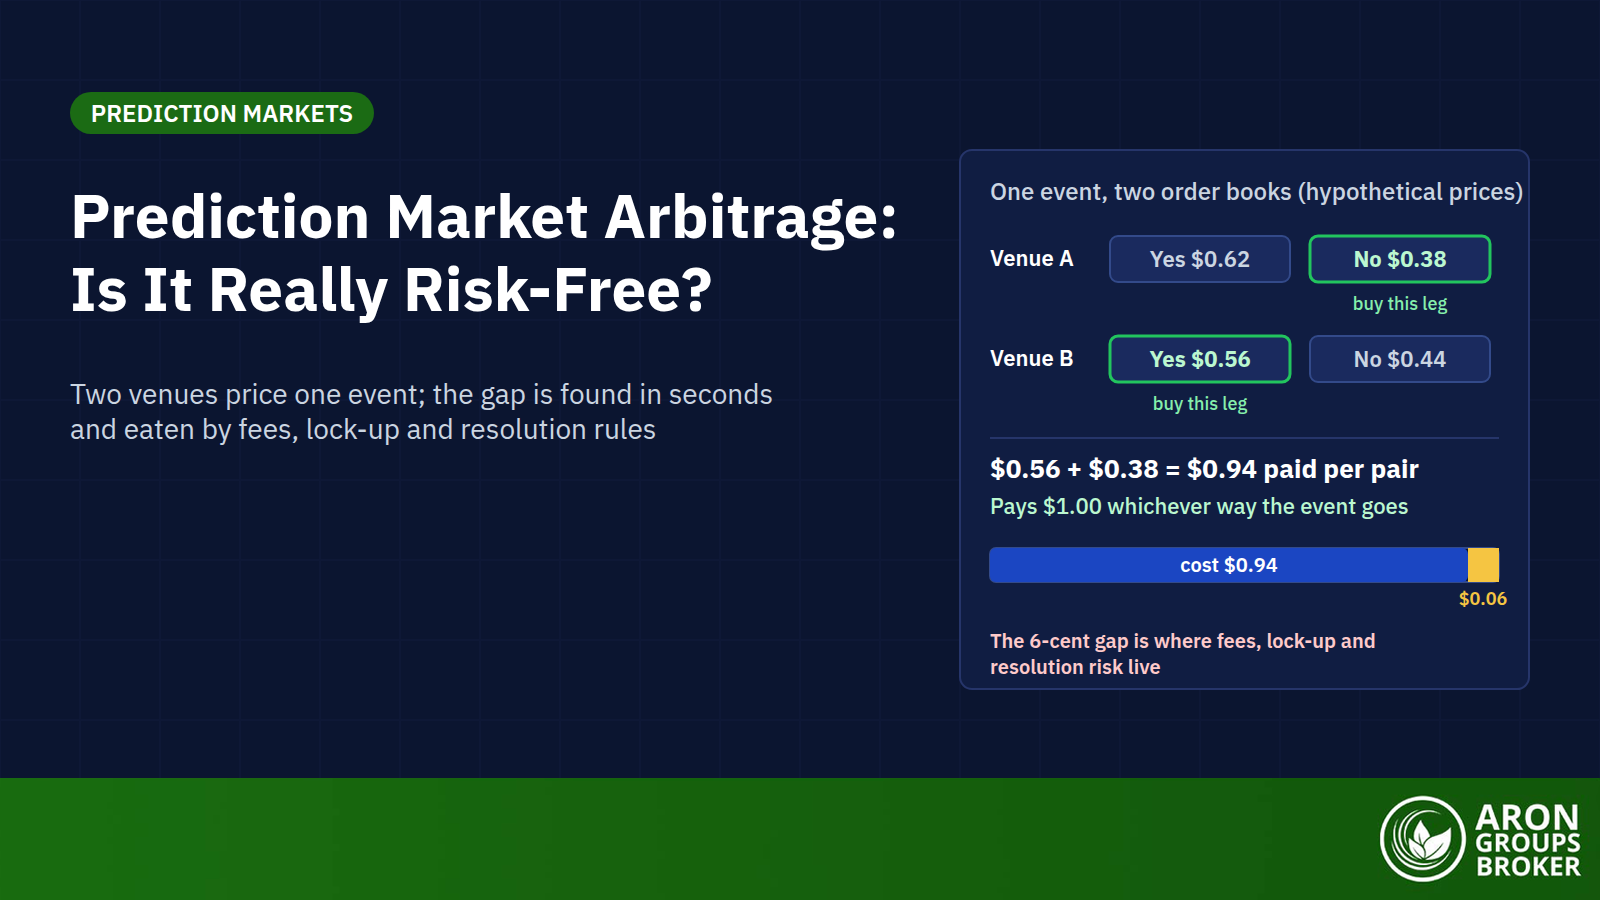
Prediction market arbitrage is the practice of buying the same event at different prices on two prediction markets, or both sides of one market. Either way the position pays out whatever happens. Because the profit does not depend on the outcome, people call it risk-free. In practice it is low-risk work with real frictions, not […]
- Read more
-
The Fed Dot Plot: How to Read the FOMC’s Interest-Rate Projections and Why Markets Move on It
9 October 2026
,
Abe Cofnas
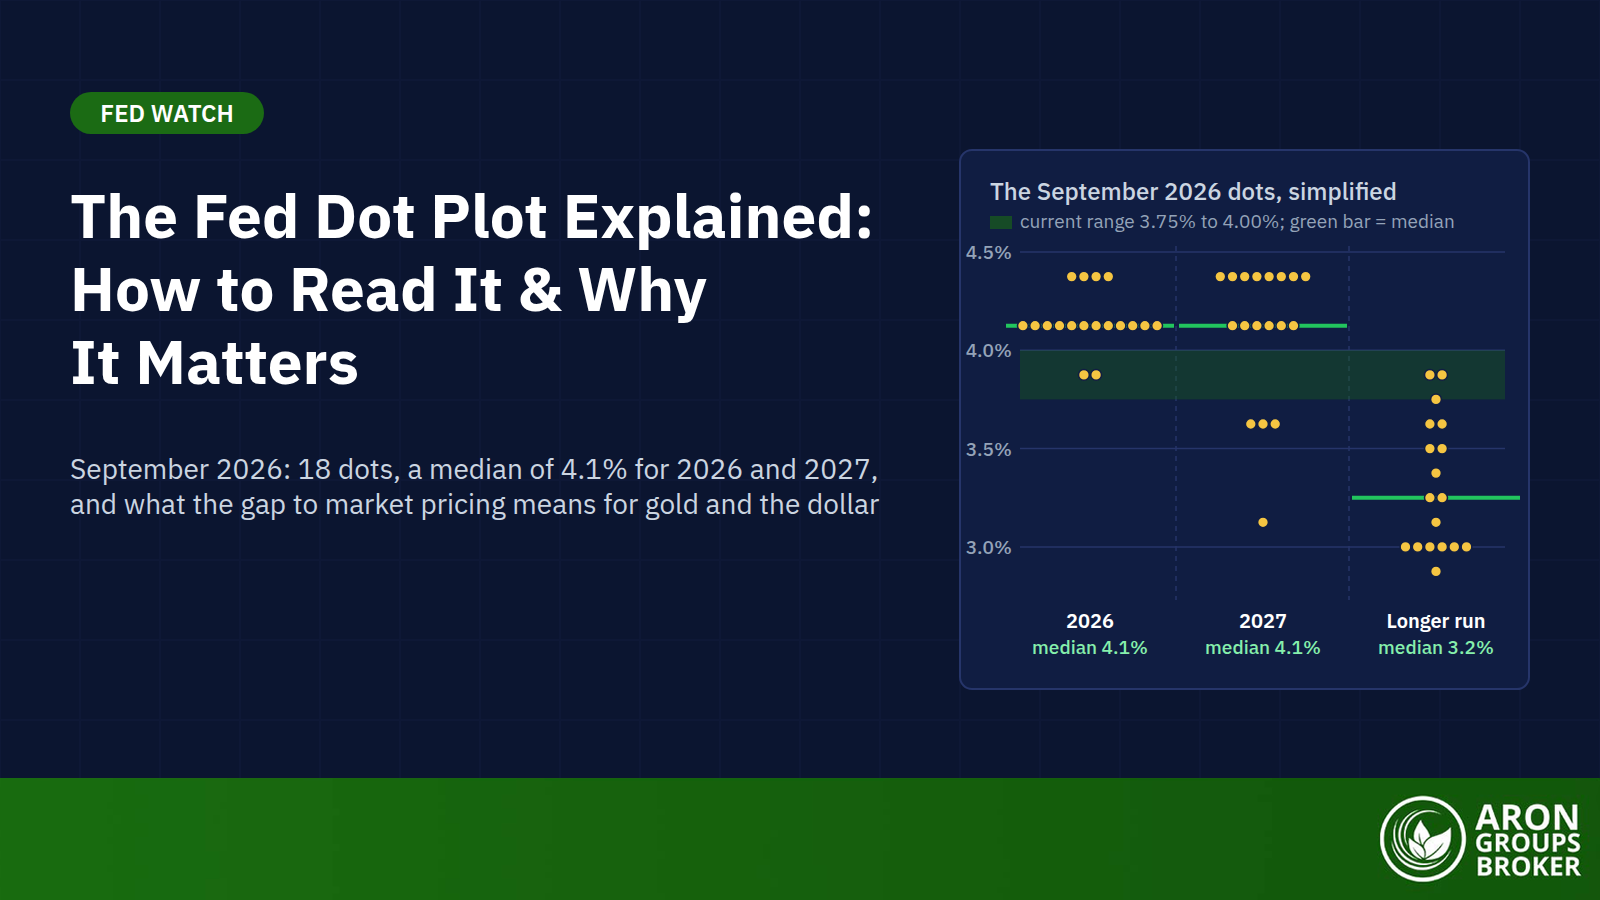
The Fed dot plot is a chart of where each Federal Open Market Committee (FOMC) participant thinks the federal funds rate should be in coming years. Each person places one anonymous dot per year-end, plus one for the longer run. The Fed publishes the chart quarterly in its Summary of Economic Projections (SEP). It matters […]
- Read more
-
War and Gold Price: How Conflict and Geopolitical Risk Move the Ultimate Safe Haven
9 October 2026
,
Abe Cofnas
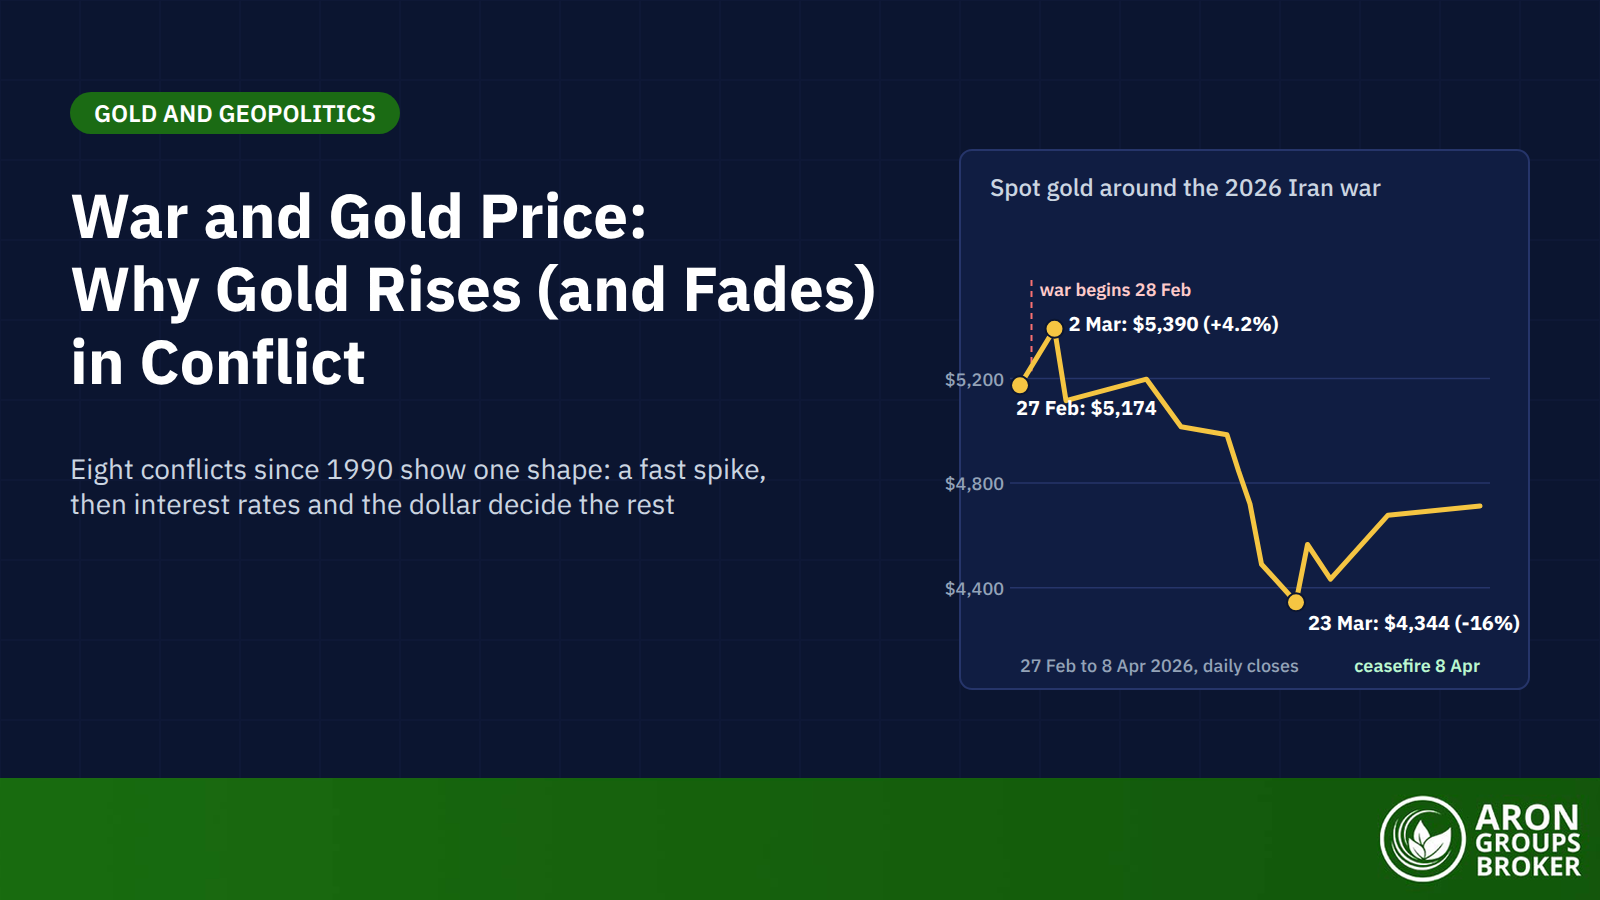
War and gold price describes the link between armed conflict and the price of gold. When fighting starts or looks likely, investors sell risk assets and buy gold, so the price usually jumps. It is a strong tendency rather than a rule, because the first spike often fades once interest rates and the dollar reassert […]
- Read more
-
Liquidation Cascades: How a Chain of Forced Liquidations Crashes Leveraged Markets
6 October 2026
,
Abe Cofnas
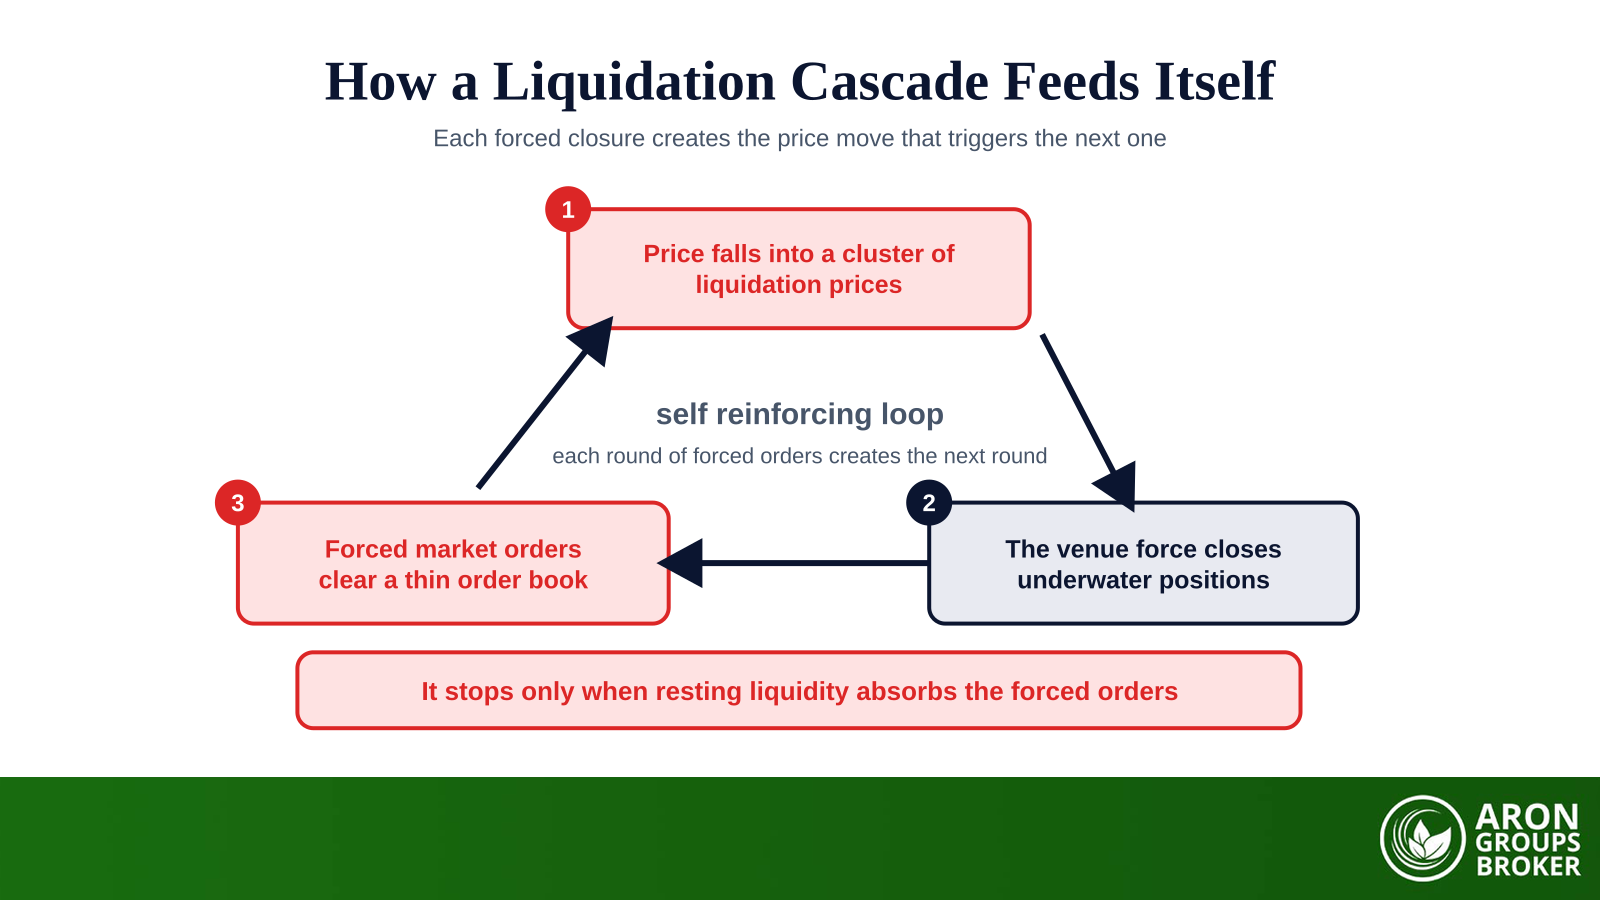
A liquidation cascade is a chain reaction of forced liquidations in which each closure triggers the next. Price falls into a cluster of liquidation prices, the venue force closes the underwater leveraged positions, and those forced sell orders push price lower still. The lower price reaches the next tier of liquidations, and the loop feeds […]
- Read more
-
Open Interest: What It Is, How It Differs from Volume, and How to Read It
5 October 2026
,
Abe Cofnas
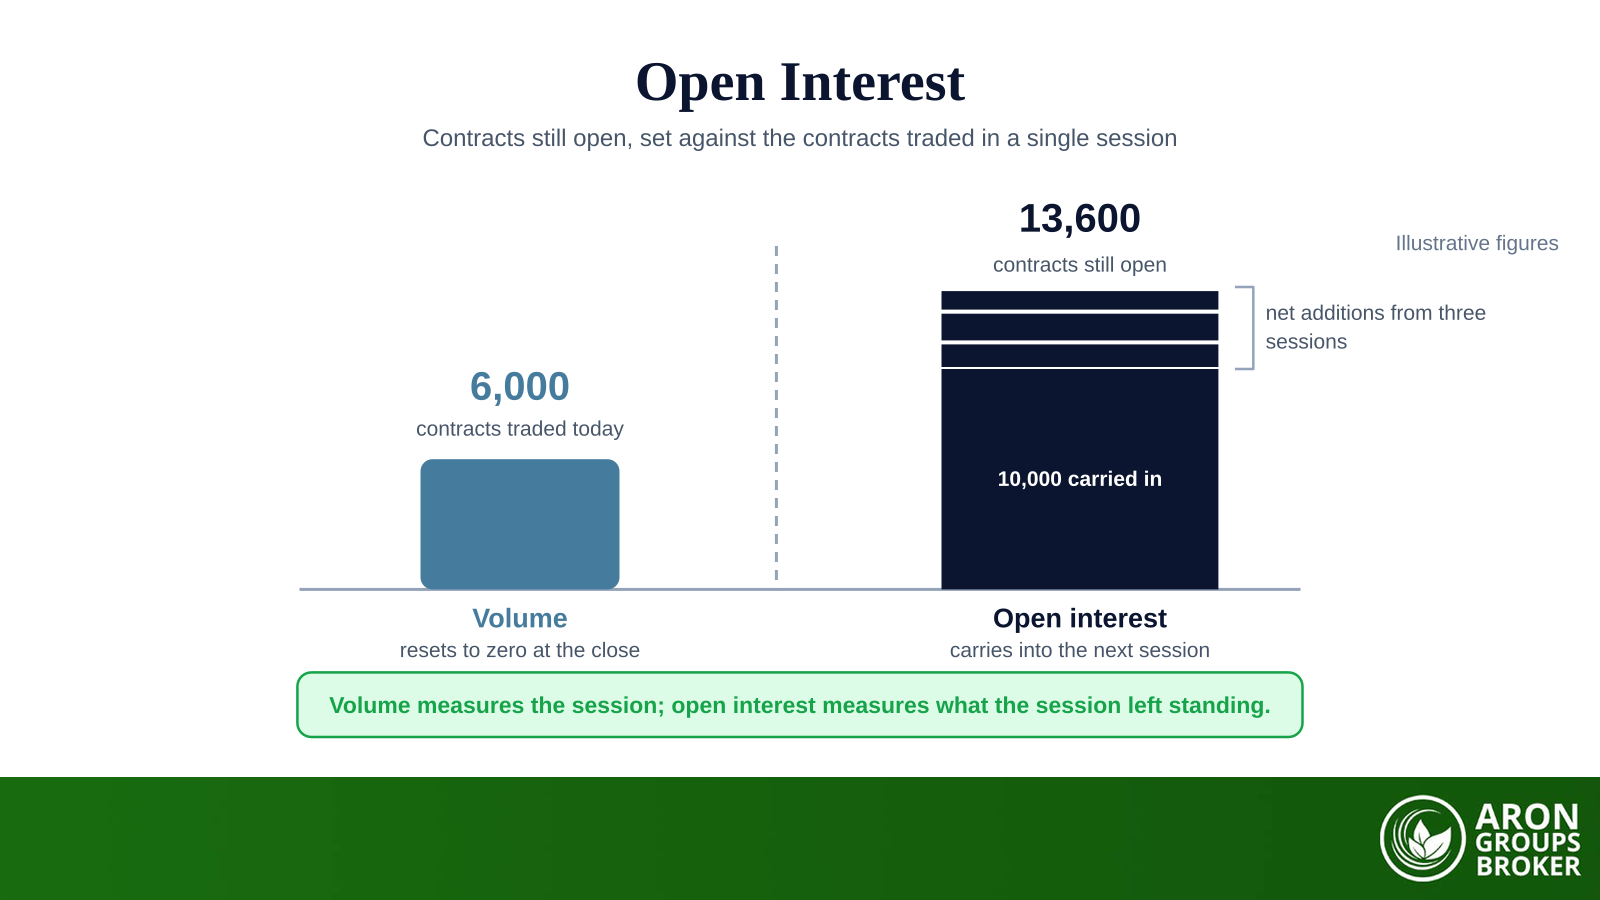
Open interest is the number of derivative contracts that are currently open, meaning contracts that have been entered and not yet closed, exercised or expired. It counts positions still standing, not positions traded. One futures or options contract adds a single unit to the total, and it stays there while both sides keep the position […]
- Read more
Load more