


Have you ever wondered why some price movements are strong and lasting while others seem to be just temporary fluctuations? The answer lies in one important element, trading volume. If you want to see what happens behind the scenes of market movements and understand the real strength of trends, volume analysis is exactly what you should not ignore. In this article, we will examine everything from the basic concepts to the specialized tools of volume analysis and its differences across various markets such as Forex, stocks, and cryptocurrencies in a simple and practical way. Do not miss the rest of this article.

- Volume analysis reveals the strength and reliability behind price movements. An uptrend or downtrend accompanied by high volume is generally more stable and trustworthy.
- The difference in volume analysis across markets is crucial. In the stock market, volume is real, while in Forex, tick volume is often used, which requires more careful interpretation.
- Advanced indicators such as OBV and Volume Profile, instead of showing volume over time, illustrate the flow of money entering and leaving the market as well as the most actively traded price levels, helping significantly in identifying key support and resistance zones.
What Is Trading Volume?
Trading volume in the Forex market refers to the number of times a trading instrument has been traded within a specific period. Unlike the stock market, where volume represents the actual number of shares traded, in Forex market, volume is often measured in the form of tick volume. A tick represents the number of times the price has changed, not necessarily the number of actual contracts traded. Therefore, interpreting volume in Forex requires a more precise understanding.
In many platforms such as MetaTrader, volume data is provided based solely on price fluctuations. Although some brokers also provide access to real trading volume, the data remains more dispersed compared to centralized markets. Nevertheless, volume continues to play an important role in technical analysis and is used to measure trend strength, confirm breakouts of support and resistance levels, and analyze price behavior on candlestick charts.
Why Is Volume Important in Technical Analysis?
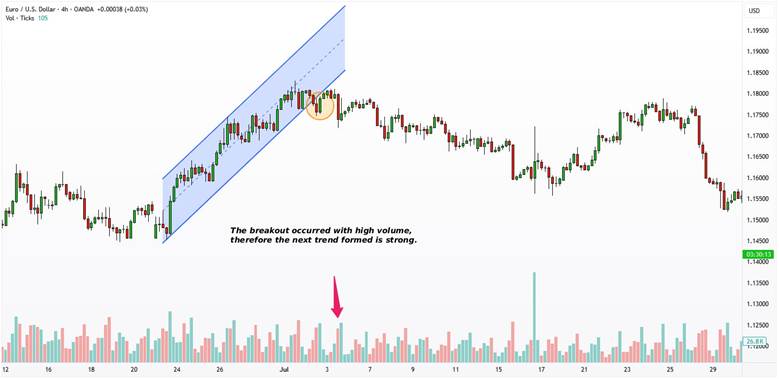
Volume is one of the key factors in technical analysis for identifying the strength or weakness of a price movement. When the price of an asset rises or falls but trading volume is low, that movement may not be sustainable and could quickly reverse. However, when a breakout of a resistance or support level is accompanied by high volume, the likelihood of the move continuing is much higher, as it indicates strong buying or selling participation in the market.
Changes in volume can also signal the end of a trend or the beginning of a new phase. For example, if an uptrend is accompanied by gradually decreasing volume, it may indicate weakening buying pressure and a potential price correction. Conversely, a sudden spike in volume at the end of a downtrend may suggest the entry of buyers and the formation of a market bottom. For this reason, successful analysts always study volume alongside price action, candlestick patterns, and key levels to gain a more accurate view of market conditions.
The Best Volume Analysis Tools in Technical Analysis
For accurate volume analysis in the Forex market, various tools have been developed, each providing a different perspective on trading volume. Understanding and correctly using these volume indicators helps traders identify better entry and exit points. Below, we will review three of the most commonly used volume indicators that are available on different trading platforms.
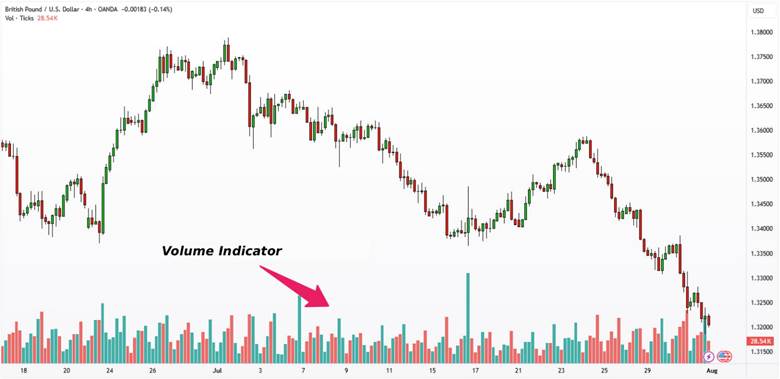
Volume Indicator
The Volume indicator is the simplest and most fundamental tool for examining volume on a chart. It appears as bars at the bottom of the chart, with each bar representing the volume associated with that specific candlestick. Although real volume data is rarely available in Forex, even using tick volume can provide useful insights into the level of trader participation and market activity.
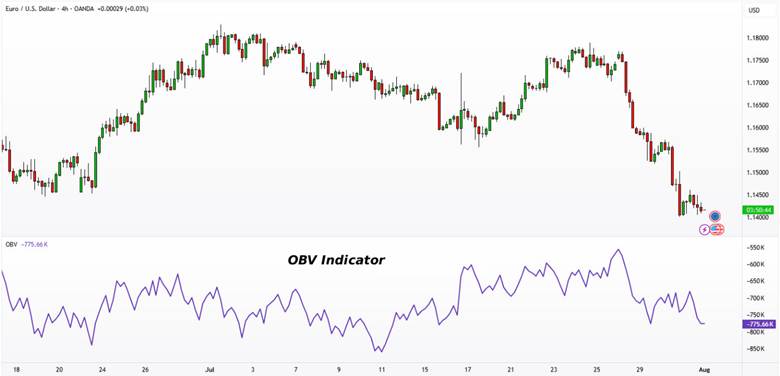
OBV Indicator
The On-Balance Volume (OBV) indicator is a more advanced volume analysis tool that records volume cumulatively in relation to price direction rather than showing raw volume. This indicator assumes that volume on bullish days represents the inflow of smart money, while volume on bearish days indicates capital outflow.
In the OBV formula, if the closing price is higher than the previous day’s, that day’s volume is added to the total, and if it is lower, it is subtracted. The result is a volume flow line whose trend can often lead price movements. For example, if the price is moving sideways but the OBV is trending upward, it may signal a potential bullish breakout.
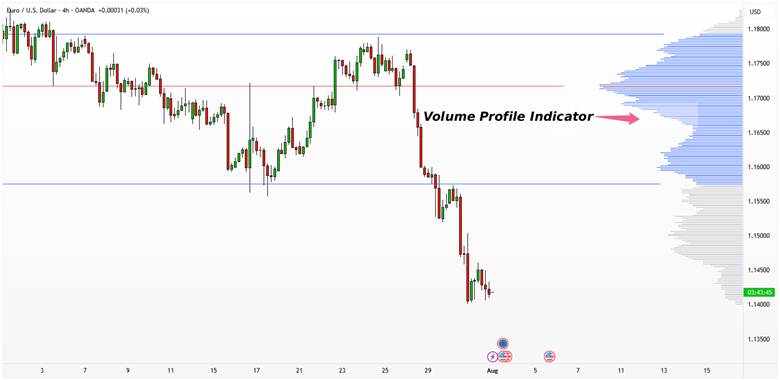
Volume Profile Indicator
The Volume Profile indicator is one of the most advanced tools for volume analysis. Instead of analyzing volume over time, it measures volume based on price levels. This indicator shows the price zones where the highest trading activity has occurred. In other words, instead of identifying when volume was high, it reveals at which price levels the market reacted most strongly.
The Best Volume-Based Trading Strategies
According to sources such as LuxAlgo and Tradingsim, one of the most reliable volume trading strategies is confirming breakouts of key levels with a significant increase in volume. When the price breaks above a resistance level while volume rises at least 50 to 100 percent above the 20-day average, the probability of the move continuing increases considerably.
In contrast, low-volume breakouts are usually false or short-lived. Additionally, divergence between volume and price, especially near important levels, is a strong signal of trend weakness and a possible reversal, which professional analysts closely monitor.
Furthermore, sources like Tradewiththepros and Vestinda recommend combining the OBV (On-Balance Volume) indicator with Volume Profile to identify precise entry and exit points. By recognizing high-volume and low-volume nodes (HVN or LVN) and analyzing the flow of capital through OBV, traders can enter or exit trades at the most favorable times.
These strategies are generally more reliable on higher timeframes, and when combined with proper risk management, they can significantly enhance analytical accuracy and trading performance.

When the price reaches a new high but volume decreases, it may indicate trend weakness and a potential reversal.
Differences in Volume Analysis Between Stock, Crypto, and Forex Markets
Volume analysis in financial markets varies significantly depending on each market’s structure and mechanism. Understanding these differences helps analysts interpret data correctly and avoid analytical errors.
Volume analysis in the stock market is generally more reliable due to its transparency and centralized structure. In the crypto market, high volatility and the lack of unified data require analysts to act more cautiously. In Forex, where real volume is not available, the focus should be on accurately interpreting price behavior and using tick volume for relative confirmation.
Below is a summary of the key differences in volume characteristics across markets:
| Feature | Stock Market | Crypto Market | Forex Market |
|---|---|---|---|
| Type of Volume Data | Actual recorded volume from official exchanges | Exchange-dependent volume with no universal standard | Tick volume (number of price changes) |
| Data Transparency | Very high | Moderate to low | Low (no centralized data) |
| Access to Information | Complete and unified | Limited to each exchange | Dependent on broker platform |
| Data Fragmentation | Centralized through main exchanges | Fragmented across multiple exchanges | Decentralized and dispersed |
| Trader Behavior | Mostly institutional and corporate traders | Combination of retail and volatile institutional traders | Mix of retail and institutional traders |
| Signal Reliability | High | Moderate and sometimes noisy | Dependent on tools and personal interpretation |
Candlesticks with long wicks and high volume are usually signs of liquidity absorption rather than clear directional signals in the market.
Conclusion
A proper understanding of the hidden movements behind trading volume is a competitive advantage in financial markets. A trader who focuses only on price sees only half of the picture, but one who also analyzes volume can identify the true flow of strength and weakness. This distinction, over the long run, separates profitable trading from emotional trading.