


Success in trading isn’t about predicting the future with precision; it’s about accurately understanding the present state of the market. One key concept that helps achieve this understanding is the Daily Bias, or the market’s directional tendency within a single trading day.
Many traders enter positions without first identifying the day’s bias, and despite solid technical analysis, they end up taking losses. If you aim to enhance your trading strategy based on the market’s daily behavior, recognizing the daily bias can be a crucial tool. In this article, we’ll explore its definition, identification methods, and practical applications, particularly within the ICT (Inner Circle Trader) Price Action framework.

- Daily bias refers to identifying the market's dominant intraday tendency, focusing on short-term price movements rather than the broader trend.
- In ICT price action, daily bias is determined by analyzing the previous day’s candlestick, the price’s position relative to the Daily Open, and how liquidity is drawn from prior highs or lows.
- By applying this approach, traders can avoid emotional entries and align their trades with the correct daily direction, increasing their chances of success.
What Is Daily Bias and Why Does It Matter for Traders?
According to City Traders Imperium, Daily bias refers to the dominant market tendency on a given trading day. In other words, it is the understanding of whether the market shows a bullish or bearish inclination on that day. This assessment is based on technical data, price structure, liquidity, and previous candlestick patterns.
The importance of daily bias lies in its direct impact on key trading decisions, including entry and exit points, stop-loss, and take-profit levels. Traders who ignore daily bias often find themselves trading against the market’s flow, getting confused by temporary pullbacks. Correctly identifying the daily bias not only improves the win rate but also helps traders avoid emotional and irrational entries. This concept plays a central role in strategies such as Price Action trading.
How Does Daily Bias Differ from the Overall Market Trend?
The overall market trend reflects the dominant direction of price movement over a longer period, such as daily, weekly, or monthly timeframes. In contrast, daily bias focuses on a single trading day and can sometimes move against the long-term trend.
For example, even if the broader market trend is bullish, the market might enter a temporary pullback on a given day, creating a bearish daily bias.
| Feature | Daily Bias | Overall Market Trend |
|---|---|---|
| Timeframe | One trading day | Several days to weeks |
| Volatility | High | Lower, slower shifts |
| Analytical Tools | Daily candle, liquidity zones, Daily Open | Higher timeframes, trend structure |
| Purpose | Short-term trade direction | Broader market outlook |
Understanding the difference between these two concepts enables traders to make more precise decisions aligned with their chosen timeframe.
What Is Daily Bias in ICT Price Action?
In the ICT (Inner Circle Trader) Price Action methodology, the daily bias is one of the key pillars for making trade entry decisions. It is determined through analyzing the market structure, the daily opening price, liquidity zones, and the Forex kill zones.
Daily Bias from Michael Huddleston’s Perspective
Michael Huddleston, the founder of the ICT trading method, emphasizes that the daily bias should be established before the New York session opens. He explains that the market typically accumulates liquidity on one side (such as the previous day’s high or low) and then moves in the opposite direction. This behavior defines the likely direction of the day.
The Role of Timeframes in Determining ICT Daily Bias
Within ICT methodology, higher timeframes such as H4 and Daily are used to identify the overall market structure, while lower timeframes like M5 and M15 are employed to fine-tune entry points based on the final bias. This multi-timeframe alignment increases the accuracy of direction and entry confirmation.
Market Structure and Its Impact on ICT Daily Bias
Market structure consists of significant highs and lows, breaks, and reversals. In ICT analysis, when the market breaks a key high or low on the daily timeframe and sweeps liquidity, it is a strong indication of the daily bias. Typically, after liquidity is collected, the bias reverses.
Methods for Identifying the Market’s Daily Direction (Daily Bias)
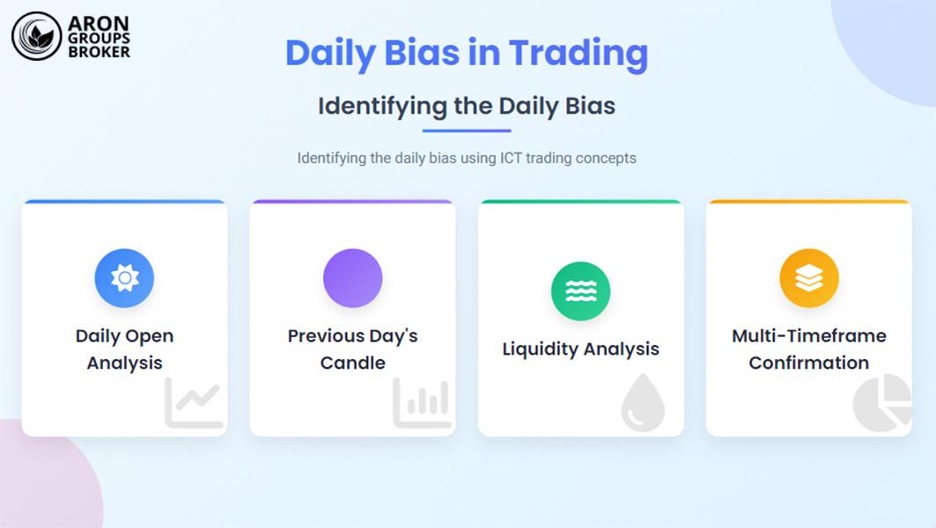
There are multiple approaches to determining the Daily Bias, each developed based on price behavior, market structure, and liquidity movement. Below are four practical methods with examples.
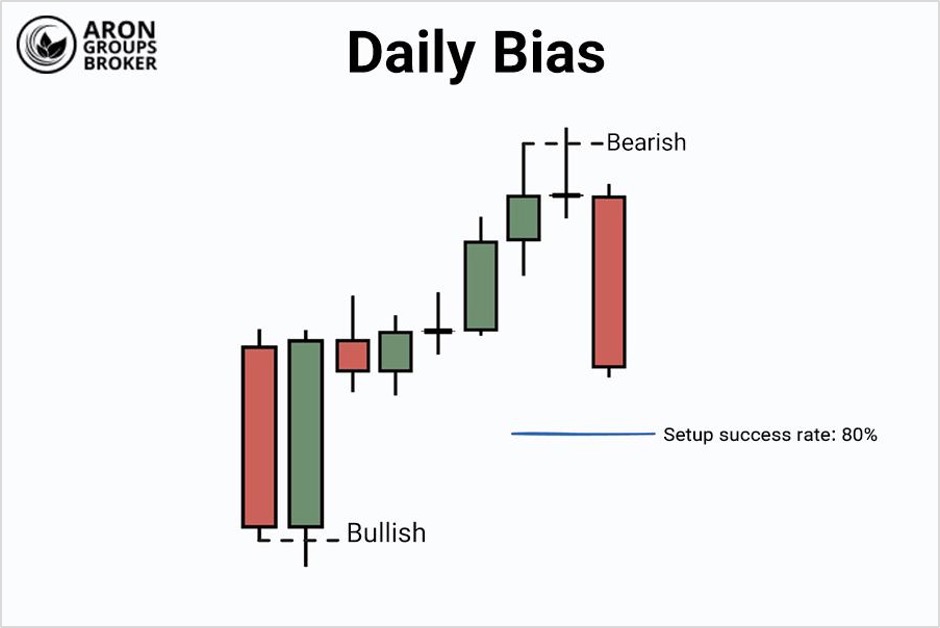
1. Analyzing the Previous Day’s Candle
One of the simplest yet most effective ways to identify the daily bias is by analyzing the previous day’s candlestick.
- If the prior candle was strongly bullish and closed near its high, the next day’s bias is likely to be bullish as well.
- Conversely, if the candle was bearish and closed near its low, there is a higher probability that the downward movement will continue.
2. Using the Daily Open to Determine the Bias
The Daily Open line is a key reference in the ICT trading framework.
- When price trades above the Daily Open for most of the session, the bias is considered bullish.
- When price remains below the Daily Open, the bias is bearish.

This simple yet powerful observation helps traders align their short-term trades with the day’s prevailing direction.
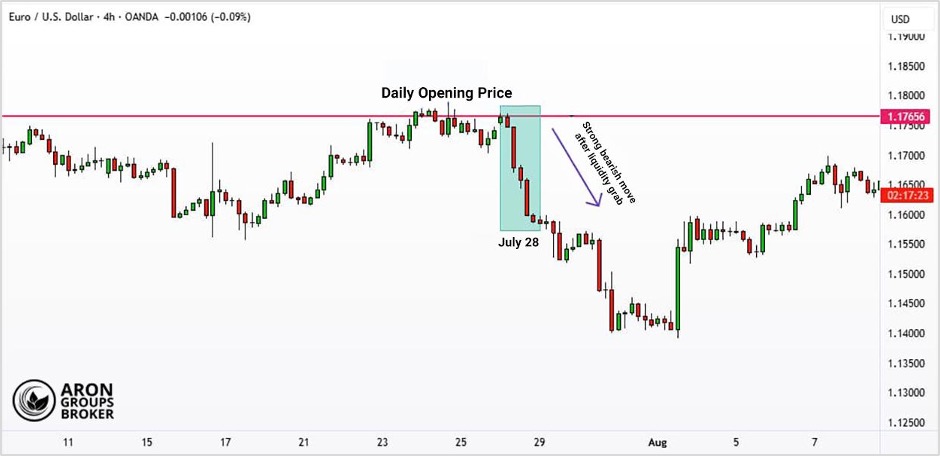
3. Liquidity Analysis to Anticipate Market Direction
According to ICT principles, the market tends to sweep liquidity from one side (either above the previous day’s high or below the previous day’s low) before reversing in the opposite direction.
Therefore:
- If liquidity is taken above the previous day’s high, a bearish bias is more likely for the rest of the day.
- If liquidity is taken below the previous day’s low, it often signals a bullish bias forming afterward.
4. The Role of Lower Timeframes in Confirming the Daily Bias
After determining the bias on higher timeframes, it is essential to confirm it on lower timeframes, such as M5 and M15, using price action analysis.
For instance, a market structure break in the direction of the identified bias can provide strong confirmation for entry.
This top-down alignment between higher and lower timeframes significantly enhances the accuracy of bias determination and trade execution.
Common Mistakes Traders Make When Understanding Daily Bias
A poor understanding of the Daily Bias can lead to incorrect entries and missed trading opportunities. Below are the most frequent mistakes traders make.
Confusing a Pullback with a Bias Reversal
Many traders mistake a temporary price correction for a change in bias.
For example, during a bullish bias, a short-term retracement on a lower timeframe is often misinterpreted as the start of a bearish trend. Recognizing the difference between a pullback and an actual shift in bias is crucial for maintaining consistency.
Ignoring Liquidity and Demand Zones
Traders who focus only on chart patterns and neglect liquidity zones often enter the market at the wrong points.
In the ICT (Inner Circle Trader) methodology, the daily bias is strongly dependent on liquidity areas zones where stop hunts or institutional orders are likely to occur. Ignoring these zones leads to premature or poorly timed trades.
Constantly Changing Bias Without Logic
Some traders frequently switch their bias in response to minor market fluctuations.
This behavior usually stems from emotional instability or the lack of a defined trading plan. A change in bias should be justified by clear technical evidence, such as a market structure break or a liquidity sweep, not by impulse or a single candlestick pattern.
How to Trade Based on Daily Bias
Once the daily bias has been identified, it must be integrated into a structured trading plan. The following are three key steps to trade effectively in line with the market’s daily direction.
1. Identifying Entry and Exit Points Based on Daily Bias
In a bullish bias, entries should ideally be taken during bearish pullbacks near demand zones. Conversely, in a bearish bias, look for entries on bullish retracements near resistance levels.
Entry zones should be confirmed by price action signals on lower timeframes (such as M5 or M15), while exits should be planned near opposite liquidity levels to maximize returns.
2. Setting Stop-Loss and Take-Profit in Line with the Day’s Direction
When trading according to the daily bias:
- The stop-loss should be placed beyond the structure opposite to the bias, for example, below the low in a bullish bias.
- The take-profit should be positioned based on liquidity zones, order blocks (OB), or imbalances on higher timeframes.
This approach optimizes the risk-to-reward ratio and reduces the trader’s emotional stress during active positions.
3. Aligning Daily Bias with Higher Timeframe Market Structure
In advanced strategies such as ICT Price Action, the daily bias should ideally align with the overall structure of higher timeframes like H4 and Daily.
For instance, if the H4 structure is bullish, it is preferable to take only long positions within a bullish daily bias.
This alignment minimizes analytical conflicts and significantly increases the probability of successful trades.
Supporting Tools for Identifying Daily Bias
In addition to price action analysis, several auxiliary tools can be used to improve the accuracy of identifying the daily market bias.
Using Technical Indicators to Analyze Market Bias
Professional traders commonly apply indicators such as the following:
VWAP (Volume Weighted Average Price):
The VWAP indicator calculates the average price weighted by trading volume, showing the level around which the majority of intraday transactions have occurred. This level acts as the “center of gravity” for price action throughout the session. Many traders use VWAP to identify potential reversal zones or trend continuation levels.
- When the price trades above VWAP, the market bias is considered bullish.
- When it remains below VWAP, the bias is bearish.
ADR (Average Daily Range):
The ADR indicator measures the average daily price range over a specified period (typically 14 days). It helps traders estimate how much volatility to expect in a single trading day and whether there is sufficient room to trade in the direction of the daily bias.
- If the market has already moved beyond its typical daily range, the likelihood of a pullback or reversal increases.
Moving Averages (MA50, MA200):
Moving averages are essential tools for identifying the overall trend direction. In daily bias analysis, the price’s position relative to these averages confirms the day’s likely direction.
- For example, if the price is above the MA50 and holding it as support, a continuation of the bullish bias is more probable.
- Likewise, a crossover of the price with these moving averages may signal a potential bias shift.
پاراگراف به شکل زیر بازنویسی شد.
These indicators complement price action and assist traders in making faster, more informed decisions.
Using Sentiment and News Analysis for Daily Market Direction
According to Reuters, market sentiment and economic news are crucial factors in determining the daily directional bias.
For instance, before the Federal Reserve Chair’s speech at Jackson Hole, markets often enter a consolidation or wait-and-see phase, as volatility drops while traders assess the likelihood of future interest rate cuts. Such macroeconomic events can temporarily drive price direction even against technical trends.
Therefore, combining sentiment analysis with macroeconomic data such as the Consumer Price Index (CPI) or interest rate decisions enables traders to align their strategies more effectively with the prevailing daily bias.
Simple Pre-Market Checklist for Determining Daily Bias
Before starting each trading day, review the following checklist:
- Has liquidity been swept from one side of the previous day’s range?
- What is the overall market structure on higher timeframes?
- Does the Daily Open confirm the expected bias?
- Is the lower timeframe structure aligned with the higher bias?
- Are there any upcoming high-impact news events?
Having this checklist ensures emotional control, analytical discipline, and consistency in your daily decision-making process.
Conclusion
In this article, we explored the concept of Daily Bias in depth and examined how it can shape the course of daily trading decisions. From understanding the basic definition of bias and distinguishing it from the overall market trend, to identifying it using tools such as the previous day’s candle, Daily Open, liquidity analysis, and lower timeframe confirmations, each element serves as a valuable resource for informed traders. We also discussed how to apply the daily bias in real trades and how to avoid common mistakes associated with it.
Suppose you are not yet familiar with concepts such as liquidity, Forex kill zones, or the ICT (Inner Circle Trader) Price Action methodology. In that case, it is strongly recommended to develop a solid understanding of these topics before incorporating daily bias into your trading plan.