


Many investors and market participants use economic indicators to forecast market direction and price movements. Economic indicators are statistical measures of economic activity, and each relates to a specific area. Common examples include the PMI index, the Consumer Price Index inflation measure, and the Industrial Production index. In this article, we explore Durable Goods Orders as a leading economic indicator and examine their role in market analysis.

- Durable Goods Orders signal changes in US manufacturing demand before production and jobs respond.
- Core Durable Goods Orders reduce transport noise and reveal cleaner underlying demand trends.
- Durable Goods Orders MoM (Month-over-Month) surprises can move USD pairs through yields and rate expectations.
- Capital Goods vs Consumer Durable Goods separates business investment signals from household spending signals.
Durable Goods Orders
Durable Goods Orders is a leading economic indicator that measures current industrial activity and helps forecast future economic conditions. Since 1957, the US Census Bureau has released it monthly using a large survey-based process. The questionnaire is known as the M3 Survey, which tracks manufacturers’ shipments, inventories, and orders.
Durable Goods Orders reports new orders placed with domestic producers, regardless of where the final buyer is located. While it also reviews shipments and inventories, it primarily reflects new demand for durable manufactured goods. This helps traders gauge demand strength for goods delivered in the near or longer term.
Because it is leading, rising new orders often signal higher demand and stronger real production ahead. Higher production can support employment gains and, over time, contribute to broader economic growth. If the index falls, weaker GDP, stock market declines, and recession risks can become more likely.
Compared with many indicators, Durable Goods Orders can offer clearer insight into supply chain conditions. It also helps investors assess revenue trends in industries like machinery, technology manufacturing, and transportation.

Durable Goods Orders Effect on Forex is usually strongest when the US report shifts Treasury yields, because yield moves quickly reprice USD expectations across major pairs.
Core Durable Goods Orders
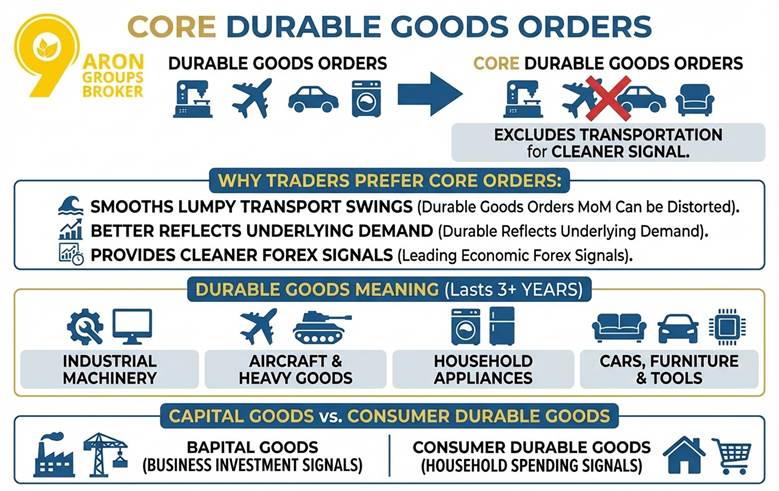
Core Durable Goods Orders refer to Durable Goods Orders after removing transportation items from the total. Aircraft and transport equipment are expensive, so one large order can distort the headline trend. A major booking or cancellation can shift results and confuse the Durable Goods Orders Meaning. Therefore, traders use Core Durable Goods Orders for a cleaner read on Leading Economic Indicators.
Reasons traders prefer Core Durable Goods Orders:
- Transportation orders are lumpy and can swing Durable Goods Orders MoM (Month-over-Month) sharply.
- Core results better reflect underlying US Manufacturing Data and business demand trends.
- Cleaner signals can improve timing when trading the Durable Goods Orders Effect on Forex.
Headline vs. Core: Which One Matters?
Headline Durable Goods
- Includes Transport? Yes (Aircraft, Cars, Boats).
- Volatility: High (One Boeing order spikes the data).
- Trader Focus: Knee-jerk reaction (Algos trade this).
- Best For: Short-term volatility trading.
Core Durable Goods
- Includes Transport? No (Ex-Transportation).
- Volatility: Low (Shows stable trends).
- Trader Focus: True Trend Analysis (Analysts, check this).
- Best For: Long-term economic health check.
Durable Goods Orders Meaning
Durable goods are high-value items designed to last three years or longer, based on US Department of Commerce definitions. Because purchases are infrequent, Durable Goods Orders can signal confidence and shifting demand conditions.
Examples of durable goods covered in the US Durable Goods Orders Report:
- Industrial machinery, factory equipment, and computer equipment are used for production.
- Aircraft, large storage tanks, and other heavy investment goods.
- Washing machines, dishwashers, refrigerators, and other major household appliances.
- Furniture, cars, trucks, luggage, carpets, jewelry, tools, and semiconductors.
Capital Goods vs Consumer Durable Goods
Capital Goods vs Consumer Durable Goods helps separate business investment signals from household spending signals. Capital goods often track corporate expansion, while consumer durable goods reflect household confidence and credit.
Use Core Durable Goods Orders to confirm Durable Goods Orders surprises, because transport swings often mislead traders and distort Forex reactions.
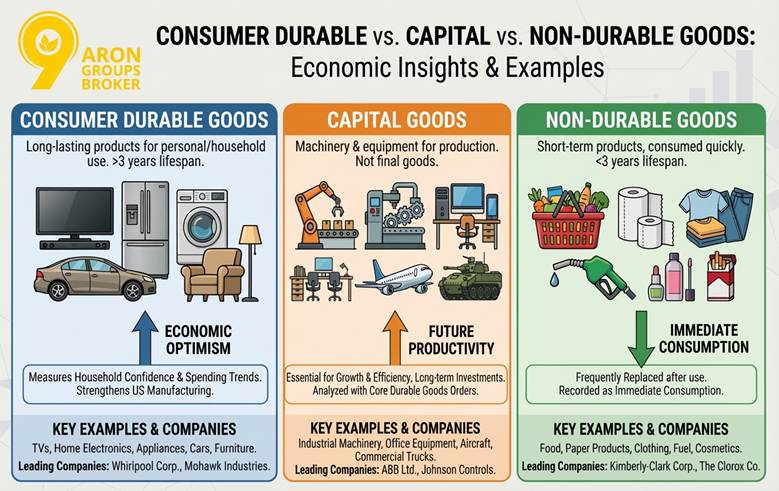
Consumer Durable Goods
Consumer durable goods are long-lasting products bought by end users for personal or household needs. Examples include televisions, large household appliances, furniture, cars, and sports equipment used daily.
In the US Durable Goods Orders Report, this category helps measure household confidence and durable spending trends. A rise in consumer durable goods demand can strengthen US Manufacturing Data and reflect higher economic optimism.
Capital Goods
Capital goods include machinery and industrial equipment that firms use to produce other products. These items are not final goods but are essential for production growth and efficiency improvement.
Some capital goods overlap with consumer products like office computers, phones, and business furniture. Items rented by landlords to tenants may also count as capital goods within industry classifications.
Examples include buildings, defence equipment, aircraft, buses, boats, and large commercial trucks. Aircraft form a major part of Durable Goods Orders due to their high price and long production cycles.
Capital goods are called investments because they last many years and are not bought frequently. This category is vital for analyzing Capital Goods vs Consumer Durable Goods in economic assessments.
Analysts often watch Core Durable Goods Orders and capital goods trends together to evaluate future productivity and investment strength.
Non-Durable Goods
Non-durable goods last less than three years and must be replaced frequently after consumption. Examples include food, paper products, clothing, fuel, cosmetics, and tobacco.
These goods are usually not rented and are recorded as immediate consumption in the US Manufacturing Data.
Leading Consumer Durable Goods Companies
Top global manufacturers of consumer durable goods include Kimberly-Clark Corp. and ABB Ltd. Other major producers are Johnson Controls, The Clorox Co., Mohawk Industries, and Whirlpool Corp. They operate across packaging, electronics, chemicals, home furnishings, and specialty industrial products.
Key examples of consumer durable goods:
- Televisions and home electronics.
- Major home appliances like refrigerators and washing machines.
- Cars, furniture, and home furnishings.
Key examples of capital goods:
- Industrial machinery and factory equipment.
- Office computers, telephones, and furniture.
- Commercial aircraft, defence vehicles, buses, and boats.
How the Durable Goods Orders Index Is Produced
The Durable Goods Orders index is one of the most important parts of US Manufacturing Data and is published monthly. It is produced by the US Census Bureau through a detailed survey called The M3 Survey.
This report collects accurate information about manufacturers’ shipments, new orders (excluding cancellations), and unfilled orders at the end of each month. It also tracks total inventories, measured either at cost or market value, divided into stages like raw materials, goods in progress, and finished products.
Around 5,000 reporting units representing about 3,100 companies across the United States take part in this process. Their responses capture monthly changes in production, inventory, and demand, forming the statistical foundation of the M3 manufacturing indicator.
This dataset is the main source for calculating Durable Goods Orders MoM (Month-over-Month), which investors closely watch.
How Investors Use Durable Goods Orders Data
Investors and analysts use Durable Goods Orders as a leading economic indicator to evaluate economic health and anticipate future growth trends. Because durable goods are expensive, both companies and households only purchase them when they feel financially confident.
Therefore, an increase in Durable Goods Orders reflects optimism and signals stronger manufacturing activity ahead.
If new orders rise, it means factories are likely to expand production and hire more workers.
If orders fall, manufacturers may reduce output and adjust their workforce to lower demand levels. In this way, the index offers a forward-looking view of the economy’s production and employment cycles.
Higher Durable Goods Orders often support stock markets since strong manufacturing data can imply higher corporate revenues and profits. Because durable goods take time to produce, the index also helps forecast long-term sales and income trends for industrial firms.
How Traders Interpret the Report
- Compare actual Durable Goods Orders results with forecasts and previous revisions.
- Monitor Core Durable Goods Orders to remove transportation noise from the data.
- Track Durable Goods Orders MoM (Month-over-Month) for short-term momentum shifts.
- Analyze Capital Goods vs Consumer Durable Goods to distinguish between investment and consumption trends.
- Evaluate the Durable Goods Orders Effect on Forex, as strong reports often strengthen the USD through yield expectations.
Trading Scenario: The “Aircraft” Trap
Imagine the Headline number jumps +5.0% (Bullish). You buy USD instantly.
- The Reality: You check the details and see Boeing sold 50 planes, but Core Orders actually fell -1.0%.
- The Result: The USD spikes up for 1 minute, then crashes as the market realises the “real” economy is weak.
- Lesson: Always check the Ex-Transport number before committing to a trade.
Factors That Influence the Durable Goods Orders Report
The US Durable Goods Orders Report primarily reflects domestic production demand.
However, external and macroeconomic factors can strongly affect its results.
The number of new orders from manufacturers is the most influential variable in shaping the headline index.
Trade restrictions, currency fluctuations, and geopolitical events can alter costs and affect industrial spending. For example, if a foreign supplier of raw materials raises tariffs or enforces sanctions, US producers may reduce new orders.
Warning: The "Revision" Risk
Durable Goods reports are notorious for massive revisions.
What happens: Last month's data might be revised down significantly in this month's report.
Risk: A "good" number today might be ignored if last month was revised to "terrible". Always look at the net revision.
Interest rate changes also matter since companies often finance costly machinery and equipment purchases.
When interest rates fall, borrowing becomes cheaper, encouraging businesses to place more orders. When rates rise, companies may delay major investments, which lowers Durable Goods Orders and slows economic activity.
By tracking these shifts, traders and economists can better interpret the relationship between Durable Goods Orders, industrial production, and the overall economic outlook.
Example: Durable Goods Orders and the Economy
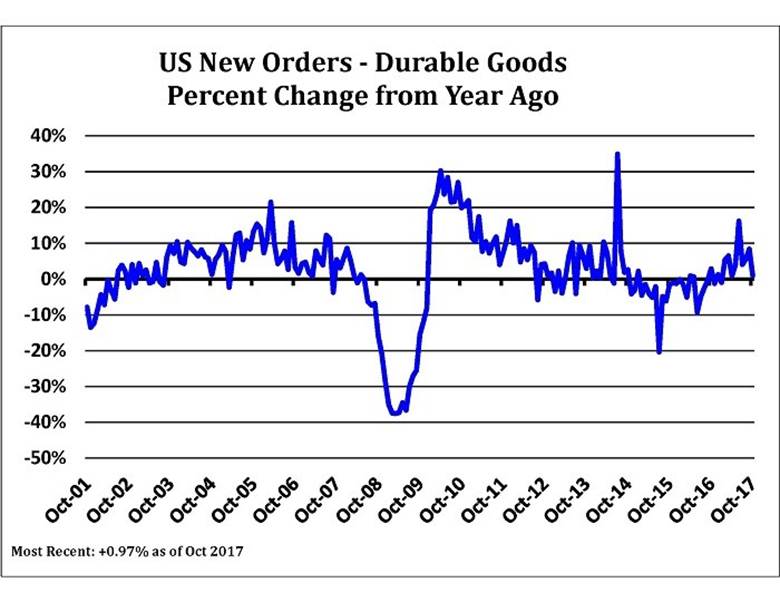
Durable Goods Orders warned about the 2008 downturn by weakening in US Manufacturing Data during 2007. In 2007, Durable Goods Orders fell versus the prior year despite monetary easing and tax cuts.
From September 2007 to March 2009, Durable Goods Orders dropped another 38 percent. Investors linked this sharp decline in Durable Goods Orders to the Great Recession in the United States.
This episode reinforced Durable Goods Orders Meaning as one of the most useful Leading Economic Indicators. In October 2009, the US Durable Goods Orders Report showed early stabilization in demand conditions.
Durable Goods Orders were down only 23 percent year over year, which looked less severe than earlier readings. Core Durable Goods Orders helped confirm improvement after removing transport-driven volatility from the headline.
Durable Goods Orders Inflation
Do Durable Goods Orders relate to inflation, especially today’s global inflation environment? To answer, first identify whether current inflation comes from a supply shock or a demand shock.
In a supply shock, prices rise because goods become scarce and harder to obtain. For example, during COVID, semiconductor shortages reduced car production and pushed used car inflation higher. In a supply shock, prices rise, but growth slows, and production weakens. In a demand shock, prices rise because many buyers chase the same goods.
In this case, prices rise, but growth can increase if supply is not constrained. During the pandemic exit phase, both supply and demand shocks appeared at the same time. This was visible in durable goods personal consumption data. After a sharp but brief early pandemic drop, consumer spending on durable goods began rising again.
By May 2020, spending returned to its pre-pandemic rate. Over the next eleven months, it rose by more than 600 billion dollars. That increase exceeded the total increase during the entire pre-pandemic decade from 2009 to 2019.
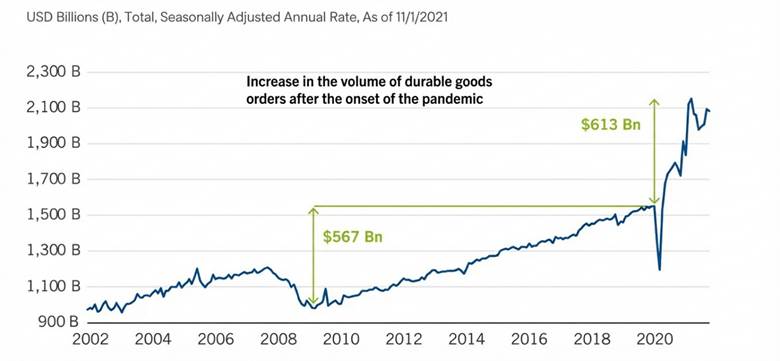
This surge in durable goods purchases came from large government stimulus, supply-shock support, and efforts to protect household income. For example, US government spending rose to levels not seen since World War II, boosting disposable income and demand.
The chart below shows durable goods prices versus services prices, highlighting the sharp pandemic-year jump versus prior years.
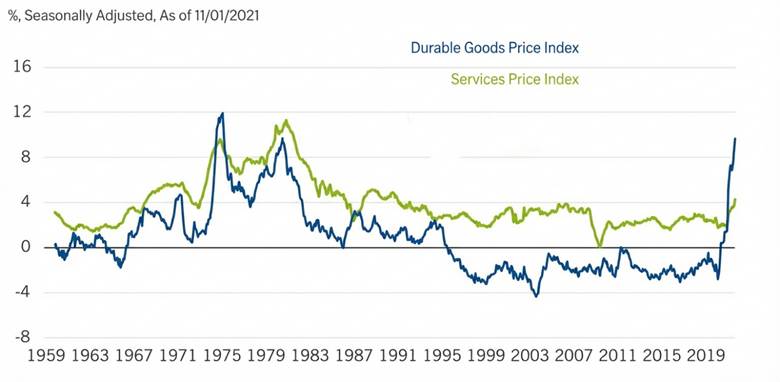
Labour shortages and transport limits created a supply shock that stressed the supply chain. The supply chain builds inventories around predictable demand growth, so it could not respond quickly. These pressures helped drive higher inflation in durable goods prices.
As a result, consumer durable goods inflation rose from a typical minus two percent trend over 20 years. It reached about 10 percent by the end of 2021. This durable goods inflation, plus rising food and energy prices, explained much of the global inflation surge. It helped push inflation to the highest levels seen in decades.
Why Durable Goods Orders Matter
The US Census Bureau states on its website:
When the economy shows signs of improvement, businesses and consumers usually gain enough confidence to order durable goods. Durable goods include factory-made products such as cars and dishwashers.
This is why Durable Goods Orders matter as a leading indicator. A Durable Goods Orders report showing rising orders can signal an upward economic trend. The indicator also provides timely, broad monthly statistics on domestic US manufacturing economic conditions.
Conclusion
Durable goods last over three years and preserve value, so buyers effectively keep capital tied to long-lived assets longer. Because these items are expensive, households and firms buy them when they feel confident and financially secure. Rising durable goods sales can support GDP by boosting factory activity and overall production. For this reason, investors closely track Durable Goods Orders as a demand measure and a signal of manufacturing momentum. The US Census Bureau has published this indicator monthly since 1957.


