


In the noisy, fast-paced world of financial markets, one question constantly occupies every trader’s mind: “Where should I exit?”
This seemingly simple question draws the fine line between a profitable trade and a painful loss. Mastering the art of answering it is what truly separates a skilled analyst from a professional trader.
The key to this challenge lies in mastering TradingView’sTargeting Tool; a feature that proves this platform is not just a charting software, but a complete toolbox for crafting precise and strategic exit plans.
In this article from Aron Groups, we’ll discuss how to set target and stop loss in TradingView. Together, we’ll explore the professional-grade tools inside TradingView that empower you to set highly accurate price targets, optimize your risk-reward ratio, and trade with the precision of seasoned market experts.

- The most powerful targets are where the signal from a Targeting Tool indicator aligns with another significant level (such as an essential trendline or a Fibonacci level).
- The market is a living, breathing entity that is constantly changing. Fixed take-profit and stop-loss levels may cause you to exit a trade prematurely or increase your risk during volatile conditions.
- Before you even enter a trade, you must answer three key questions:
Where is my entry point?, Where is my stop loss?, Where are my target(s)?
What is a Target and Why Should It Be Defined?
According to Mondfx, a target or price target is part of a trading management plan that determines the price at which you intend to exit a position (usually to take profit and close all or part of the position). In other words, the target is the Take Profit level, which is set based on technical and fundamental analysis and trading strategies.
Why is Defining a Target Important?
Defining a target in trading is crucial because:
- Without setting a target, trading becomes a form of gambling. When you have a target, you can calculate your risk-to-reward ratio (for example, if your stop loss is 50 pips and your target is 100 pips, then R:R = 1:2). This helps make your trading system more structured.
- Having a predefined target ensures that you don’t make emotional decisions in the heat of the moment and that you act strictly according to your trading plan.
- Defining a target and using the Targeting Tool in TradingView and other trading platforms makes it easier to manage your trades in a more visual and simplified manner.
Types of Targeting in Trading
Although the word target typically evokes the idea of reaching a specific price and profit goal, as we discussed earlier, there are other variables beyond price that play a role in defining a target. In this section, we will explore the different types of targeting in trading.
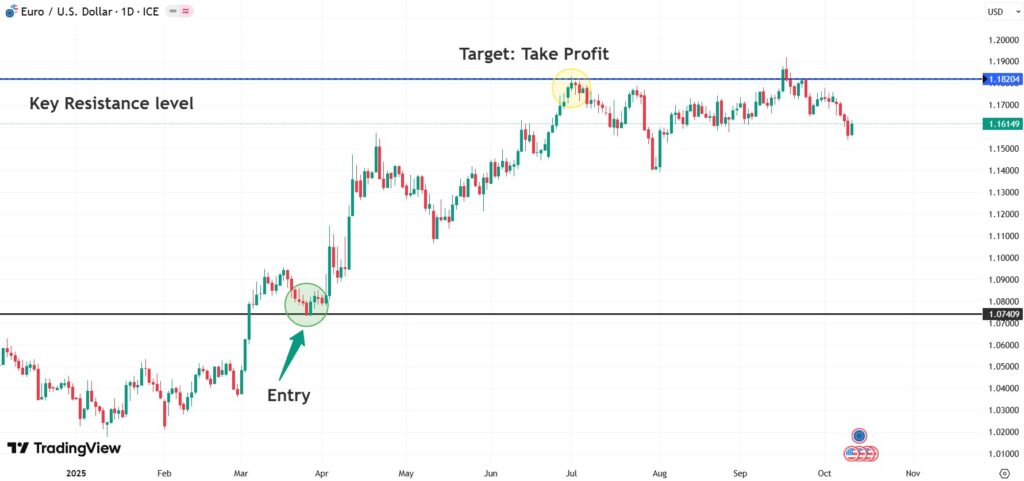
Price Targeting
Price targeting is the simplest and most common type of targeting. This involves selecting a specific price level as your target based on technical analysis (such as using support and resistance levels, classic chart patterns, Fibonacci tools, price action, etc.).
Some price-based targeting tools in TradingView include:
- Using the Horizontal Line tool or the Price Level tool.
- Using a script that draws the target level for you.
Setting up an Alert in TradingView for that price level, so you are notified when the price reaches it.
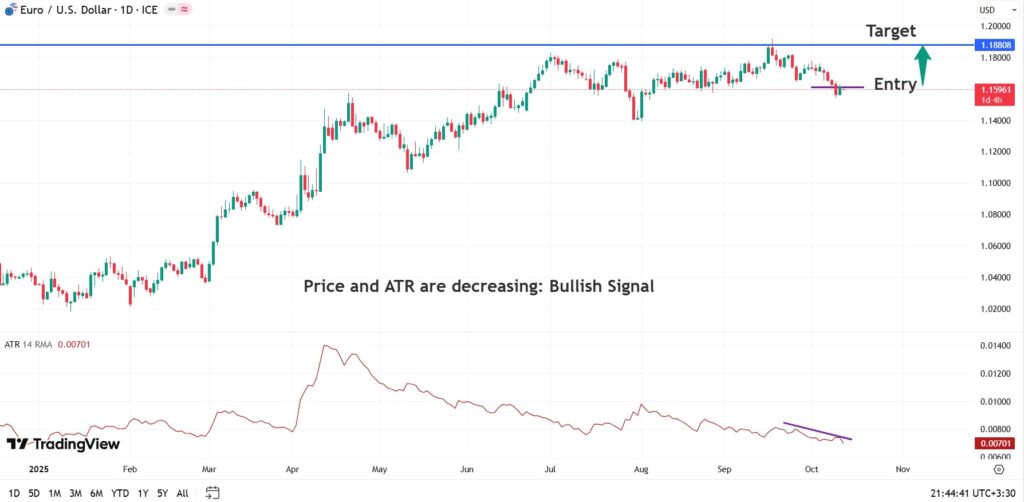
Volatility-Based Targeting
In volatility-based targeting, instead of using a fixed price, the target distance is determined based on recent market volatility. This approach is particularly effective in markets with highly variable volatility (such as cryptocurrencies).
How does it work?
To implement this, the Average True Range (ATR) indicator is commonly used. The ATR measures the average market volatility over a specific period. For example, if the ATR is 0.50 and you’ve entered a long position, you can set your target at 2 or 3 times the ATR (i.e., 1.00 or 1.50 dollars) above your entry point. This ensures that your target is in line with the current market conditions, giving you more realistic goals in calmer markets.
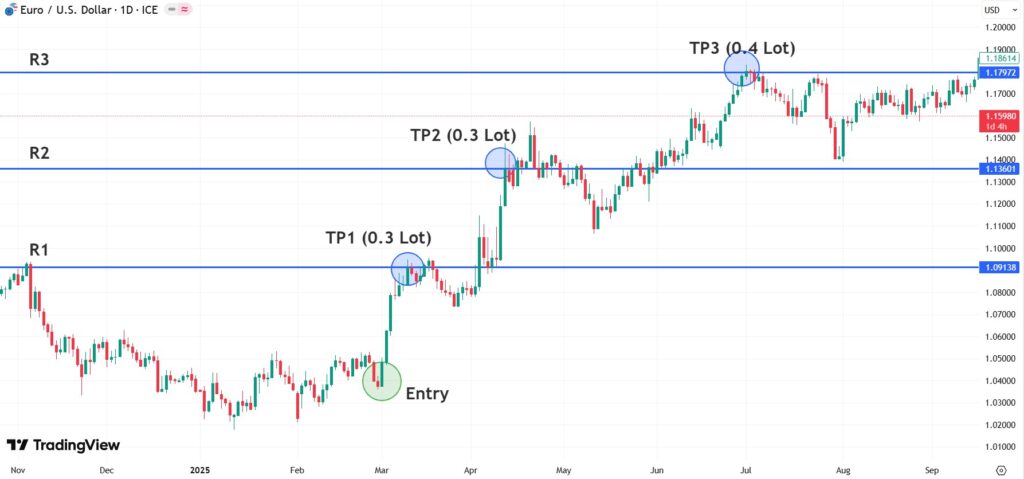
Multi-Stage Targeting
Multi-stage targeting is an advanced and professional strategy for profit management. In this approach, instead of closing the entire trade at one price point, you take your profits in several stages (step-by-step).
How does it work?
Let’s assume you are in a buy trade with a position size of one lot. You can set three targets (T1, T2, T3):
- Target 1 (T1): Close part of the trade (for example, 30% or 0.3 lots) and move the stop loss of the remaining position to the entry point. This makes your trade risk-free and guarantees part of your profit.
- Target 2 (T2): Close another portion of the trade (for example, 30% more).
- Target 3 (T3): Close the remaining portion of the trade (40%) or let it run with a Trailing Stop to take full advantage of major market moves.
Time-Based Targeting
Sometimes the reason for entering a trade is based on a time prediction. In these cases, if the price does not reach the target within a specific time frame, the validity of your analysis comes into question.
How does it work?
In this type of targeting, you set an “expiration time” for your analysis. If the trade does not reach the price target before this time, you exit the trade (even with a small profit or a slight loss).
Practical example:
You identify an Ascending Triangle pattern on a 4-hour time frame. Your analysis is that if the price breaks out from this triangle, it should reach the target within the next 24 hours. You enter the trade and set the price target, but you also add a time condition: “If the price has not reached the target after 24 hours, I will exit the trade.” This prevents your capital from being stuck in trades that are moving too slowly.
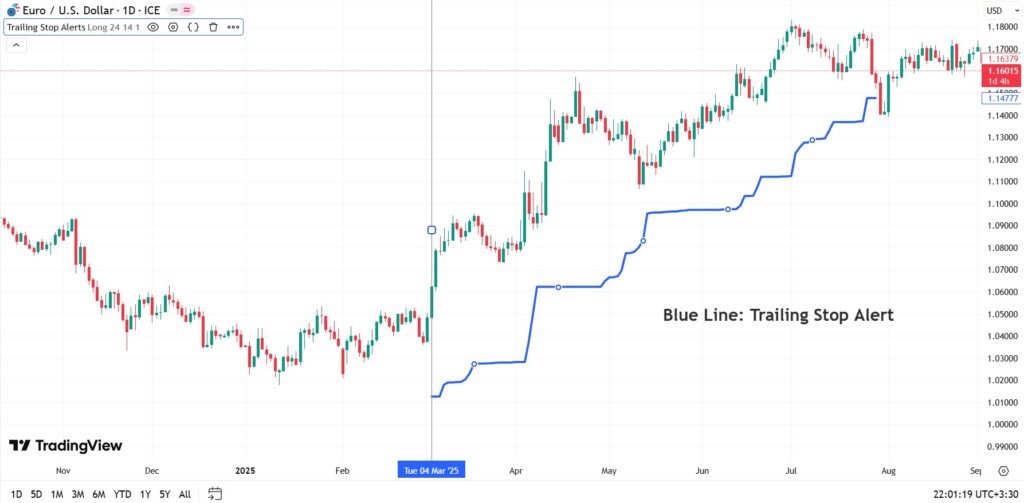
Dynamic Targeting Based on Market Behavior
This method is ideal for traders looking to capture large trends. Here, the target is not a fixed point but changes dynamically with the price movement.
How does it work?
The main tool in this strategy is the trailing stop. You set an initial stop loss, but instead of a fixed target, you allow the trade to move in your favor. Whenever the price moves a step in your favor, the stop loss moves by the same amount. This continues until the price moves against you and hits the trailing stop. Essentially, in this approach, your stop loss is your dynamic target.
In TradingView, if you’re using a broker integrated with the platform, you can directly use the trailing stop within the trading panel. Otherwise, you can manually adjust your stop loss based on market structure (for example, below recent price lows in an uptrend).

Combining price targeting with a focus on market volatility (using ATR) or employing a multi-stage strategy for better profit management can significantly enhance your results.
What is the Targeting Tool in TradingView and How is it Used?
The Targeting Tool in TradingView refers to a set of analytical and drawing tools that help traders define potential price targets (take profit or target levels) accurately based on technical principles. These tools go beyond simple guesswork; they function based on mathematics, price structure, and market behavior patterns.
The primary applications of these tools can be summarized in three key areas:
- Creating Trading Discipline: By setting a target in advance, you prevent emotional decision-making in the moment (such as greed for higher profits or fear of missing out on gains).
- Risk and Reward Management: These tools allow you to calculate your risk-to-reward ratio before entering a trade, ensuring that your trade is economically justified.
- Clarifying Analysis: Plotting a target on the chart makes your analysis more tangible and provides a clear, visual representation of your trading plan.
Types of Targeting Tools in TradingView
TradingView offers a variety of tools for this purpose, each suitable for a specific analytical style. Below, we explore the most commonly used ones.
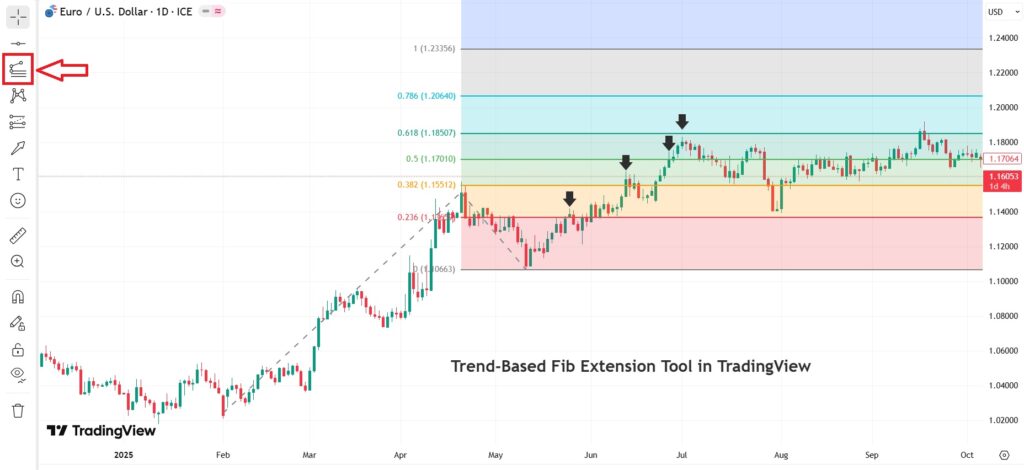
Fibonacci Extension Tool (Trend-Based Fib Extension) for Price Targeting
The Trend-Based Fib Extension tool is one of the most popular and powerful tools for identifying price targets within a trend, which is a key part of understanding how to set target and stop loss in tradingview. Based on the Fibonacci golden ratios, this tool predicts potential end points for a price wave.
How does it work?
To use this tool, you need three key points:
- Starting point of the wave (A): The beginning of an upward or downward movement.
- End point of the wave (B): The peak or top of the price movement.
- End point of the correction (C): The end of the corrective wave that follows the AB move.
By clicking on point A, then B, and finally C, the tool automatically plots Fibonacci extension levels (such as 127.2%, 161.8%, and 261.8%) along the trend. These levels represent potential targets where the price may encounter a reversal.
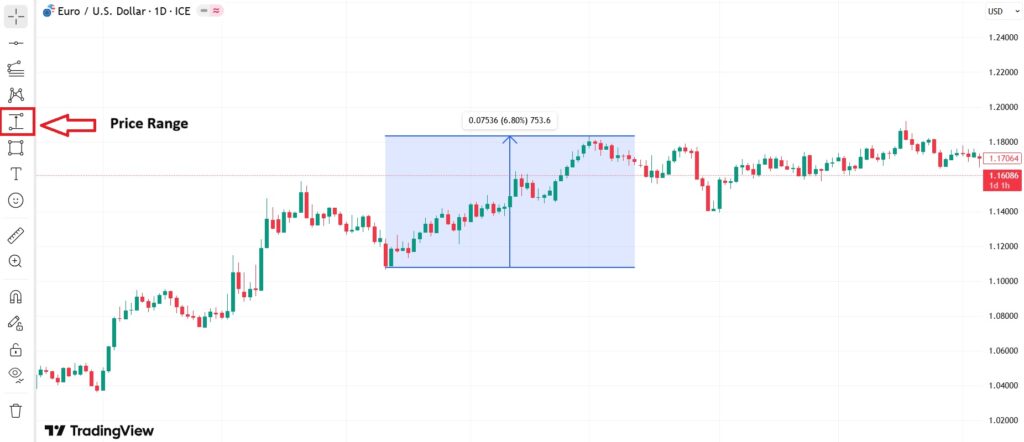
Price Range Tool and Prediction & Measurement Tools for Price Targeting
Sometimes, the simplest methods yield the best results. The tools found in the fifth icon in the left toolbar of TradingView are Prediction & Measurement Tools, which are ideal for quickly and easily measuring price distance.
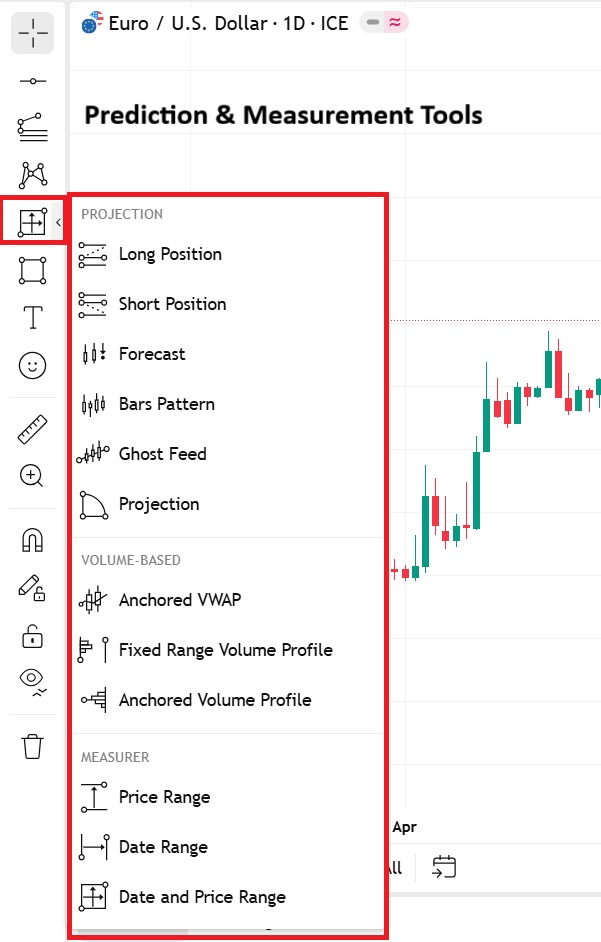
A target-setting tool in TradingView is Price Range, located in the fifth icon on the left toolbar. With this tool, you can precisely measure the distance between two price levels by drawing a vertical line. This is particularly useful for calculating potential profit or measuring the size of a price pattern.
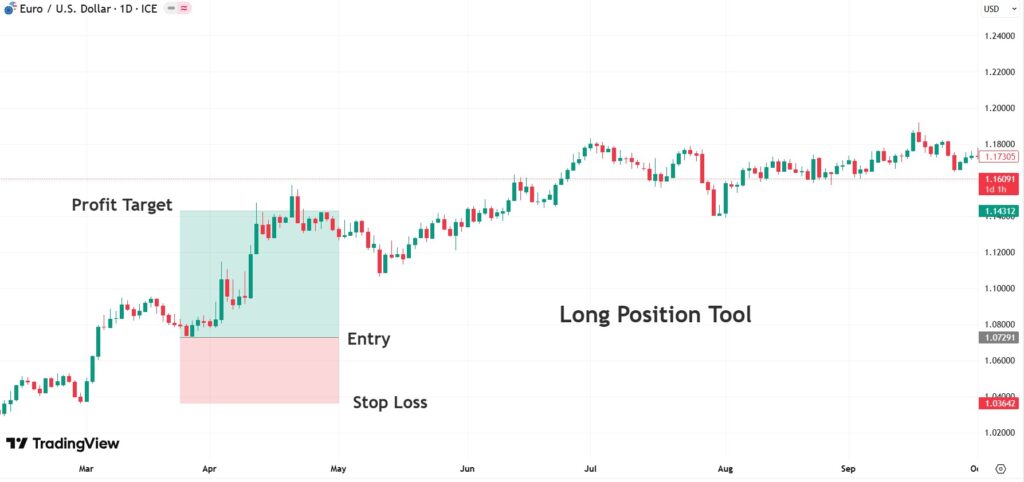
Long Position Tool for Setting Targets, Stop Loss, and Risk-Reward Ratio in Buy Trades
One of the most commonly used target-setting tools in TradingView for planning buy trades is the Long Position tool. This tool visually and automatically calculates and displays all the key parameters of a buy trade.
How to Use the Long Position Tool?
According to TradingView, the steps to use the Long Position tool are as follows:
In the left toolbar, click on the fifth icon and select Long Position.
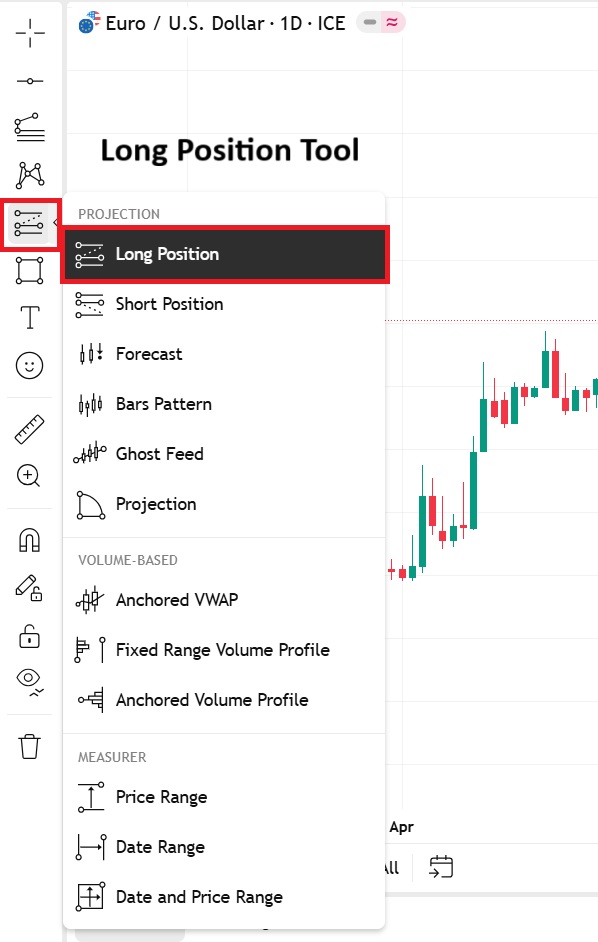
- After selecting the tool, navigate to the point where you plan to enter the buy trade (Entry) and click.
- The first click will set your entry point. Now, drag the mouse downward until you reach the level you’ve set as your stop loss and click.
- Finally, drag the mouse upward from the entry point to reach the target or take profit level, then click once more.
Short Position Tool for Setting Targets, Stop Loss, and Risk-to-Reward Ratio in Sell Trades
As the name suggests, this tool is specifically designed for short position trades. In a short trade, we enter at a higher price, expecting the price to drop. Therefore, our stop loss will be set above the entry point, and the target will be placed below it. The Short Position Tool is specifically built for this scenario, simplifying how to set target and stop loss in tradingview for short trades.
How to Use the Short Position Tool
To use this tool, follow these steps:
- Select the Short Position tool from the fifth icon in the left toolbar.
- Click on the entry point for your sell trade.
- Drag the mouse upwards to set your stop loss at a higher level.
- Then, drag the mouse downward to set the target at the desired level and click.
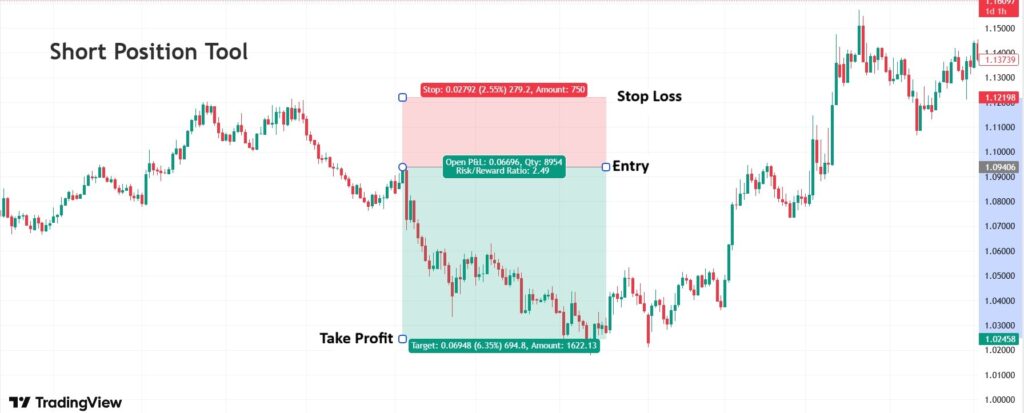
Long Position and Short Position Tools Automatically Calculate Key Information Including Risk-to-Reward Ratio, Profit and Loss (in Dollar and Percentage), and Display Them Clearly on the Chart.
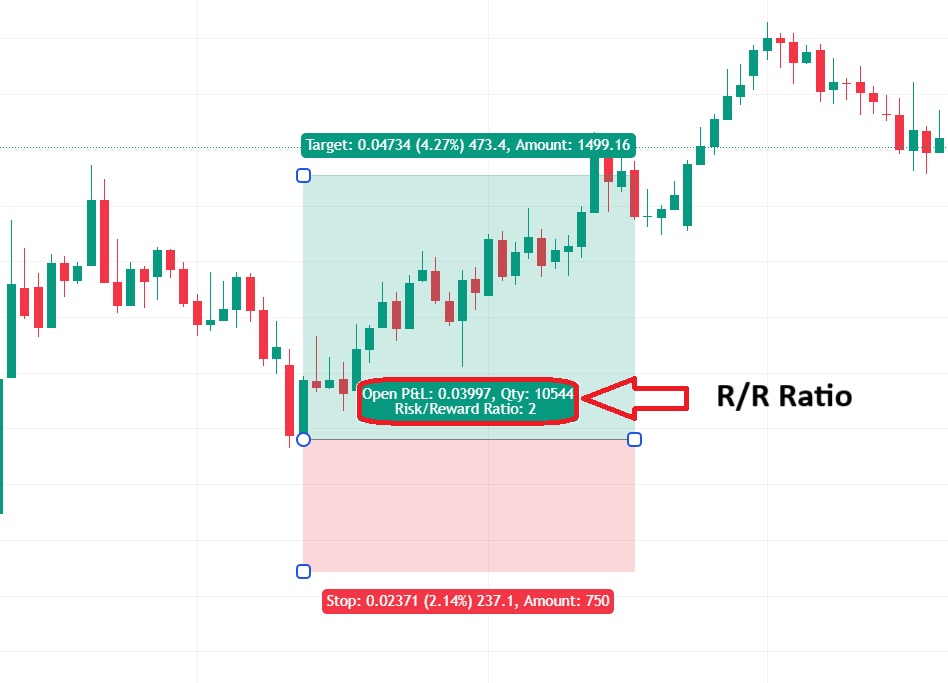
Risk-to-Reward Ratio Tool for Targeting in TradingView
One of the most powerful and simple tools in TradingView is the tool that determines the profit and loss levels, automatically calculating the risk-to-reward ratio for you. This tool helps you fully understand the potential profitability of the trade relative to its risk before clicking the buy or sell button.
Professional traders typically seek trades with a risk-to-reward ratio of 1:2 or higher.
How to Use This Tool?
Follow these steps to easily set your targets based on the risk-to-reward ratio:
- Open the desired chart.
- From the left toolbar, select either “Long Position” (for buy trades) or “Short Position” (for sell trades).
- For a buy trade (Long), click on the entry point, and the red and green boxes will automatically appear.
By default, the risk-to-reward ratio is set to 1:1. To achieve your ideal profit target, drag the mouse upwards for a buy trade and downwards for a sell trade.
Professional Targeting Indicators in TradingView
Targeting is not just about choosing a number to exit a trade; it’s a strategic process that combines technical analysis, risk management, and market psychology. The professional indicators introduced in this article are specifically designed for this purpose: they help you identify your price targets with more accuracy and reliability while managing your risk dynamically and intelligently.
To use these indicators, simply click on the “Indicators” menu at the top of TradingView, search for the desired indicator, and add it to your chart.
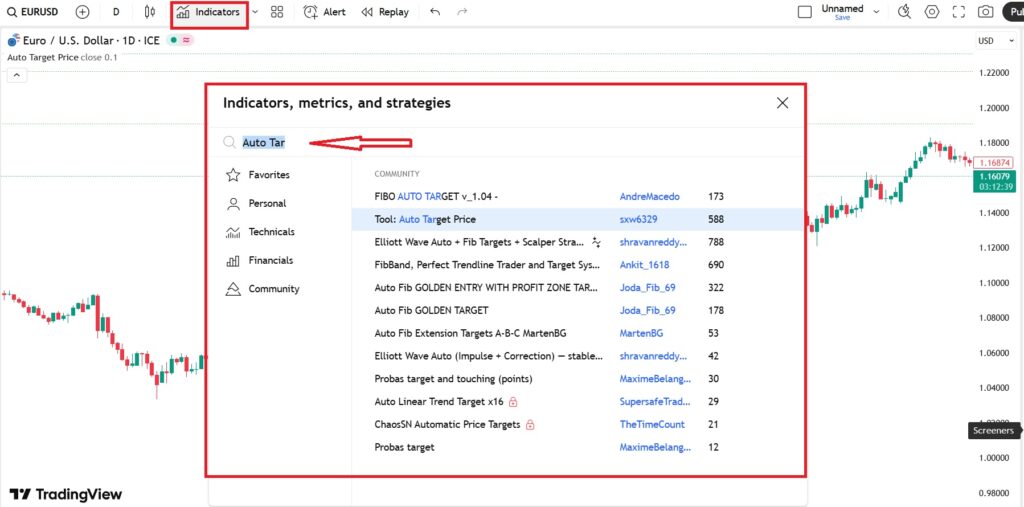
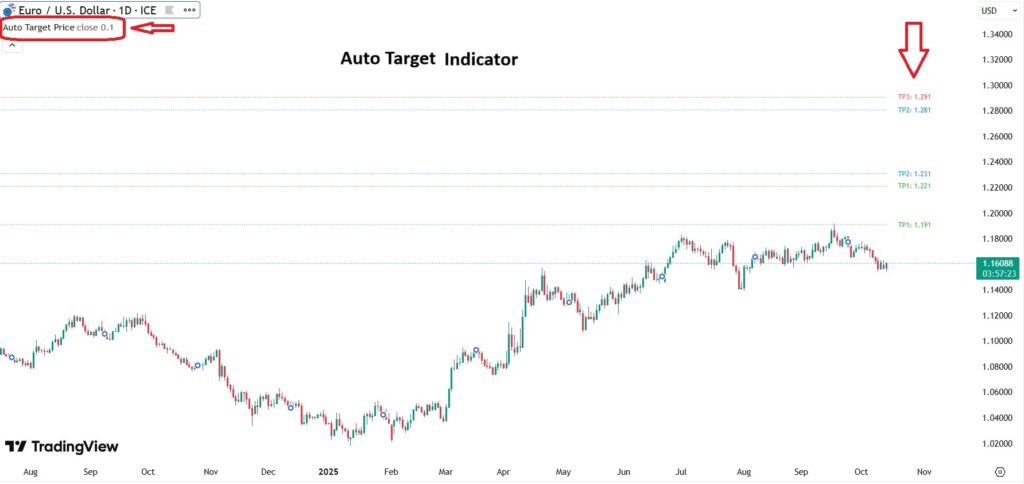
Auto Target Indicator
The Auto Target indicator is a tool in TradingView that automatically plots multiple potential price targets (usually TP1, TP2, TP3) on the chart. It typically uses advanced tools such as Fibonacci retracement and extension levels or identifies key swing highs and swing lows.
Why is this indicator useful?
- Time-saving: No need to manually draw complex tools.
- Objectivity in analysis: This indicator operates based on specific mathematical formulas, removing emotions from the analysis process.
- Identification of multiple targets: It allows you to set different targets for different portions of your trade (e.g., closing half of the trade at TP1 and waiting for TP2).
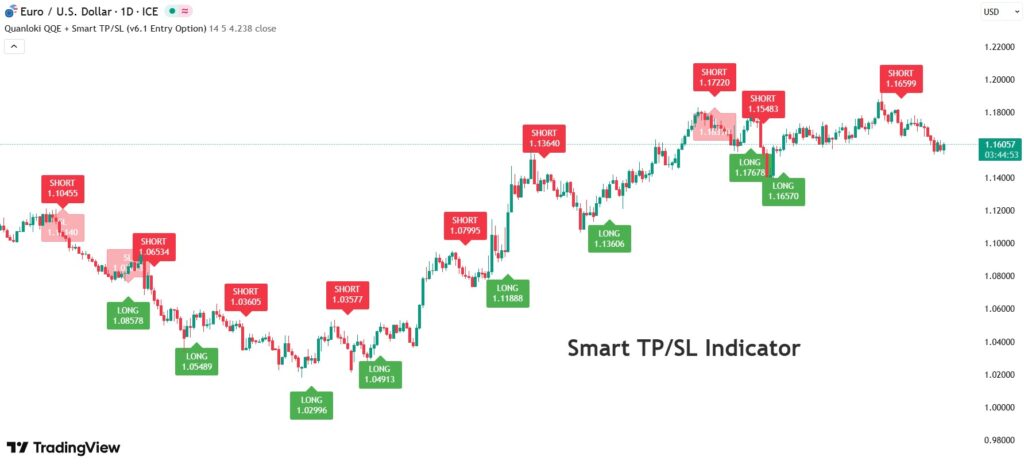
Smart TP/SL Indicator
The Quanloki QQE + Smart TP/SL indicator is a highly popular and combined tool in TradingView that simultaneously performs two key functions for the trader:
- Identifying trade entry signals.
- Smartly setting Take Profit (TP) and Stop Loss (SL) levels.
This indicator is an efficient tool for traders focused on how to set target and stop loss in TradingView, as it allows them to combine analysis and risk management in real-time.
Some common features of this indicator include:
- Integration of analysis and execution: No need to use multiple separate tools for signal generation and setting TP and SL.
- Noise reduction: QQE signals, due to strong filtering, prevent many false signals.
- Objective risk management: TP and SL are determined based on a specific algorithm, preventing emotional decision-making.
- Simplicity and speed: Especially for beginner traders, this indicator significantly simplifies the analysis process.
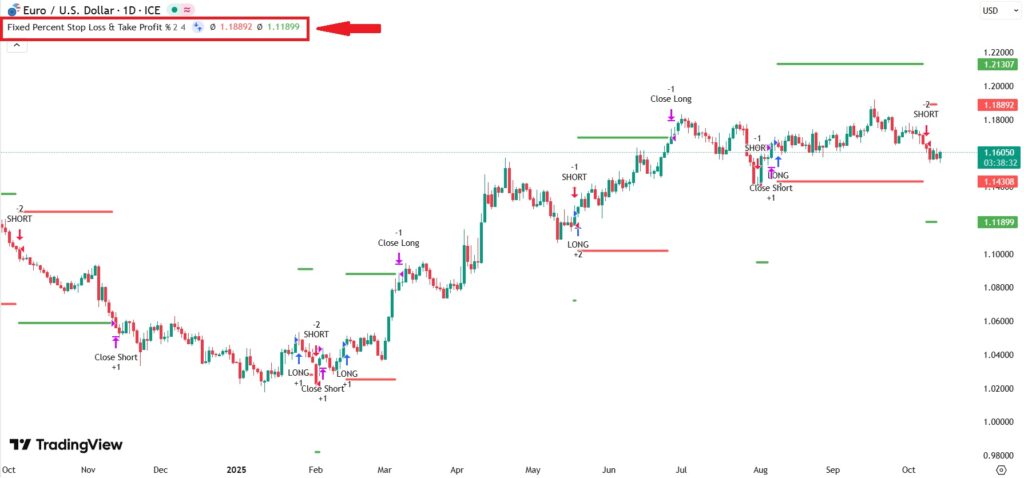
Fixed Percent Stop Loss & Take Profit Indicator
Simplicity is the key to success for many traders. The Fixed Percent Stop Loss & Take Profit indicator is designed for those who follow a risk management rule based on a fixed percentage. For example, you may decide that you will not risk more than 2% per trade and aim for a minimum profit of 4%.
This indicator allows you to input these percentages in the settings, and as soon as you specify your entry point, the take profit and stop loss lines are automatically drawn on the chart. This tool ensures that you always adhere to your capital management principles.
Advantages of this approach
- Easy discipline: Following a fixed percentage rule enhances trading discipline.
- Speed: It’s highly practical for quick trade entries, especially in fast-paced markets.
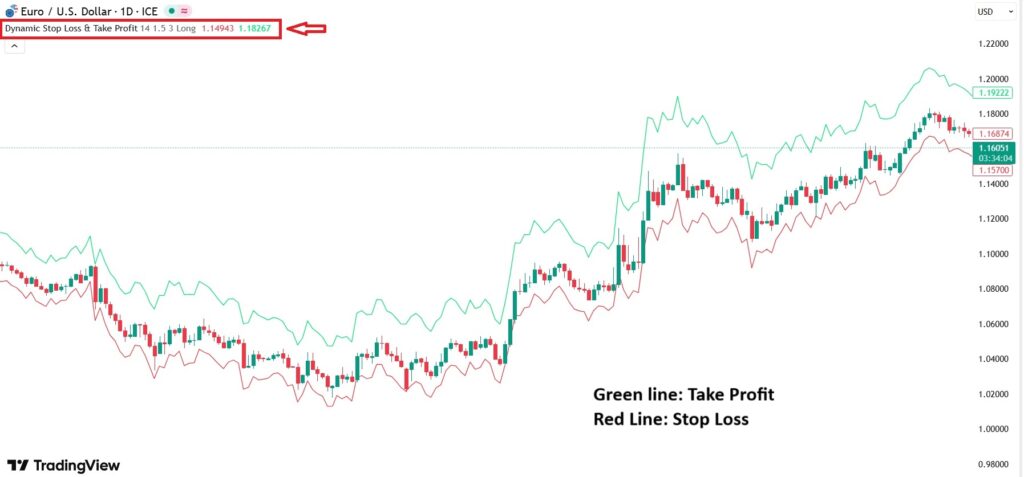
Dynamic Stop Loss & Take Profit Indicator
Unlike the previous indicator that used fixed percentages, the Dynamic Stop Loss & Take Profit indicator is a target-setting tool with an intelligent and adaptable approach. Financial markets are not always in the same state; sometimes they are calm and low-volatility, while other times they are extremely turbulent and unstable. Using a fixed stop loss in both conditions can be disastrous.
The Dynamic Stop Loss & Take Profit indicator typically uses volatility indicators, such as the Average True Range (ATR), to calculate the take profit and stop loss levels. For instance, the stop loss might be set at two times the ATR value. This means:
- In high-volatility markets: Your stop loss is placed further away to avoid being stopped out due to random fluctuations.
- In low-volatility markets: Your stop loss is placed closer to minimize risk.
This method is one of the most professional and logical ways to manage risk, allowing traders to better align with market behavior.
For more information about the Targeting Indicator in TradingView and to receive the targeting scripts, click here.
Difference Between Free and Paid Indicators for Target Setting in TradingView
For traders learning how to set target and stop loss in TradingView, choosing between free and paid indicators is a strategic decision that directly impacts the accuracy of your analysis and performance. This choice goes beyond cost and depends on your philosophy and level of expertise.
Free indicators serve as the cornerstone of learning and flexibility. They provide unlimited access for experimentation and many are open-source, allowing you to deeply understand their workings and even customize them. These tools are ideal for beginners and traders looking to learn the fundamentals of analysis, including how to set target and stop loss in TradingView. Their main limitations include simpler algorithms, lack of expert support, and limited features.
In contrast, paid indicators are specialized and efficient systems designed to address specific problems. These tools are the result of months of research and development, utilizing advanced algorithms to filter noise and generate more precise signals. Full support, regular updates, and unique features like backtesting are some of their key advantages. These indicators are a smart investment for experienced traders who have developed their trading strategy and are now seeking more precise answers on how to set target and stop loss in TradingView to optimize their performance.
| Feature | Free Indicators | Paid Indicators |
|---|---|---|
| Cost | Completely free | Purchase or monthly subscription fee |
| Algorithm Complexity | Usually simpler and based on classic formulas | Advanced, optimized algorithms |
| Code Source | Often open-source and visible | Usually "Black Box" and not visible |
| Support and Updates | Limited, relying on community and user feedback | Full support and regular updates from developers |
| Advanced Features | Limited (simple alerts, no integrated backtesting) | Complete (smart alerts, internal backtesting, management panels) |
| Best For | Beginners, learning the fundamentals, building basic strategies | Experienced traders, strategy optimization, solving specific problems |
Note: Start with free tools, learn, and build your strategy. Then, if you reach a point where you face a specific challenge in your strategy, a paid indicator can be your specialized solution.
Conclusion
Our journey in the world of target-setting tools on TradingView concludes with an undeniable truth: success in trading is a combination of science and art. We started with basic risk-to-reward tools, moved on to target-setting indicators, and examined the strategic differences between free and paid tools. But the key takeaway that must be remembered throughout all these stages is that these tools are more than just price calculators; they are the controllers of your emotions. They act as a solid shield against greed and fear, allowing you to trade based on a plan and logic.
Mastering these tools does not mean becoming a robot trader; rather, it means evolving into a disciplined, aware, and strategic trader.


