icon icon Home
icon icon Accounts
icon icon Quick start
icon icon Symbols

Everything You Need to Know About the ISM PMI and Its Key Role in Financial Markets

Author
Abe Cofnas
Abe Cofnas
calendar Last update: 4 November 2025
watch Reading time: 17 min

If you want to feel the pulse of the U.S. economy before anyone else, you need to look at the ISM PMI index.This monthly indicator surveys purchasing managers with a simple question—are conditions improving or worsening? The responses provide an early signal of whether economic growth is on the horizon or if a slowdown or recession is looming.

From the direction of the U.S. dollar and gold to movements in bond yields and equities, many market actions originate from this single figure. In this article, we will explore the ISM PMI index by defining it, breaking down its components, reviewing its release schedule, and—most importantly—explaining how traders and investors can use it effectively in their decision-making.

bookmark
Key Points:
  • The ISM PMI index indicates the direction of the economy, not the magnitude. To gauge the strength of the trend, read the index number alongside new orders and prices paid.
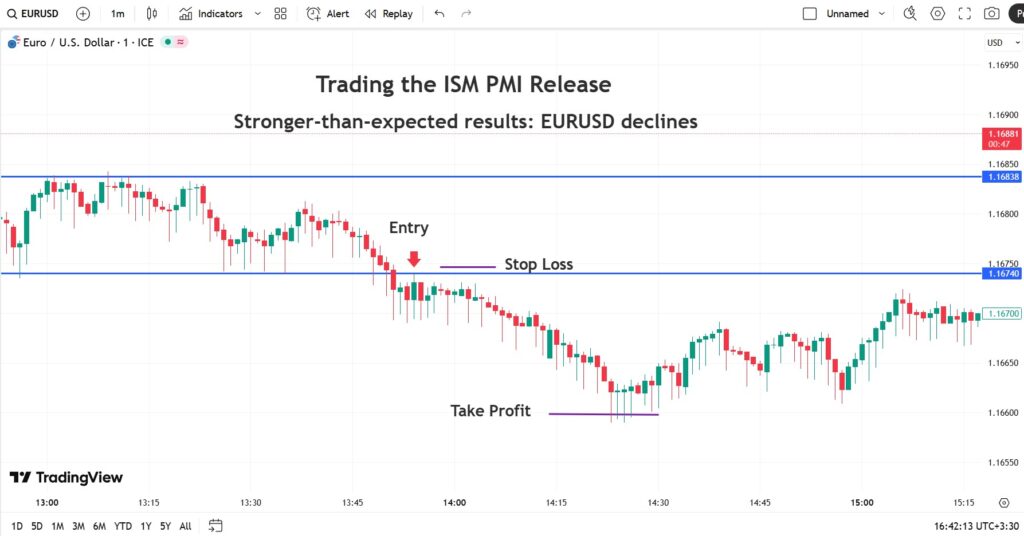
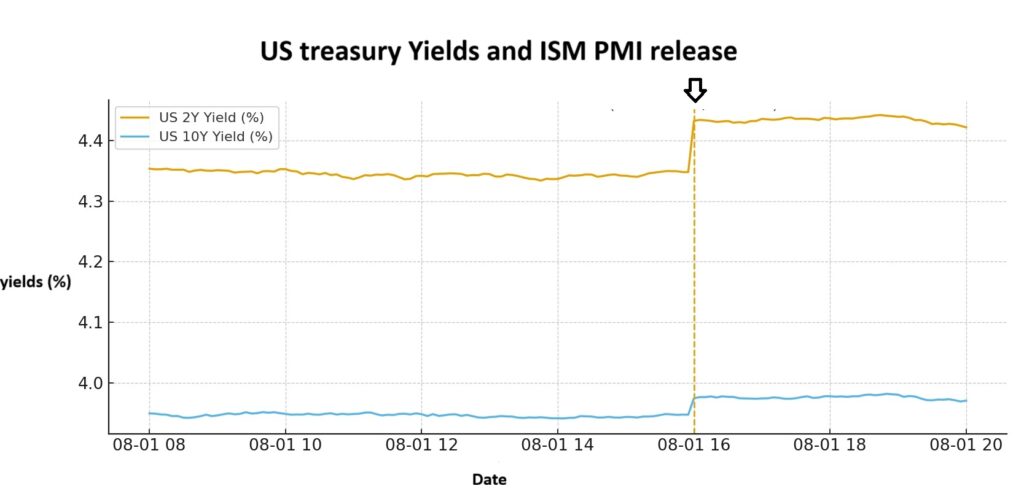
  • Positive or negative ISM PMI surprises are immediately reflected in the U.S. dollar, 2-year and 10-year Treasury yields, gold, and oil, but the sustainability of the move depends on the combination of the report’s components.
  • In the long-term horizon, the 3–6 month PMI trend serves as a guide for rotations between cyclical and non-cyclical sectors, helping to optimize portfolio weighting.

What Is the ISM PMI Index?

The ISM PMI index is one of the most significant and reputable economic indicators in global financial markets. It is published by the Institute for Supply Management (ISM) in the United States. This index is compiled monthly through surveys of purchasing managers from large and medium-sized companies across various sectors of the U.S. economy. It reflects the overall status of economic activity, including production, new orders, employment, and inventory levels.

Simply put, the index indicates whether businesses are expanding or contracting. Purchasing managers are at the frontline of the supply chain, observing changes in orders, production, or market conditions earlier than other sectors. For this reason, their data is considered one of the most leading indicators for forecasting the direction of the economy.

sms-star

Each month, the ISM PMI surveys purchasing managers, asking whether they believe conditions have improved, worsened, or remained the same compared to the previous month. The results are then published as a numerical value ranging from 0 to 100:

  • Above 50 = Expansion of activity compared to the previous month
  • Below 50 = Contraction or slowdown of activity compared to the previous month

ISM PMI Index – Main Categories

The ISM PMI is published in two primary sections:

  • Manufacturing PMI:
    The ISM Manufacturing PMI measures the activity within U.S. factories, industries, and the manufacturing sector. It specifically focuses on new orders, production levels, supplier deliveries, inventory levels, and employment.
  • Non-Manufacturing (Services) PMI:
    The ISM Non-Manufacturing PMI, also referred to as the Services PMI, assesses the performance of the U.S. services and non-manufacturing sector—a segment that constitutes over 80% of the U.S. economy.
sms-star

While 50 marks the boundary between expansion and contraction in the manufacturing sector, the ISM notes that a PMI reading above roughly 42.3 (over a period of time) has historically correlated with overall economic growth (GDP). In other words, manufacturing may experience mild contraction, yet the broader economy can still be expanding.

Components of the ISM PMI

The ISM Manufacturing PMI is composed of five equally weighted sub-indices, each accounting for 20%:

  • New Orders;
  • Production;
  • Employment;
  • Supplier Deliveries;
  • Inventories.

New Orders


New Orders reflect the pulse of demand within manufacturing plants. An increase in new orders typically triggers a chain reaction of growth in production, employment, and inventory levels, while a decline often serves as the first signal of a cooling economic cycle. Traders rely on this sub-index to forecast the direction of PMI in the coming months and to gauge the momentum of the manufacturing sector.

Production


The Production component measures the actual output from factory production lines. When production rises in alignment with new orders, it indicates that manufacturers are ramping up activity to meet market demand. Conversely, divergence—such as high production alongside declining new orders—usually signals a potential slowdown in production in the months ahead.

sms-star

The alignment between production and new orders indicates a healthy economic cycle, while a divergence between them can signal opportunities for mean-reversion strategies in commodities and industrial stocks.

Employment

The employment component of the ISM PMI reflects hiring plans and workforce adjustments within industrial firms. According to Investopedia, the monthly employment report for the services sector indicates whether employment has increased or decreased compared to previous months. Beyond tracking employment trends, this report also measures labor shortages in the market—that is, whether purchasing and supply managers have been able to fill open positions with qualified candidates.

When job vacancies exceed the number of available workers, it generally signals a healthy, expanding economy, though it may also indicate potential upward pressure on inflation. Conversely, if the labor supply outpaces job openings, this can be a warning sign of slowing economic growth and a possible rise in unemployment.

sms-star

Declining Employment in the ISM Manufacturing PMI Often Precedes Broader Labor Data Weakness and Can Shift Monetary Policy Expectations.

Supplier Deliveries

 This sub-index is interpreted inversely:

  • A higher number = slower deliveries (greater delays).

During periods of capacity constraints or supply shocks, an increase in this component can keep the ISM PMI in expansion territory, even if overall demand has softened. Therefore, when analyzing the business cycle, it is essential to consider Supplier Deliveries alongside Prices Paid and New Orders to determine whether growth in the sub-index stems from rising demand or from supply limitations.

sms-star

A sharp rise in Supplier Deliveries, when accompanied by an increase in Prices Paid, often signals inflationary pressure within the supply chain.

In the chart below, the correlation between supplier delivery times and inflation can be clearly observed:

ISM PMI

Inventories

 Inventory levels provide a window into how goods are managed within factories. High inventory levels combined with weak new orders may indicate unwanted stockpiling, a potential decline in future production, and even downward pressure on input prices.

Conversely, low inventories alongside strong orders are often associated with longer supplier delivery times and rising prices paid, which can contribute to higher ISM PMI readings in the following months.

Overall, the gap between new orders and inventories is one of the most popular ratios used to gauge future PMI momentum.

sms-star

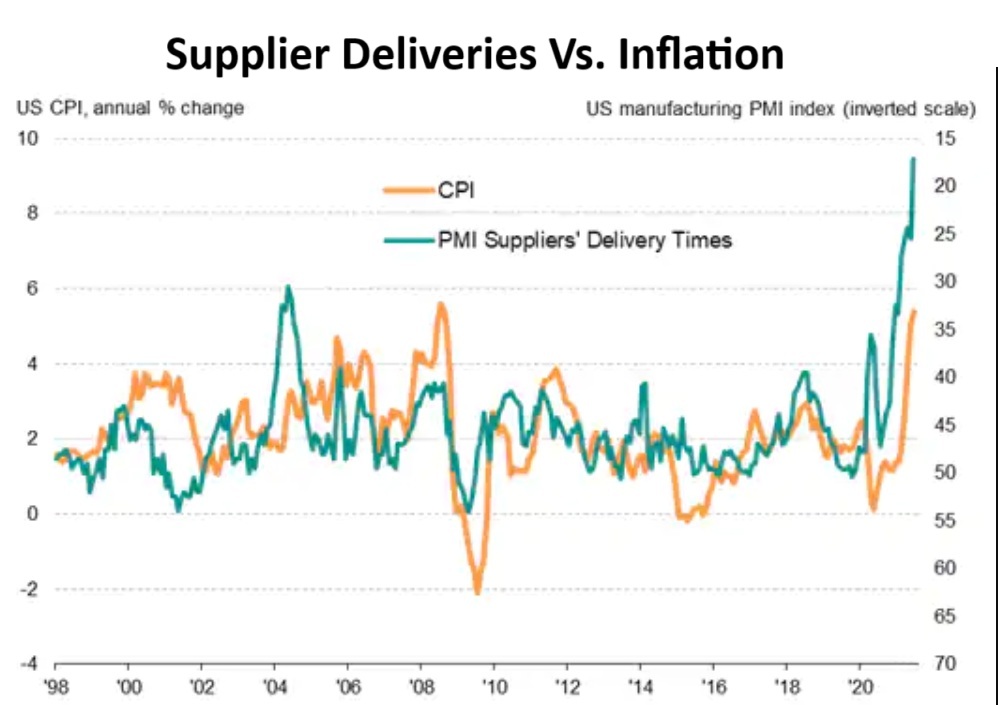
According to Economy.com, a rise in new orders combined with low inventory levels typically signals upcoming production pressure and higher input costs. The result of this combination is an increased risk of inflation, a stronger U.S. dollar, and higher bond yields.

Why the ISM PMI Index Matters

The ISM manufacturing and services PMIs are among the most reputable leading indicators of business conditions in the U.S. economy. The ISM PMI provides a rapid snapshot of expansion or contraction in economic activity. For this reason, economists, monetary policymakers, portfolio managers, and traders rely on it to gauge short-term trends and shape strategic decisions.

Direct Link Between ISM PMI and U.S. Economic Growth or Recession

Since the ISM PMI is constructed with equal weighting from key components—new orders, production, employment, supplier deliveries, and inventories—it often signals economic direction earlier than slower official statistics such as GDP. If the ISM PMI remains below 50 for several months, it indicates weak growth momentum; conversely, sustained readings above 50 signal expanding activity.

Impact of ISM PMI Data on Inflation Expectations and Federal Reserve Policy

Detailed ISM PMI data, particularly the subindexes for prices paid and supplier deliveries, provide early insights into inflationary pressures, supply constraints, and labor shortages. Persistently high prices paid or prolonged supplier delivery times push markets to anticipate tighter monetary policy. Conversely, easing cost pressures can strengthen expectations of looser interest rates.

The Role of ISM PMI in Shaping Investor Confidence and Global Financial Markets

Given the United States’ weight in the global economy, ISM PMI data influence investor sentiment worldwide. Monthly releases of ISM reports, issued by an official authority with transparent methodology, make the index a reliable tool for analysts across equities, bonds, currencies, and commodities. It is a tool capable of redirecting capital flows and influencing whether the U.S. market diverges from or converges with other economies.

sms-star

The ISM Supply Management Planning Forecast is a reputable report that compiles insights from members of the ISM survey panel regarding business outlook over the next 6 to 8 months. It serves as a key source for analyzing supply chain trends and guiding business planning.

The Impact of the ISM PMI on Forex and Currency Markets

The ISM PMI often provides traders with an early signal of economic direction and the strength or weakness of the U.S. dollar, ahead of slower-moving indicators such as the Industrial Production Index or GDP.

sms-star

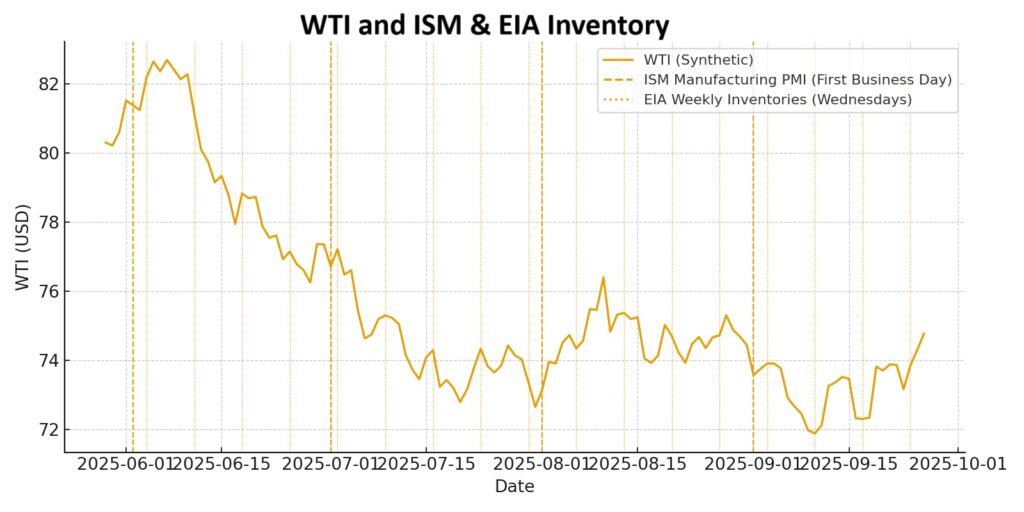
According to the official ISM calendar, the Manufacturing ISM PMI is released at 10:00 a.m. New York time on the first business day of each month. The Non-Manufacturing ISM PMI is published at 10:00 a.m. on the third business day of each month.

Reaction of Major Currency Pairs to ISM PMI Releases

The general market logic in response to ISM PMI data is as follows:
  • A stronger-than-expected PMI indicates increased economic activity and potential inflationary pressure, implying a higher likelihood of tighter monetary policy and a stronger U.S. dollar.
  • A weaker-than-expected PMI signals slowing momentum and lower price pressures, suggesting the possibility of looser monetary policy and a weaker dollar.
Accordingly, the reaction of major currency pairs to ISM PMI releases is typically:
  • EUR/USD and GBP/USD: Move inversely to the U.S. dollar. A strong PMI often triggers a decline in these pairs, while a weak PMI tends to boost them.
  • USD/JPY: Sensitive to interest rate differentials and Treasury yields. A strong PMI usually strengthens USD/JPY, and vice versa.
  • DXY (U.S. Dollar Index) and Gold (XAU/USD): React simultaneously in opposite directions. A stronger dollar generally puts pressure on gold, and a weaker dollar supports it.

Trading EUR/USD Using ISM PMI News

To trade EUR/USD during ISM PMI releases, follow these steps:
  • Check Market Consensus 15 Minutes Before the Release: Review the consensus forecast on an economic calendar. Investing.com is an excellent resource for seeing market expectations.
  • If the ISM Manufacturing PMI Comes in Significantly Above Consensus (e.g., 52 versus a forecast of 50): 
    • Expect a stronger U.S. dollar and a potential drop in EUR/USD.
    • Examine the EUR/USD chart on the 1- to 5-minute timeframe to identify a breakout of the pre-news range.
    • If one of the range boundaries before the news closes beyond the breakout level on the 1- or 5-minute chart, the breakout is considered valid.
    • After a pullback to the broken level, enter a short position.
    • Place the stop-loss just above/below the pre-news range high/low. 
  • If the U.S. Dollar Weakens (PMI below consensus), reverse the scenario and take a long position on EUR/USD.
  • Account for Slippage in Risk Management: Spreads widen sharply during news releases, so factor this into your position sizing and stop-loss levels.
ISM PMI
EventTypical Price EffectWhy It HappensQuick Trading Strategy
ISM PMI Above ForecastUSD strengthens; EUR/USD & GBP/USD fall, USD/JPY risesHigher activity and potential inflationary pressure; expectation of tighter monetary policy; rising yields and stronger dollarTrack pre-news range breakout; enter after pullback; stop-loss just beyond pre-news range high/low
ISM PMI Below ForecastUSD weakens; EUR/USD & GBP/USD rise, USD/JPY fallsSlower activity, lower price pressure; expectation of softer policy; falling yieldsTrade in the direction of the reverse breakout; account for spreads and slippage
Jump Due to Supplier DeliveriesShort-term USD reactionPMI increase driven by supply constraints rather than actual demandExamine report components: if “New Orders” is weak, avoid chasing the move
High Paid Prices SubindexBias toward stronger USDHigher inflation risk and faster anticipated rate pathBuy USD on pullbacks; monitor 2-/10-year yield alignment

Comparing the Impact of ISM PMI with Similar Economic Indicators

The ISM PMI stands out as one of the fastest and most forward-looking monthly indicators of the U.S. economy. It is directly derived from responses of purchasing managers, providing early signals on shifts in economic activity and interest rate expectations well before slower-moving data such as GDP and the Industrial Production Index.

In contrast, Industrial Production is a monthly, often contemporaneous or slightly lagging indicator published by the Federal Reserve. It measures output across manufacturing, mining, and energy sectors. While industrial production data is excellent for confirming PMI signals, it typically does not trigger the initial wave of volatility in the forex market.

GDP is a quarterly, lagging indicator that provides a reliable macroeconomic overview of growth. However, due to publication delays and subsequent revisions, GDP is less suitable for event-driven trading or real-time market reactions.

IndicatorPublishing Entity & FrequencyNature / Forward-LookingSpeed of Impact on ForexKey Limitation
ISM PMI (Manufacturing/Services)Institute for Supply Management (ISM), monthly, early monthForward-looking; headline figure derived from an equal-weighted average of subcomponents (Manufacturing: New Orders, Production, Employment, Supplier Deliveries, Inventories)Very fast; immediate reaction in USD, yields, and currency pairsHeadline jumps may reflect “slower deliveries” rather than actual demand; subcomponents should be checked
Industrial Production (IP)Federal Reserve (G.17), monthlyContemporaneous/slightly lagging; measures actual output in manufacturing, mining, and energy sectorsMedium; mostly used to confirm trendsSensitive to revisions and temporary shocks; reacts slower than PMI
GDPBureau of Economic Analysis (BEA), quarterlyLagging; comprehensive growth snapshot with subsequent revisionsSlow/irregular; shocks are infrequent but sometimes largeLong lag to publication and multiple revisions; unsuitable for real-time trading entries

ISM PMI and the U.S. Stock Market

The ISM PMI acts as the monthly heartbeat of U.S. business activity, and its release can immediately influence stock market direction.
  • When the final PMI reading exceeds expectations, the prevailing interpretation is that corporate profitability—particularly in cyclical sectors such as financials, industrials, and energy—has room to grow.
  • Simultaneously, if prices are elevated, markets may anticipate higher interest rates, which can weigh on growth-sensitive sectors like technology.
  • Conversely, a weaker-than-expected PMI typically signals a softer earnings outlook, reducing risk appetite among investors. 
Practical Example: Suppose the market consensus for the Services PMI is 50.8, but the actual figure is 52.2. In this scenario, industrial and financial indices generally outperform technology stocks, and Treasury yields tend to rise.

ISM PMI and Global Gold Prices

 Gold is highly sensitive to real interest rates and the strength of the U.S. dollar—both of which are influenced by market interpretation of PMI data.
  • A strong PMI usually suggests more robust economic growth and the potential for tighter monetary policy, resulting in a stronger dollar and higher real yields, which typically exert downward pressure on gold prices.
  • Conversely, a weak PMI can increase expectations for softer interest rates, supporting gold by reducing opportunity costs and preserving its appeal as a store of value.
Everything You Need to Know About the ISM PMI and Its Key Role in Financial Markets
sms-star

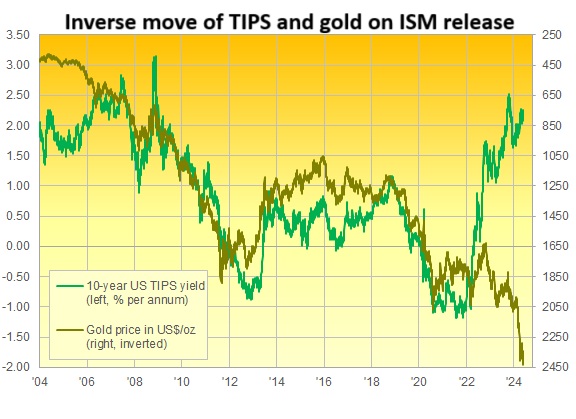
During periods of geopolitical tension or systemic risk, gold’s role as a “safe haven” can override typical PMI-driven dynamics.

The Role of the ISM PMI in Determining Global Crude Oil Price Trends

The ISM PMI indirectly reflects the outlook for energy demand. A reading above expectations signals stronger anticipated fuel consumption, which generally benefits crude oil prices. However, the impact of the PMI must be evaluated alongside supply-side factors such as OPEC policies, U.S. inventory levels, transportation disruptions, and other market dynamics. Occasionally, news of rising inventories or increased supply can offset the positive effect of a strong PMI.

Practical example: If the ISM Non-Manufacturing PMI exceeds forecasts and transportation and tourism indicators show improvement, oil traders may price in stronger demand, pushing WTI higher. However, if later that same day the inventory report reveals an unexpected increase, a significant portion of the oil price gains can be reversed.

ISM PMI

Correlation of the ISM PMI with the Bond Market and Interest Rates

The bond market is the most sensitive recipient of PMI signals. A strong PMI reading combined with high prices generally leads to bond selling and higher yields, as the market prices in inflation risk and a potentially steeper interest rate path.

Conversely, a weaker-than-expected PMI increases demand for bonds and lowers yields. This shift in yields acts as a transmission mechanism, linking the impact of the PMI to equities, gold, and even currencies.

Practical example: If the ISM Manufacturing PMI is released at 52.5 alongside a surge in prices, the yield curve steepens: two-year yields rise more than ten-year yields, reinforcing expectations for rate hikes or rate stability.

Everything You Need to Know About the ISM PMI and Its Key Role in Financial Markets

How Traders Use the ISM PMI in Trading

Below are three practical frameworks for trading and investing using the ISM PMI, which can be implemented directly on platforms such as MetaTrader 4 & 5 or TradingView.

Short-Term Trading Strategies Based on ISM PMI Data

The goal of short-term trading strategies after the release of ISM PMI results is to capture the initial momentum while managing risk precisely.

Steps for a short-term trading strategy:

  • 15–5 minutes before the release: Check the market consensus and forecast range, and identify the 60–90 minute pre-release trading range for the target currency pair. Reduce position size considering spread and slippage.
  • At the moment of release: Measure the difference between the forecast and actual result, and take a position accordingly.
  • Wait for confirmation: Allow a 1–5 minute candle to close outside the pre-release range. Then enter incrementally on a pullback to the broken level, placing the stop-loss just beyond the breakout line.
  • Exit strategy: Set the first profit target equal to the pre-release range. When reaching the first profit target, exit half the position and move the stop-loss of the remaining volume to breakeven.

Practical example – EUR/USD:
Assume the market forecast for the PMI is 50, but the actual reading comes in at 52. We expect the dollar to strengthen and EUR/USD to fall. The pre-release trading range is between 1.0740 and 1.0760.
With a valid break below 1.0740 and a pullback to this line, we enter a layered sell position. The stop-loss is placed 10–15 pips above 1.0740, and profit targets are set at 1.0720 and 1.0700.

Using ISM PMI in Fundamental Analysis and Long-Term Investing

For long-term investing, the ISM PMI can be used to anticipate three- to six-month trends, including corporate earnings cycles and the path of interest rates. The following three-step practical framework can be applied for fundamental analysis based on PMI:

  • Cycle Phasing:

    • PMI > 50 and rising: Expansion phase; overweight cyclical sectors (industrial, financial, energy).
    • PMI < 50 and falling: Recession phase; overweight defensive sectors (consumer staples, healthcare, utilities, etc.).

  • Inflation / Rate Filter:
    Examine the price sub-index and real yield behavior to determine the rate and inflation context.

    • Demand-driven growth with controlled price pressure: favorable for value and financial stocks.
    • Growth with high price pressure (inflationary): indicates high-rate risk; caution is needed for growth stocks and gold.
sms-star

Growth stocks are equities that the market expects to achieve above-average revenue or earnings growth, which is why they are typically traded at higher valuations. Examples include fintech companies, semiconductor industries, artificial intelligence firms, and similar high-growth sectors.

  • Cross-Market Confirmation

Check the alignment of the 2-year Treasury yields (which indicate policy expectations), the U.S. Dollar Index (DXY), and credit spreads. When all these indicators move in the same direction, the likelihood of a sustained equity trend and overall market stability increases, and conversely, divergence can signal caution.

Practical Example (Equity Portfolio):
Suppose that for three consecutive months, the ISM Non-Manufacturing PMI is above 50 and improving, but prices are trending downward. In this scenario, it is advisable to overweight industrial and financial stocks while underweighting utilities and non-cyclical sectors.

Combining ISM PMI Results with Other Macroeconomic Indicators for Better Decision-Making

To minimize false signals, interpret ISM PMI results alongside other key macroeconomic indicators. For example, when a rising PMI coincides with strong NFP (Non-Farm Payrolls) data and robust retail sales, the demand momentum is confirmed, making a scenario of a stronger dollar, higher yields, and pressure on gold more probable.

Conversely, a weak PMI combined with subdued inflation and declining industrial production signals a cooling growth environment, typically leading to a weaker dollar and supportive conditions for gold and bond.

sms-star

If the ISM PMI rises due to supply constraints while the Consumer Price Index (CPI) simultaneously comes in above expectations, the market faces supply-driven inflation and the risk of higher interest rates. In such a scenario, avoid blindly chasing rallies in growth stocks.

Limitations and Drawbacks of the ISM PMI

The ISM PMI has several limitations:

  • Measures direction, not magnitude: For instance, a reading above 50 only signals relative improvement, without indicating the actual size of growth or decline.
  • Equal weighting of components: The five subcomponents contributing to the PMI are equally weighted. This can distort the overall picture compared to reality or other PMI indicators, such as the S&P Global PMI.
  • Supplier delivery subcomponent influence: Even if demand is weak, slow supplier deliveries can push the PMI higher. Therefore, results should be interpreted alongside new orders and prices paid.
  • Sampling limitations: Since PMI is based on surveys, there is a risk of response bias. Moreover, the manufacturing PMI currently covers a smaller portion of today’s U.S. economy compared to the services PMI.
  • Divergence from other data: Due to differences in methodology and release timing, the ISM PMI may not align with other PMI indicators, industrial production, or GDP.
  • Temporary/calendar noise: Holidays, supply chain shocks, and short-term price spikes can temporarily distort the monthly PMI figure.

Conclusion

The ISM PMI is a fast, leading indicator that effectively reflects the short-term direction of the economy and interest rate expectations. However, it should always be interpreted in the context of its subcomponents and alongside complementary indicators (such as NFP, CPI, and industrial production). By doing so, traders and investors can avoid false signals and make faster, more precise, and confident decisions.

Continue Reading
not-found
calendar 4 November 2025
Rate this article

Leave a Reply

Your email address will not be published. Required fields are marked *

No thanks