


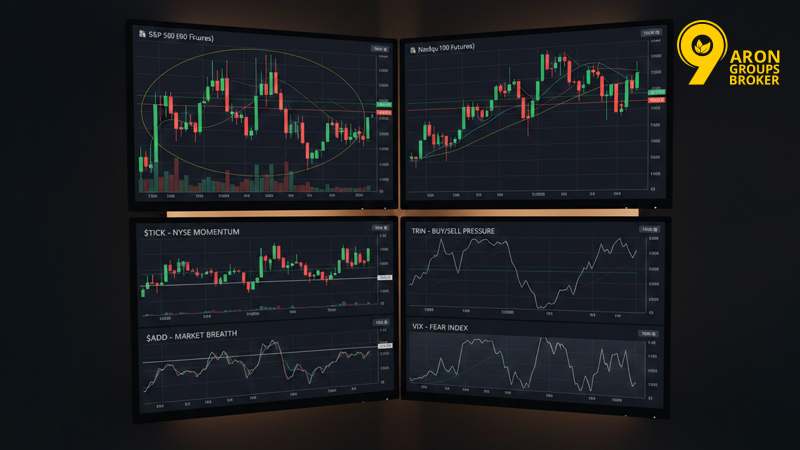
Price can break out and still fail. That is why market internals matter. They show what is happening under the index: participation, pressure, and volatility. So before you trust a move in SPX500 or NAS100, ask one question: is the market’s engine actually pushing in the same direction?

- Market internals measure breadth and depth of activity, not just price. They help you judge participation and sentiment.
- $TICK tracks NYSE upticks minus downticks. It is a fast read on intraday momentum and pressure.
- $ADD (advance–decline) is net advances: advancing stocks minus declining stocks. It is a live breadth gauge.
- The Advance–Decline Line is cumulative net advances. It helps confirm trends and spot divergences early.
- TRIN (Arms Index) combines breadth and volume to highlight buying vs selling pressure.
- VIX reflects the market’s expected 30-day volatility from S&P 500 option prices. It helps you read fear and volatility regimes.
Understanding Market Internals and Their Impact on Trading
According to TrendSpider, Market internals are a group of indicators that describe participation and pressure inside the market. They often answer questions that price alone cannot. For example: Is this rally broad or narrow? And is this breakout supported, or fragile?
Key Concepts Behind Market Internals
There are a few core ideas you should keep straight.
- Breadth: how many stocks are advancing vs declining. This is the backbone of $ADD and the AD Line.
- Intraday pressure: whether buying or selling is dominant right now. $TICK and TRIN help here.
- Divergence: price makes a new high/low, but breadth or pressure does not confirm. This is a common early warning.
- Regime: volatility expands and contracts. VIX gives you a volatility regime read.
A simple mental model:
Price is the headline. Internals are the vote count.
How Order Flow and Market Participation Drive Signals
Internals work because they reflect how many instruments are participating and how aggressively they are trading.
- If the index is rising but fewer stocks are advancing, that is a narrower move. It can continue, but it is easier to break.
- If price breaks out but $TICK stays weak, you may be seeing a false breakout with thin participation.
- If breadth improves before price, that can be an early engine starting signal.
This is why many traders use market internals for trend confirmation and reversal warning, not as standalone entries.

Important note:
These tools are most direct in US equities. Futures traders often use them as context for ES/NQ (SPX500/NAS100), but the data source still matters.
How Market Internals Differ from Conventional Indicators
Most conventional indicators are derived from price (moving averages, RSI, MACD indicator). Market internals are derived from market-wide data: advances/declines, upticks/downticks, and option-implied volatility.
That difference matters because:
- Price indicators can look strong during a narrow rally. Internals can expose the narrowness.
- Internals can help you avoid trading every breakout by demanding participation confirmation first.
- They can also warn you when conditions are stretched (short-term overbought/oversold) by showing extreme pressure readings.
Essential Market Internals Indicators Every Trader Should Know
If you want to learn only five market internals indicators, start here: $TICK, $ADD, AD Line, TRIN, and VIX. Together, they cover momentum, breadth, pressure, and volatility.
Here is a quick orientation:
| Indicator | What it measures | Best used for |
|---|---|---|
| $TICK | NYSE upticks minus downticks | Intraday momentum, exhaustion |
| $ADD | Net advances (advancers − decliners) | Breadth and participation |
| AD Line | Cumulative net advances | Trend confirmation, divergences |
| TRIN | Breadth ratio vs volume ratio | Buying vs selling pressure |
| VIX | Expected 30-day SPX volatility | Volatility regime, risk tone |
$TICK: Monitoring Intraday Momentum
As explained by Investopedia, the Tick Index ($TICK) measures how many NYSE stocks are ticking up minus how many are ticking down.
It is a fast snapshot of buying vs selling pressure.
How traders use it in practice:
- Confirmation: rising price with strong $TICK readings suggests real intraday demand.
- Divergence: price makes a new high, but $TICK does not, which can warn of weakening thrust.
- Exhaustion: extreme spikes can mark short-term climaxes. Treat them as alerts, not automatic reversals.
Important note:
$TICK is exchange-specific. Nasdaq-focused traders often use Nasdaq variants (data vendor dependent). Do not mix feeds and expect identical behaviour.
$ADD (Advance–Decline): Measuring Market Breadth
$ADD is commonly used as shorthand for net advances: the number of advancing stocks minus declining stocks.
It tells you whether the session is being carried by many stocks or just a few.
Practical reads:
- Positive $ADD: breadth is supportive. More stocks are lifting.
- Negative $ADD: breadth is heavy. Decliners dominate.
- Flat $ADD in a strong index rally: participation may be narrow. That matters for a market breadth trading strategy.
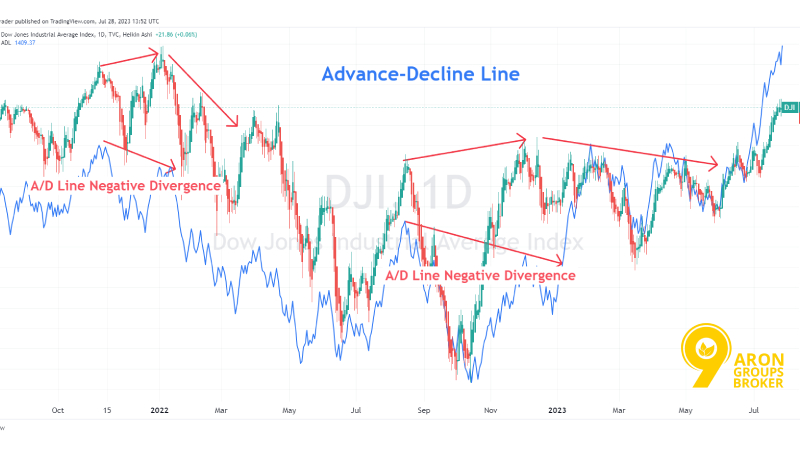
Advance–Decline Line: Gauging Who’s Active in the Market
The Advance–Decline Line takes net advances and makes it cumulative over time. (ChartSchool)
This is why it is popular for an Advance Decline Line strategy.
Two high-value uses:
- Trend confirmation: a rising AD Line alongside a rising index suggests broad participation.
- Divergences: if the index pushes higher while the AD Line fails or falls, the rally may be losing internal strength.
TRIN (Arms Index): Spotting Buying and Selling Pressure
TRIN (Arms Index) compares the advance/decline ratio to the advance/decline volume ratio.
In plain English, it blends breadth and volume to show whether volume is flowing more heavily into advancers or decliners.
The common interpretation:
- TRIN above 1: relatively more volume is going into decliners (bearish pressure).
- TRIN below 1: relatively more volume is going into advancers (bullish pressure).
Use it as a pressure lens during:
- Breakouts (is buying pressure real?)
- Pullbacks (is selling pressure orderly or aggressive?)
VIX: Assessing Market Fear and Volatility
The VIX is Cboe’s volatility index. It reflects expected near-term volatility implied by S&P 500 (SPX) option prices.
This is why it is often called a fear gauge.
For the VIX indicator for day trading, keep it simple:
- Rising VIX often signals risk-off conditions and wider swings.
- Falling VIX often supports calmer trend days.
- Sudden spikes can coincide with sharp sell-offs and liquidity stress.
Do not forget:
VIX does not tell you the direction. It tells you the temperature of risk.
Using $TICK and $ADD for Day Trading
If you day trade SPX500 or NAS100, $TICK and $ADD are the most valuable as confirmation tools. They help you answer one question fast: is this move being supported by real participation, or is price drifting on thin flow?
Tracking Intraday Sentiment Changes with $TICK
The Tick Index compares how many NYSE stocks are printing on an uptick versus a downtick at that moment (upticks minus downticks).
In plain terms, it is a quick read on intraday buying vs selling pressure.
How to use it without overthinking:
- On a push higher, you want $TICK to show positive pressure more often than not.
- If price makes a fresh high but $TICK cannot lift with it, treat it as a weak thrust. That often shows up before a pullback.
- If $TICK is swinging wildly, expect chop. Reduce the size or wait for a cleaner structure.
Remember:
$TICK is a momentary pressure gauge. It can flip quickly. Use it to confirm a plan, not to create one.
Reading Bullish and Bearish Breadth via $ADD
$ADD is a market breadth read based on Net Advances (advancing issues minus declining issues).
It tells you whether most stocks are moving with the tape or against it.
A practical interpretation:
- Positive $ADD: participation is supportive. More stocks are advancing than declining.
- Negative $ADD: participation is heavy. Decliners dominate.
- Flat $ADD on a big index move: the move may be narrow. That is where false breakouts live.
This is the backbone of a simple market breadth trading strategy: don’t treat index strength as real unless breadth agrees.
Combining $TICK and $ADD for Accurate Trade Timing
Here is a clean way to combine them. You are looking for alignment.
Trend continuation timing (higher probability)
- Price breaks structure or holds above a key level.
- $ADD is supportive (participation is broad).
- $TICK prints strong positive pressure during the push (thrust confirms).
False breakout warning (common trap)
- Price breaks out.
- $ADD stays weak or negative (a few stocks are lifting).
- $TICK fails to confirm the new high (pressure does not follow).
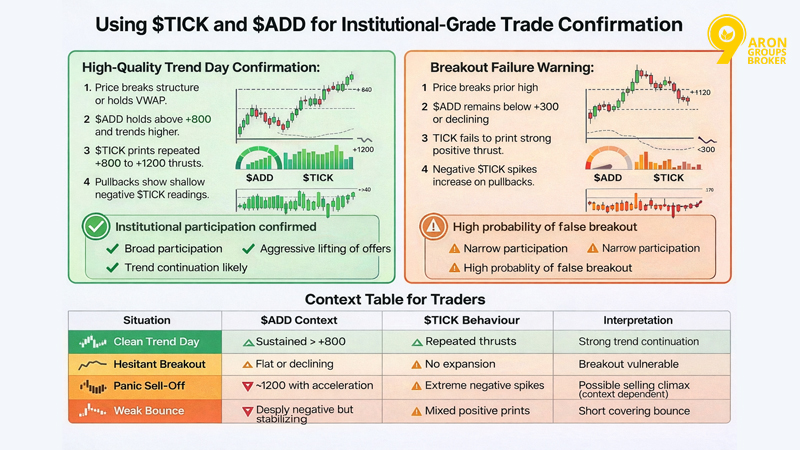
A small timing table you can keep on your screen:
| Situation | $ADD | $TICK | What it often means |
|---|---|---|---|
| Clean trend push | Supportive | Confirms thrust | The move has an engine |
| Breakout with hesitation | Flat/weak | Diverging | Breakout may fail |
| Panic flush | Very negative | Heavy negative bursts | Selling climax risk |
| Bounce on thin air | Weak | Mixed/low | Relief bounce risk |
Understanding Market Breadth
Breadth is about participation. It answers how many are involved? Rather than how far did we move? Net Advances, $ADD, and the AD Line all sit in the breadth family.
What Breadth Reveals About Market Participation
Breadth helps you separate two very different days that can look identical on a price chart:
- A broad move where many stocks are advancing.
- A narrow move driven by a small group of heavyweights.
That difference matters because narrow moves tend to be fragile. Broad moves tend to be stickier. Breadth tools are designed to make that visible.
Recognising Momentum Expansions and Thrusts
According to Investopedia, when breadth shifts fast from weak to strong, you are seeing a thrust style behaviour. A well-known example is the Breadth Thrust concept, which tracks rapid changes in advancing issues to detect strong momentum phases.
You do not need the exact formula to use the idea intraday. Look for:
- $ADD moving decisively away from zero and holding.
- Fewer and shallower pullbacks in breadth during the session.
- Price is making progress with broad participation.
Identifying Weak Rallies and Fragile Sell-Offs
Weak rallies often share one trait: price rises, but breadth does not.
Practical fragility signs:
- Index grinds up, but $ADD is flat or negative.
- Price pushes to a new high, but the AD Line is not confirming the trend.
- Internals improve late, after the move is mostly done (late participation).
The same logic works on sell-offs:
- If price drops but breadth stops deteriorating, downside pressure may be fading.
Important note:
Always match the breadth universe to what you trade. NYSE breadth is not the same as Nasdaq breadth.
Advance–Decline Line Techniques for Confirming Trends
The Advance–Decline Line (AD Line) is a cumulative breadth indicator built from Net Advances (advancers minus decliners). It rises when net advances are positive and falls when they are negative.
It is one of the cleanest tools for an Advance Decline Line strategy.
Confirming Bullish Trends with Rising Breadth
Trend confirmation is straightforward:
- If price is trending up and the AD Line is also rising, participation is supportive.
- This does not guarantee a straight line higher. It simply means the uptrend has breadth behind it.
A practical day-trader uses:
- On pullbacks, watch whether the AD Line holds its structure. If it does, you often get cleaner continuation attempts.
Spotting Early Warning Signs of Bearish Divergences
This is where internals shine. A classic warning is a bearish divergence:
- Price makes a higher high.
- The AD Line fails to make a higher high (or starts rolling over).
That suggests the rally is narrowing. It becomes easier to reverse because fewer stocks are carrying the move.
Validating Breakouts Using the AD Line
Breakouts fail a lot. Breadth can reduce the damage.
A simple validation approach:
- If price breaks out and the AD Line is also rising (or breaking out), the move is more likely to hold.
- If price breaks out but the AD Line lags, treat it as a lower-quality breakout and tighten rules (smaller size, faster invalidation).
Trading Divergences Using Market Internals
Divergences are where market internals earn their keep. Price can print a clean breakout, yet participation and pressure can quietly weaken underneath. Internals help you spot that mismatch early, before you get trapped in a late entry.
How Price and Breadth Can Diverge
As explained by StockCharts, a divergence is simple: price advances, breadth does not (or vice versa). The classic tool here is the Advance–Decline Line, which is built from cumulative net advances.
Common divergence types:
- Bearish divergence: index makes a higher high, AD Line fails to confirm. This suggests the rally is narrowing.
- Bullish divergence: index makes a lower low, AD Line holds up or improves. This suggests selling is losing breadth.
A day-trader-friendly way to use it:
- Treat divergence as a risk flag, not an entry signal.
- It tells you to be selective and tighten invalidation.
Remember:
Divergence doesn’t say reverse now. It says this move has fewer engines running and can be a sign of a reversal.
Identifying Institutional Buying and Selling Patterns
You cannot see institutions directly, but you can infer their footprint through pressure and participation.
Two practical clues:
- Broad participation + sustained pressure: $ADD stays supportive, and $TICK confirms thrust during pushes. That often aligns with real demand.
- Narrow leadership + fading internals: price rises, but breadth lags and thrust weakens. That often aligns with late-stage grind and distribution risk.
TRIN helps you add a pressure lens because it blends breadth and volume. You are not looking for perfection. You are looking for alignment.
Avoiding False Breakouts by Watching Internals
False breakouts often share one trait: price breaks, internals don’t confirm.
A practical filter you can apply in seconds:
- Breakout happens → check $ADD: is breadth supportive or weak?
- Check $TICK: is there thrust on the breakout push?
- Check AD Line: is it rising with price, or lagging?
If internals are weak:
- Reduce size.
- Tighten invalidation.
- Or skip and wait for the retest.
Using the VIX Indicator for Day Trading
The VIX is not a directional indicator. It is a volatility regime tool. It reflects the expected 30-day volatility implied by S&P 500 option prices.
For day trading, you use it to judge whether the tape is calm, stressed, or transitioning.
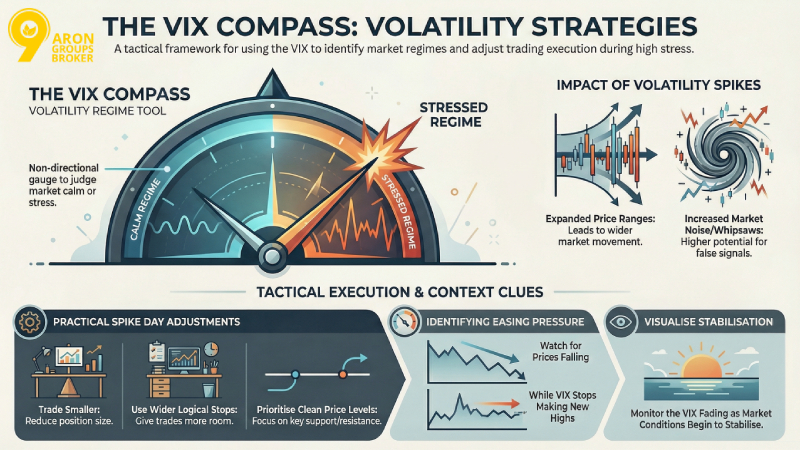
Interpreting Volatility Spikes in Equity Markets
A VIX spike often appears during rapid equity sell-offs and risk-off bursts.
For day traders, spikes mainly change two things:
- Range expands (moves travel further).
- Noise increases (more whipsaw).
Practical approach on spike days:
- Trade smaller.
- Use wider logical stops (but fewer trades).
- Prioritise clean levels and confirmed internals.
Important note:
VIX can rise while price rises (volatility up in both directions). Don’t treat VIX up as market down.
Understanding VIX Behaviour at Market Tops and Bottoms
VIX is often described as a fear gauge, but its real value is in extremes and changes, not the label.
High-level tendencies traders watch:
- VIX tends to surge during panic selling.
- VIX tends to fade as conditions stabilise.
How to use that intraday:
- If the price is selling off but VIX stops making new highs, selling pressure may be easing.
- If price grinds up but VIX starts lifting, risk may be creeping back in.
These are context clues. They do not replace the price structure.
Setting Up Trades During Volatility Squeezes
A volatility squeeze is when realised movement contracts and the market coils. You often see tighter ranges, then expansion.
A practical way to use VIX here:
- When VIX is compressed and internals are stable, expect smaller ranges.
- Be patient for the break.
- When volatility returns, demand confirmation from breadth before you commit size.
Applying Market Internals to Futures
Market internals are popular for futures trading because they provide context for index futures like ES/NQ and many CFD tickers such as SPX500 and NAS100. The key is using internals as a market condition dashboard rather than a trigger by itself.
Reading Index Futures like SPX500 and NAS100
When you trade index futures, you are trading a basket’s behaviour through one instrument. Internals help you check whether the basket is actually participating.
Practical use:
- Trading SPX500 directionally? Watch NYSE breadth tools ($TICK, $ADD, AD Line) for confirmation.
- Trading NAS100? Breadth and participation can behave differently because leadership concentration is higher. Use internals as a risk lens, not a perfect mirror.
Using Internals to Confirm Scalping and Intraday Trades
Scalpers need fast confirmation. Use a simple three-check method:
- Structure: is price at a real level?
- Breadth: is $ADD supportive or weakening?
- Pressure: Does $TICK confirm the push or fade?
If two out of three disagree, you are likely trading noise.
H3: Assessing Liquidity and Participation During Futures Sessions
Futures sessions change behaviour. Liquidity and participation differ between the cash open, midday, and late session.
Practical internal habits:
- Treat the cash open as high information. Internals can shift quickly.
- Be cautious in quiet periods. Breadth can flatten and create misleading signals.
- When volume returns (news, open, close), internals regain reliability.
Market Internals Across Major Indices
Market internals are not one-size-fits-all. Breadth and participation look different across indices and exchanges. Your job is to read internals as context for the instrument you trade, not as a universal truth.
Breadth Behaviour in the S&P 500 (SPX500)
When traders say SPX500, they usually mean the S&P 500 index (or a CFD/futures proxy). Breadth tools still help, but you must be clear about the universe you’re measuring. Advance–decline indicators can be built from different groups (exchange-wide, sector groups, index groups).
Practical way to use breadth for SPX500:
- Use $ADD / AD Line to ask: Is participation broad today, or is the index being carried by a small group?
- If SPX500 trends up but breadth weakens, treat rallies as more fragile and manage risk more tightly.
Participation Signals in the Nasdaq 100 (NAS100)
NAS100 often behaves like a leader-driven index. That means price can move strongly even when broad market participation is mixed. So you want to be stricter with your confirmation rules.
A practical approach:
- Demand clean alignment when you trade trend continuation: price structure + supportive breadth + supportive pressure.
- If NAS100 breaks out while breadth is flat/weak, treat it as a higher false-breakout risk (smaller size, faster invalidation).
Cross-Index Signals for Overall Market Sentiment
Cross-index reading is simple: you’re checking whether risk-on or risk-off behaviour is consistent.
Three useful cross-index checks:
- Breadth agreement: $ADD improves, and AD Line rises while indices push higher → healthier tone.
- Divergence warning: indices grind higher, but AD Line stalls → narrowing participation.
- Volatility regime: VIX rising alongside choppy price action often signals a more defensive tape (wider swings, more whipsaw).
Identifying Overbought and Oversold Conditions with Market Internals
Internals can flag short-term stretch conditions better than many price-only tools, because they capture pressure and participation directly. Think of it as: Is this move running out of fuel?
Recognising Internal Exhaustion Through Market Internals Signals
Internal exhaustion often shows up as: price continues, but internals stop confirming.
Common exhaustion patterns:
- Price pushes to new highs, but $TICK thrust weakens (fewer strong positive bursts).
- Price rises, but breadth stops improving (AD Line flattens).
- Pressure becomes one-sided and then stalls (TRIN shifts sharply, then fails to follow through).
This is not an automatic reversal signal. It’s a timing warning.
Detecting Sentiment Climax Points Using Market Internals
Climaxes are short, emotional bursts. Internals often become extreme.
Two common climax clues traders watch:
- $TICK extremes: Investopedia notes readings like +1,000 or -1,000 can signal potential short-term overbought/oversold conditions on the NYSE tick.
- Volatility spikes: VIX reflects expected 30-day volatility from SPX options, and sharp jumps often coincide with fear-driven conditions.
Pro Tip:
The "Pegged" Tick Rule:
When $TICK hits extreme levels like +1000 or -1000, don't fade it immediately.
Momentum Rule: If $TICK "pegs" (stays) at +1000 for multiple readings, that is strong momentum, not exhaustion.
Reversal Rule: Wait for $TICK to fail to reach that high again (divergence) before fading.
Timing Mean Reversion Trades with Market Internals
Mean reversion works best when you have (1) a stretch + (2) a level + (3) internals easing.
A practical mean reversion checklist:
- Price tags a clear level (prior high/low, range edge).
- Internals show stretch (e.g., extreme $TICK or heavy breadth imbalance).
- Then internals stop worsening (breadth stabilises, $TICK stops printing extremes).
- Only then look for your entry pattern.
Building a Trading Strategy Using Market Internals
A good internal strategy is not complicated. It is a framework that tells you when to be aggressive, when to be cautious, and when to do nothing.
Designing a Market Internals Framework
Build it in layers. Keep each layer answerable in one sentence.
Layer 1 — Regime (risk tone)
- What is volatility doing (VIX rising, falling, compressing)?
Layer 2 — Participation (breadth)
- Is breadth supportive (net advances, AD Line direction)?
Layer 3 — Pressure (intraday)
- Is intraday pressure confirming the move ($TICK behaviour)?
Layer 4 — Price
- Where is the trade on the chart (level + structure)?
Small framework table:
| Decision | Internals condition | Your response |
|---|---|---|
| Press trades | Breadth + pressure confirm | Hold winners, allow continuation |
| Trade selectively | Mixed internals | Smaller size, faster invalidation |
| Stand down | Internals conflict + chop | Wait for clarity |
Integrating Internals with Price Action and Market Structure
Use internals to filter your setup. Not to invent one.
A clean integration flow:
- Identify the level and structure of SPX500/NAS100.
- Check breadth: Is participation aligned?
- Check pressure: does $TICK support the direction on the push?
- Execute only if the story matches.
Filtering Trades and Managing Risk
Internals mainly help with three risk decisions:
- When to skip (breakout looks good, internals don’t confirm).
- When to size down (mixed breadth + rising volatility).
- When to let it run (breadth and pressure keep confirming).
Risk rules that pair well with internals:
- If internals weaken, take partials faster.
- If internals confirm, widen your target logic (not your stop logic).
Common Mistakes to Avoid When Using Market Internals
Most mistakes come from misusing internals as signals instead of evidence.
Misreading Breadth During Quiet Sessions
Breadth can flatten in slow periods. That does not always mean reversal. It can simply mean low participation. Also, breadth indicators vary by universe (issue-based vs volume-based, exchange vs group).
Fix:
- Treat quiet-session internals as lower confidence.
- Wait for active windows (open, major news, close) for stronger reads.
Overreliance on a Single Indicator
$TICK is fast but noisy. AD Line is stable but slower. TRIN adds pressure context but can swing.
Fix:
- Use a two-out-of-three rule: breadth + pressure must agree with price.
Ignoring Broader Market Sentiment
If volatility regime shifts, your tactics should shift too. VIX is designed as a constant 30-day measure of expected volatility from SPX options.
Fix:
- When volatility rises, trade more small and demand stronger confirmation.
- When volatility compresses, expect tighter ranges and be patient.
Conclusion
Market internals help you read what price can hide: participation, pressure, and volatility. Use $ADD / AD Line for breadth, $TICK for intraday pressure, TRIN for buying vs selling pressure, and VIX for volatility regime. Then keep it practical: trade breakouts only when internals confirm, treat divergences as risk flags, and adjust size when volatility changes. That is how you read the market’s engine, not just the headlights.