icon icon Home
icon icon Accounts
icon icon Quick start
icon icon Symbols

How Market Maker Signals Reveal Stop Hunts and Liquidity Moves

Author
Abe Cofnas
Abe Cofnas
calendar Last update: 17 February 2026
watch Reading time: 11 min

Market maker signals get sold like secret codes, but most traders just want one thing: stop getting trapped by false breakouts and stop hunts that reverse fast — so what’s actually real here, and how can you read market maker signals in a way that’s practical rather than mythical?

bookmark
Key Points:
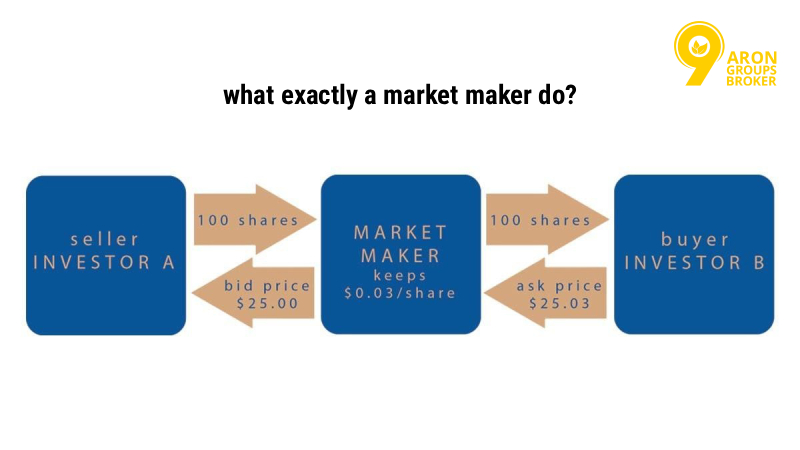
  • In most markets, a market maker is a liquidity provider who quotes both sides and earns from the spread — not a magician sending hidden messages.
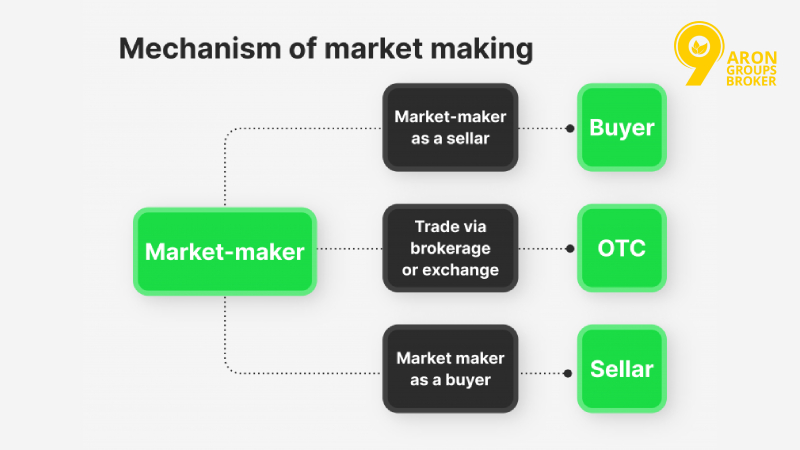
  • FX is largely OTC and dealer-driven, so the market maker is not a single visible entity.
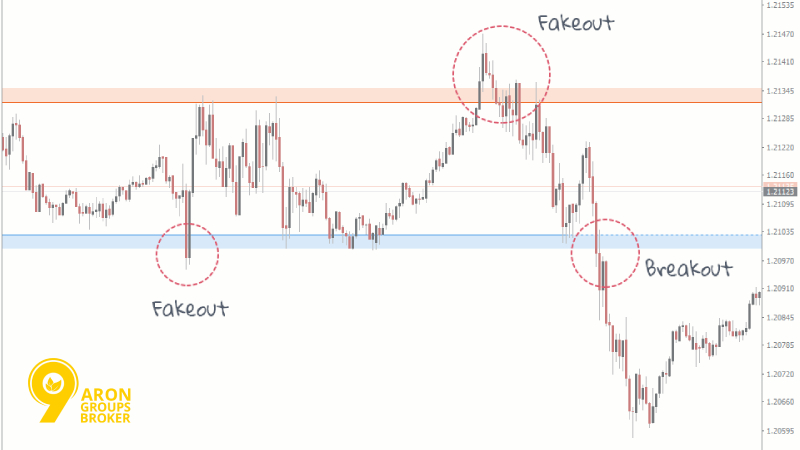
  • Many market maker signals are really liquidity behaviours: runs above highs/below lows, fast rejections, and failed breakouts.
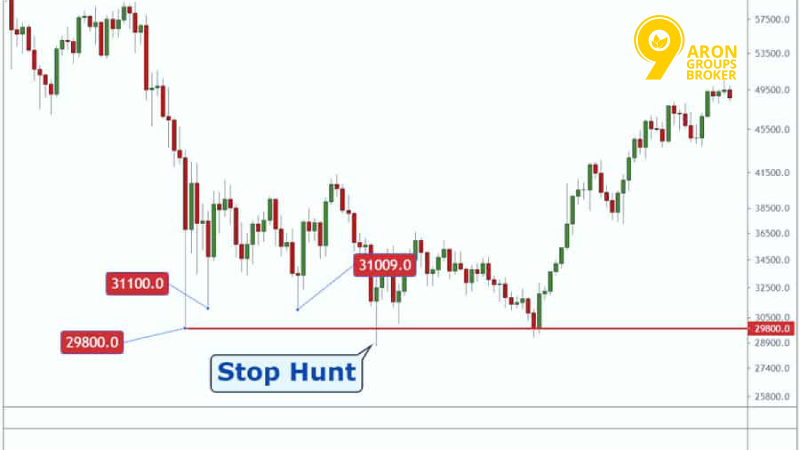
  • A stop hunt is often just price moving into obvious liquidity pools where stops cluster. It can happen without a conspiracy.
  • Treat signal codes as marketing unless you can define them, test them, and explain the market logic behind them.
  • Your edge improves when you focus on location + liquidity + reaction, not candle superstition.

What Are Market Maker Signals?

Most traders use market maker signals as a label for price actions that look engineered: quick spikes, stop runs, and sharp reversals. The useful approach is to translate the label into something measurable: liquidity being taken and price reacting.

Market maker signals

Understanding the Role of Market Makers in Forex

According to Investopedia, a market maker, in general, provides liquidity by quoting buy and sell prices and profiting from the bid–ask spread.
Forex, however, is mostly an OTC dealer market. Liquidity comes from banks and non-bank dealers across venues.

So keep expectations realistic:

  • You are not tracking one market maker.
  • You are reading how liquidity is accessed in a dealer-driven market.

Identifying Genuine Market Maker Trading Signals

If you want something you can actually use, define signals as repeatable behaviours you can spot on a chart.

The most practical genuine signals usually include:

  • A clean level (recent high/low, range edge, equal highs/lows).
  • A breakout attempt that looks convincing.
  • A quick failure (price returns back inside and holds). This is classic false-breakout behaviour.
Market maker signals

What to do with that:

  • Don’t trade the spike.
  • Wait for the reaction and a clear back inside acceptance.
  • Then look for a clean execution point (next section of the article covers tools like DOM/SMC).
sms-star

Remember:
If you can’t describe the behaviour in one sentence, it’s not a signal. It’s just movement.

Common Misconceptions: Are Market Maker Signals Real?

Yes and no.

  • Yes, liquidity-driven moves are real. False breakouts are a real pattern: price breaks a level, then closes back inside the prior range.
  • No, there is no universal market maker code that reliably tells you what will happen next.

A healthier framing:

  • There are liquidity incentives around obvious levels.
  • Price often tests those levels.
  • Sometimes it continues. Sometimes it rejects.

Your job is to wait for confirmation, not to assume intent.

Stop Hunts and Liquidity Grabs

This is the part most people over-dramatise. Stop hunting usually means price moved into an area where many orders were sitting, then snapped away. You don’t need a villain. You need a method.

How Market Maker Signals Reveal Stop Hunts and Liquidity Moves

What Stop Hunting Means in Forex

In practice, stop hunting is often a failed breakout around a highly visible level.
Price trades beyond the level, triggers stops and breakout entries, then returns inside.

A simple way to spot it:

  • Break beyond the level briefly
  • Close back inside the prior range
  • Follow-through in the opposite direction (often fast)


How Market Makers Exploit Liquidity Zones

Where do these moves happen most? Around places where retail orders cluster.

Common liquidity zones:

  • Prior day/session highs and lows
  • Equal highs / equal lows
  • Round numbers
  • Range boundaries (top/bottom of consolidation)

What exploit look like on a chart:

  • A push into the zone
  • A sharp reaction away
  • Then price travels to the next obvious pool (often the opposite side)
sms-star

Important note:
Not every wick is a stop hunt. Sometimes it’s just volatility. You need the return + acceptance.

Institutional Candles: Spotting Aggressive Price Moves

Traders often call an institutional candle a candle with strong displacement: a fast move that leaves little overlap behind. It matters because it shows urgency.

Look for:

  • A large-bodied candle that breaks structure
  • Speed (few candles to travel far)
  • A clear before/after shift in behaviour (range → expansion)

How to use it safely:

  • Don’t chase it.
  • Mark where it started and where it left an imbalance (you can look at this as a FVG).
  • Wait for price to return and prove direction with a clean reaction (this links directly to false-breakout logic).

Market Maker Levels and Signal Codes

Market maker signals usually mean two things: actionable Level 2 market depth or mythical ‘secret codes. If you separate those, you’ll stop wasting time and start reading liquidity properly.

Level 2 Signals: Insights Into Market Depth

Level 2 usually refers to deeper order-book data, not just the best bid/ask. It shows layers of bids and offers at multiple prices (i.e., market depth).

Signal TypeVisual on DOMWhat It Usually MeansActionable Intel
StackingHuge wall of Limit Orders at one price.Magnet: Price often moves toward it to fill.Watch for reaction at the level.
PullingBig orders vanish as price gets close.Fake Intent: It was likely "spoofing" to push price away.Ignore the level; it’s weak.
ImbalanceHeavy Bids vs. Thin Asks (or vice versa).Pressure: Price likely moves away from the heavy side.Trade in direction of the push.
How Market Maker Signals Reveal Stop Hunts and Liquidity Moves

On MT5, this appears as Depth of Market (DOM). MetaTrader’s own help notes that DOM exists and also that it behaves differently on exchange vs OTC markets.

Here’s how to think about Level 2 signals without overcomplicating it:

  • Stacking (large size sitting at a level): can act like a short-term magnet or barrier.
  • Pulling (size disappears as price approaches): often means the wall was not real intent.
  • Imbalance (more size one side than the other): suggests where liquidity is thicker in that feed.

A small, practical cheat sheet:

What you see (DOM)What it often meansWhat you do next
Big bids below priceLiquidity support in the bookWait for price to test and react
Big offers above priceLiquidity supply in the bookWatch for failure/rejection
Sizes vanish near levelOrders were pulledDon’t trust that level alone
Sudden size appearsPossible spoof-like behaviourWait for price confirmation
sms-star

Better to know that:
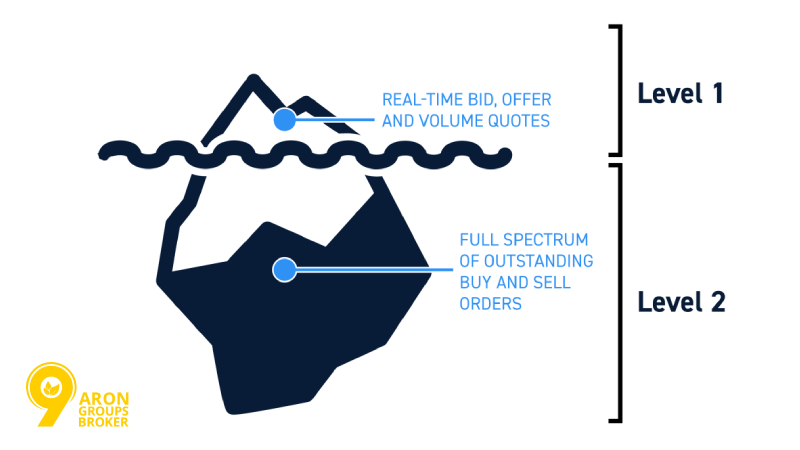
In spot FX, DOM is typically your broker’s liquidity view, not the whole market. Treat it as context, not truth.

How to Interpret Market Maker Signal Codes

When people say market maker signal codes, they usually mean old code lists from equities chatrooms and microcap lore. Those claims are hard to verify and often rely on storytelling, not market mechanics. If you still want a useful way to interpret codes, reframe the word code as repeatable behaviour:
  • A break above highs that fails = liquidity grab / false breakout.
  • A spike into a level, then fast rejection = stop run behaviour.
  • A clean push with little overlap = displacement (often institutional urgency).
That gives you signals you can backtest on a chart. It also keeps you out of conspiracy thinking.

Key Lists of Market Maker Signals Every Trader Should Know

Instead of a secret code list, use a list that actually helps you trade. A practical list of market maker signals (price + liquidity):
  • Stop running then return (breaks a high/low, snaps back inside).
  • False breakout (break + close back inside a range boundary).
  • Liquidity grab (brief break of a swing, then reversal) as detailed by ATAS.
  • Displacement candle (strong impuls
  • ive move away from a level).
  • No follow-through after a break (breaks level, then stalls).
  • DOM stacking/pulling near a key level (only as supporting evidence).
Use the list like a filter. Don’t use it like a prediction machine.
sms-star

Checklist: Is It a Signal or Just Noise? Don't trust a "code" unless it passes these 3 checks:

Location: Is price at a key High/Low or round number? (Random spots = Noise).

Speed: Did the move happen aggressively (displacement)? (Slow grind = Noise).

Reaction: Did price reject the level immediately? (Acceptance = Continuation, not a trap).

Using SMC and MT5 Depth of Market (DOM) to Read Liquidity

SMC gives you the map (structure and liquidity). DOM gives you the execution context (where orders sit in your feed). When you combine them, you stop chasing candles and start waiting for a cleaner trap-and-release.

Applying Smart Money Concepts (SMC) in Forex

For this article, keep SMC simple. Use three questions:
  • Where is liquidity obvious? Highs, lows, equal highs/lows, range edges.
  • What got taken? A sweep/grab above highs or below lows is your event.
  • What changed after the event? Look for rejection, displacement, or a clear failure to continue.
This stops you from labelling every wick as stop hunting.

Using Depth of Market (DOM) on MT5 to Spot Liquidity

On MT5, DOM shows bids and asks close to market price and can be used to place and manage orders. MetaTrader also notes DOM behaves differently on exchange vs OTC markets. A clean way to use DOM with price levels:
  • Mark a key level on the chart (prior high/low).
  • Open DOM and watch the level as price approaches.
  • Look for stacking, then watch if it holds or pulls.
  • Only act after price confirms (rejection or acceptance).
What DOM is best for:
  • Timing entries.
  • Avoiding thin breaks with no support.
What DOM is not:
sms-star

Tips:
If your broker’s DOM appears unstable or shallow, you should downgrade its role in your decision-making process. Regard it merely as a secondary corroborating factor rather than a primary signal.

Practical False Breakout Setups for Traders

Here are two setups that are easy to learn and hard to fake. Keep them rule-based.

Setup 1: Range-edge fakeout (stop hunt style)

  • Identify a clean range boundary.
  • Wait for a break beyond the boundary.
  • Require a return inside the range (acceptance back inside).
  • Enter on a retest of the broken edge from inside.
  • Invalidate if the price is accepted outside the range again.
How Market Maker Signals Reveal Stop Hunts and Liquidity Moves
Setup 2: Swing high/low grab
  • Mark the most recent swing high/low.
  • Let price run it (the grab).
  • Wait for a clear rejection candle and follow-through.
  • Enter on a small pullback.
  • Target the next obvious liquidity pool (often the opposite side).
If you want to add DOM:
  • During the break, check if liquidity supports the move or vanishes.
  • If it vanishes and price stalls, treat it as a higher fakeout risk.
sms-star

Suggestion:
The most successful false-breakout trades often seem late to impatient traders. This is precisely why they are effective. Your objective is to wait for the trap to be triggered, rather than attempting to predict its location.

Practical Tips for Leveraging Market Maker Signals

This is where you turn the idea into a routine. Keep your market maker signals simple: liquidity zone → reaction → execution. If you can’t describe your plan in one line, it’s too complex to trade.

Timing Your Trades Around Liquidity Zones

Timing is not enter fast. Timing is enter after proof.

Use this sequence:

  • Mark the obvious liquidity zone (prior high/low, equal highs/lows, range edge).
  • Wait for the liquidity event (sweep, failed break, or acceptance).
  • Enter on the retest or pullback, not on the spike.

Practical timing rules that reduce bad trades:

  • Avoid entries in the middle of a range.
  • Prefer entries near extremes, after a clear reaction.
  • If price breaks a level, demand follow-through or stands aside.

Remember that the signal is not the breakout. The signal is what happens after the breakout.

Risk Management When Following Market Maker Signals

According to Bookmap, Most stop hunt losses are not because the idea was wrong. They’re because risk was loose.

Keep risk tight:

  • Use a fixed risk per trade. Stay consistent.
  • Put the stop where the idea is invalidated, not where it feels safe.
  • Don’t widen stops after entry.

Simple stop logic:

  • For a sweep-and-reject trade, stops often go beyond the sweep extreme.
  • For an acceptance trade, stops often go back inside the prior range.

A quick risk management filter (fast, practical):

  • If the stop is huge, skip the trade.
  • If you don’t have a clear target, skip the trade.
  • If you feel rushed, skip the trade.

Avoiding Traps: Distinguishing Real Signals from Noise

A real signal has structure. Noise is just movement. Use these three tests:

Test 1: Location
Is it happening at an obvious liquidity level? If not, downgrade it.

Test 2: Event
Did liquidity get taken, or did price just wiggle? A real move often includes a clear grab or a clear acceptance.

Test 3: Reaction
Did price show rejection or follow-through? False breakouts often break a level then close back inside.

Here are quick noise signs to watch for:

  • Breaks a level, but there’s no speed and no follow-through.
  • Multiple fake breaks in both directions.
  • Price keeps flipping around the same level.
sms-star

Do not forget:
When market narratives shift every few moments, they are merely noise. Authentic signals remain consistent over time.

Conclusion

Market maker signals are useful only when you translate them into real, tradable behaviour: liquidity zones, stop runs/false breakouts, and clear reactions. In forex, there isn’t one visible puppeteer, but there are repeatable liquidity patterns you can learn to spot and manage. Keep your process short: mark the level, wait for the event, demand confirmation, then execute with clean risk. That’s how you stop being the liquidity.

Continue Reading
not-found
calendar 17 February 2026
Rate this article
Plugin not installed

Leave a Reply

Your email address will not be published. Required fields are marked *

No thanks