


Trading performance is rarely determined solely by the design of a strategy. The same setup can produce stable returns in one environment and persistent losses in another, despite being executed with identical rules; what changes is not the signal, but the market conditions surrounding it.
Market regime trading focuses on aligning decisions with those conditions. It introduces a structural layer to trading, where risk deployment, participation, and expectations are governed by the prevailing market environment rather than by isolated setups.
This article outlines a practical framework for approaching trading through a regime lens—designed to improve decision consistency, execution timing, and risk allocation without adding unnecessary complexity to the trading process.

- Strategy performance depends on the market regime, not signal quality alone.
- Execution conditions (spreads, slippage, and liquidity) often signal stress before price structure changes.
- Trend and volatility are the core dimensions; ignoring one gives incomplete guidance.
- Market regime detection is only useful if it affects position size, trade frequency, or permission to act.
- Transition phases carry the highest risk, with clustered execution errors and false breakouts.
What Is a Market Regime?
According to Luxalgo,while a market trend shows the direction and slope of price movement over a given timeframe, a market regime defines the environmental and behavioural context in which that trend occurs.

Key Point:
A trend indicates where the price is moving, but a market regime determines how it moves and under what risk conditions.
Market Regime vs Market Trend
For example, a bullish trend in a low-volatility regime typically features orderly pullbacks, smooth execution, and manageable risk. The same trend in a high-volatility regime, however, may be accompanied by rapid swings, frequent stop-outs, and higher trading costs.
Understanding this distinction enables traders to avoid misapplying trend-based strategies and make decisions that are aligned with the actual market conditions and execution risk, rather than relying solely on directional movement.
Market Regime vs Market Cycle
Market cycles broadly describe the macro phases of the economy or financial markets, such as expansion, contraction, and transitional periods. They offer a high-level strategic perspective but are less actionable for short- or medium-term trading decisions.
In contrast, a market regime reflects real-time price behaviour and trading conditions. It may persist across multiple macro cycles or shift within a single cycle. Focusing on regimes allows traders to adapt execution, risk management, and tactical positioning to the prevailing market environment, without relying on forecasts of economic phases or broader cycle timing.
Q: Why do market regimes change?
A: Market regimes shift as a result of evolving constraints and market participation. Factors such as crowded positions, leverage, policy uncertainty, and sudden liquidity withdrawal can quickly alter market behaviour.
Volatility rarely remains constant; it tends to cluster, creating periods of intensified movement. Similarly, correlations between assets can spike sharply during stress, which undermines diversification precisely when it is most needed. Understanding these dynamics is crucial for aligning strategies with the prevailing regime and managing risk effectively.
Types of Market Regimes Traders Face
This section explains what each market regime looks like in real price behaviour.
Trending Market (Bull vs Bear Phase)
A trending market shows directional follow-through across swings. Pullbacks tend to resume in the trend direction after shallow retracements.
A bull vs. bear phase changes the bias, not the structure. Both can trend, but the risk events and squeezes differ.
Ranging Market (Sideways Market)
A ranging market is one in which the price oscillates around a value. Breakouts fail more often, and mean reversion dominates.
Chop risk is the key hazard. Small wins are common, but large losses arrive when ranges break violently.
High Volatility Regime vs Low Volatility Regime
A high volatility regime increases intraday travel and widens reasonable stop distances. Small position sizes and stricter trade selection become essential.
A low-volatility regime may look calm but can mask compressed risk. Expansion from compression can punish oversized positions.
How Regimes Combine in Real Charts: The Regime Stack
“Trend vs range” alone is incomplete. Trends can exist in high- or low-volatility regimes.
Treat regimes as a stack: directional state + volatility state.
This stack is the minimum viable framework for consistent decisions.
Market Regime Classification: How to Label Regimes Consistently
Market regime classification is not a theoretical exercise. It is a labelling system that you can apply the same way every week.
If your labels change with your mood, your review becomes useless. Consistent labels let you separate a bad trade from a bad environment.
Choose Your Timeframe and Window Length
Start with the timeframe you actually trade. A regime label built on daily data can mislead a scalper, as the daily “state” can hide intraday reversals.
Pick a lookback window that matches your holding period. Short windows respond quickly, but they also “twitch” and create false regime changes. Long windows are stable, but they react late after conditions have already shifted.
A practical rule:
Your regime window should be long enough to cover multiple trade outcomes. If your system holds for two days, a five-day window is usually too jumpy.
Q: Can Two Traders Be in Different Market Regimes at the Same Time?
A: Yes. Market regimes are time-dependent, not universal states. An intraday trader may face a high volatility range, while a swing trader sees a clean trend. This is why regime signals are not portable across strategies. A regime is only valid relative to the holding period and execution horizon.
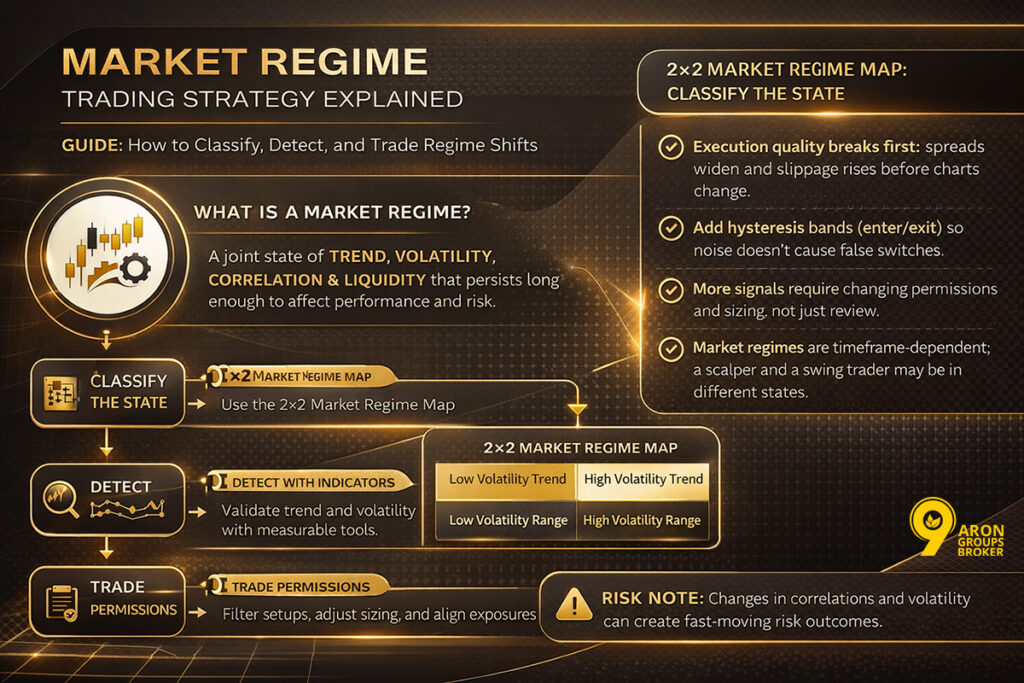
The 2×2 Market Regime Map: Trend Strength × Volatility
The 2×2 map gives you four labels that cover most trading conditions. It tells you what kind of errors to expect before you place a risk.
| Trend Strength \ Volatility | Low Volatility Regime | High Volatility Regime |
|---|---|---|
| Strong Trend | Continuations are cleaner, pullbacks are orderly | Moves are faster, stop distance expands, whipsaws rise |
| Range | Mean reversion is more stable, and risk can stay tight | Range breaks snap back, false moves increase |
Each quadrant has a different “failure pattern.” In a high volatility regime, the cost of being wrong is larger and faster. In a range, the cost is death by a thousand cuts from repeated small losses.
Your goal is simple:
Do not run fragile rules in the quadrant that punishes them. Classification is how you avoid paying that tuition.
Market Regime Detection With Indicators: A Measurement Toolkit
Market regime detection is a diagnostic check. You are reading the market’s current “operating conditions” using observable data.
Think of it like checking road conditions before driving faster. You do not predict the whole journey; you decide what is safe right now.
Trend Strength Measures
A trend-strength market regime indicator should be non-directional. It answers one question: Is this market behaving like a trend or a range?
Practical measures include:
- ADX: flags trend strength without caring whether the price is rising or falling.
- Moving average slope: shows whether drift is persistent or flat and noisy.
- Breakout failure rate: counts how often breakouts reverse quickly, which is typical in ranges.
Use more than one signal when possible. Ranges often “look” like trends for a few candles, then punish late entries.
Volatility Measures
Volatility is the regime variable that changes your stop distance and position size.
To make it comparable, it must be normalised.
Useful tools include:
- ATR ÷ price: turns raw movement into a percentage-like measure across assets.
- Realised volatility: uses recent returns to quantify how turbulent conditions are.
- Contraction and expansion: identifies when calm periods are tightening or breaking open.
High volatility regimes are not just “bigger candles.” They change execution quality, slippage risk, and the probability of stop hits.
Optional Context Measures
Context inputs are only worth adding if they change a decision. More inputs often produce cleaner backtests and messier live execution.
Optional measures that can earn their place:
- Rolling correlations: Reveals hidden concentration when assets start moving together.
- Breadth or dispersion: shows whether an index move is broad participation or a few heavy names.
- Market Regime Detection With Indicators, Spread and volume cues: warns you when liquidity is thin, and fills may worsen.
A simple rule:
If you cannot explain what the context input changes, remove it. Regime detection should make decisions clearer, not heavier.
Q: Why Do Market Regimes Fail First at the Execution Level?
A: Market regimes usually break execution before they break structure. Spreads widen, slippage increases, and fills deteriorate even while charts still look “normal.”This is why regime detection should monitor execution quality, not just price behaviour. If the situation worsens, the regime will have already changed for practical trading purposes.
Market Regime Filter: Turn Detection Into a Trade Permission System
A market regime filter is the rule set that decides whether you are allowed to trade a setup today. It converts regime detection into yes / no / reduce decisions.
Without a filter, you will trade every signal you see. That is how good strategies bleed during the wrong market regime.
Entry Gates by Strategy Family
Group your tactics into strategy families, then assign permissions by regime. This stops you from forcing a favourite setup into conditions that do not support it.
Typical gates look like this:
- Trend playbooks: allowed only when trend strength is confirmed and structure holds.
- Mean-reversion playbooks: allowed only in ranges, and only when volatility is not elevated.
- No-trade states: used during transitions, major event risk, or unstable conditions.
A gate is not a “nice to have.” It is a pre-commitment that prevents emotional overrides.
Switching Rules (When to Pause, Reduce, or Swap)
Regimes rarely change cleanly. The transition is where traders lose money through whipsaws and repeated re-entries.
Switching rules define what you do before damage accumulates:
- Step-down sizing after a regime change, then scale back only after stability returns.
- Pause trading after rapid flips, because the market is not offering a stable edge.
- Kill-switch on execution deterioration, such as spreads widening beyond your tolerance or abnormal slippage.
These rules protect capital and attention. They also protect your data, because fewer “transition trades” pollute performance analysis.
Monitoring Cadence and Logging
Run regime checks on a fixed schedule, not when you’re unsure. Consistency is what makes your review useful.
Log three items each time:
- Regime label + confidence: what state you are in, and how clear the evidence is.
- Permissions: which playbooks are active, reduced, or disabled.
- Key risks: volatility expansion, correlation creep, liquidity quality, and any event exposure.
If your log is clean, your decisions become repeatable. That is the point of a market regime filter.
Market Regime Trading Strategy Explained: Match Playbooks to Regimes
This is where regime work stops being theory and starts controlling trades. A regime label is only useful if it changes what you do next.
You are not “finding a better setup”. You are choosing the right playbook for the current market regime.
Playbook for Trending Markets
Trending markets pay you for staying with the move. Your biggest enemy is entering late and exiting early.
Rules that fit a trending regime:
- Enter on pullbacks into structure, not on stretched momentum candles.
- Let structure manage exits, using swing-based trailing logic rather than fixed targets.
- Avoid counter-trend fades, unless you run a separate, tested mean-reversion system.
In trends, more trades usually mean worse trades. Your edge often improves when you trade less and hold longer.
Playbook for Ranging Markets
Ranges pay you for being selective and for admitting you are wrong quickly. Your biggest enemy is believing every breakout will run.
Rules that fit a ranging regime:
- Trade the edges, not the middle, and invalidate just beyond the boundary.
- Take profits earlier, because the market often snaps back to the centre.
- Cut frequency when volatility rises, because ranges turn violent before they break.
In ranges, discipline is refusing low-quality entries that sit in the chop zone.
Risk and Position Sizing by Volatility Regime (Trade-Level Only)
Volatility decides how far the price can move without being wrong. That distance must shape stop placement and position size.
Trade-level sizing rules:
- High volatility regime: reduce size, widen stops to logical structure, and accept fewer trades.
- Low volatility regime: do not upsize just because stops look tight; expansion can be abrupt.
- Risk stays fixed per trade, while position size adjusts to stop distance.
If you keep the size fixed while the volatility expands, you increase risk without noticing. That is how “a normal trade” becomes a drawdown event.
One-Page Regime Playbook (Decision Tree)
A decision tree prevents on-the-fly rule changes. It also keeps your results reviewable.
Run this before each session:
- Detect the regime using trend strength and normalised volatility.
- Classify it using your timeframe, window, and thresholds.
- Filter trades using your permissions for strategy families.
- Execute one playbook, then review outcomes weekly.
The goal is not a perfect regime call. The goal is consistent actions under changing conditions.
Market Regime Changes and Asset Allocation
Market regime changes and asset allocation are connected through one hard fact: portfolio risk is not additive. When correlations rise, positions that looked independent start behaving like one trade.
A portfolio can fail even when every single trade is “reasonable”. The failure shows up in clustered losses and accelerating drawdowns.
What Regime Shifts Break in Portfolios
Diversification is usually the first casualty of a regime shift. Assets that used to offset each other begin moving together, often in the wrong direction.
Two practical consequences follow:
- Correlation creep: your “balanced” book becomes a concentrated bet without you noticing.
- Drawdown compounding: losses occur simultaneously across sleeves, shrinking recovery options.
Liquidity constraints then make the damage harder to manage. Wider spreads, thinner books, and gapping prices turn rebalancing into a cost, not a remedy.
Regime-Aware Allocation Approaches
Allocation rules should respond to measurable risk conditions, not stories. If a rule cannot be executed under stress, it is not a rule.
Practical approaches include:
- Risk-on/off bands: reduce exposure when volatility is high, with strict leverage caps.
- Cash as a position: hold cash when regimes are unstable and signals conflict.
- Volatility-scaled hedges: size hedges off volatility, not headlines or opinions.
- Rebalancing discipline: slow rebalancing when volatility is elevated to avoid paying peak spreads.
The aim is not to avoid all losses. It is to prevent a regime shift from turning a normal drawdown into a forced unwind.
Real-World Constraints
Turnover limits often matter more than elegant optimisation. Taxes, financing costs, and spreads can erase small expected gains.
Use portfolio guardrails that survive costs:
- Drawdown budgets by sleeve to stop one segment from dominating losses.
- Risk caps to prevent exposure from drifting upward as volatility rises.
- Cost-aware rebalances that consider liquidity and execution quality.
Operational Insight
Portfolio resilience comes from constraints you respect in real time. A plan that works only in calm markets is not an allocation framework.
Advanced Market Regime Detection: Models and Validation
Advanced models are useful when simple rules leave too many “grey zone” days. They should reduce uncertainty and tighten decision rules, not produce clever labels.
If a model cannot be explained in plain language, it should not control risk. Complexity is a cost, not a badge.
Regime-Switching Models (Markov Switching)
Markov switching models treat the market as moving through a small set of states. Each state has its own return and volatility profile.
They work best when you want broad labels such as “calm trend” versus “turbulent market”. They struggle when the market’s structure changes and the old states no longer match reality.
A common failure mode is false confidence after a structural break. The model keeps assigning states, but the state meanings have drifted.
Hidden Markov Models (HMM)
HMMs assume the regime is hidden and must be inferred from observable features. You feed inputs like returns, volatility, and trend metrics, then estimate state probabilities.
They help when regimes are not visually obvious on charts. They also fail quietly when features are poorly chosen or when samples are too short.
The main risk is tuning the number of states until the backtest looks perfect. That produces a model that describes history, not tradable conditions.
Clustering and ML Classification (Beyond 2-4 Regimes)
Clustering groups time periods with similar feature fingerprints. It can detect nuanced market regimes that sit between simple “trend” and “range”.
The danger is state explosion. More regimes create more switching, more turnover, and more ways to be wrong.
Use clustering only if it changes actions in a stable, repeatable way. If it does not change permissions or sizing, it is analysis overhead.
Validation Checklist (Non-Negotiable)
A model is not “validated” because it fits a backtest. It is validated when it survives future data and realistic execution.
Minimum standards before deployment:
- Walk-forward testing with fixed rules and no re-tuning midstream.
- State stability checks to confirm regimes keep the same meaning over time.
- Turnover and friction modelling, including spread, slippage, and gaps.
- Look-ahead bias audits for every input series and timestamp alignment.
If the model fails any of these, downgrade it to research. A simpler regime filter will usually outperform a fragile, complex model.
Conclusion
Market regime work is not motivation or terminology. It is an operating routine that maintains consistent decisions when conditions change.
Run the same weekly process: classify the market regime, confirm it with measurement, then apply your regime filter. Execute only the approved playbook, and adjust asset allocation when correlations and volatility shift.
Keep it practical: one page, one review slot, and one log entry per week. Consistency beats complexity because it reduces unforced errors and improves post-trade learning.


