


Market Risk Models, such as Value-at-Risk (VaR), help estimate potential losses and guide informed decision-making. Stress testing and model validation ensure the accuracy of these models, especially in volatile markets. This article covers market risk models, focusing on VaR, stress tests, and validation, to help traders manage risk and safeguard investments.

- Market risk models, such as VaR, help estimate potential losses and support risk management decisions.
- Stress testing and backtesting validate risk models, ensuring their accuracy under different market conditions.
- Regular monitoring and rebalancing of portfolios ensure risk models remain up-to-date and effective.
- Emerging tools like AI and machine learning are improving market risk models, enabling real-time, adaptive decision-making.
Introduction to Market Risk Models
Market risk models are tools used to estimate the potential risks and losses a trader could face in the financial markets. These models allow traders to quantify risk and set limits on their exposure to potential losses, helping them make informed, calculated decisions. Traders use these models to anticipate and mitigate potential risks, protecting their investments from sudden market movements and price fluctuations.
Types of Market Risk
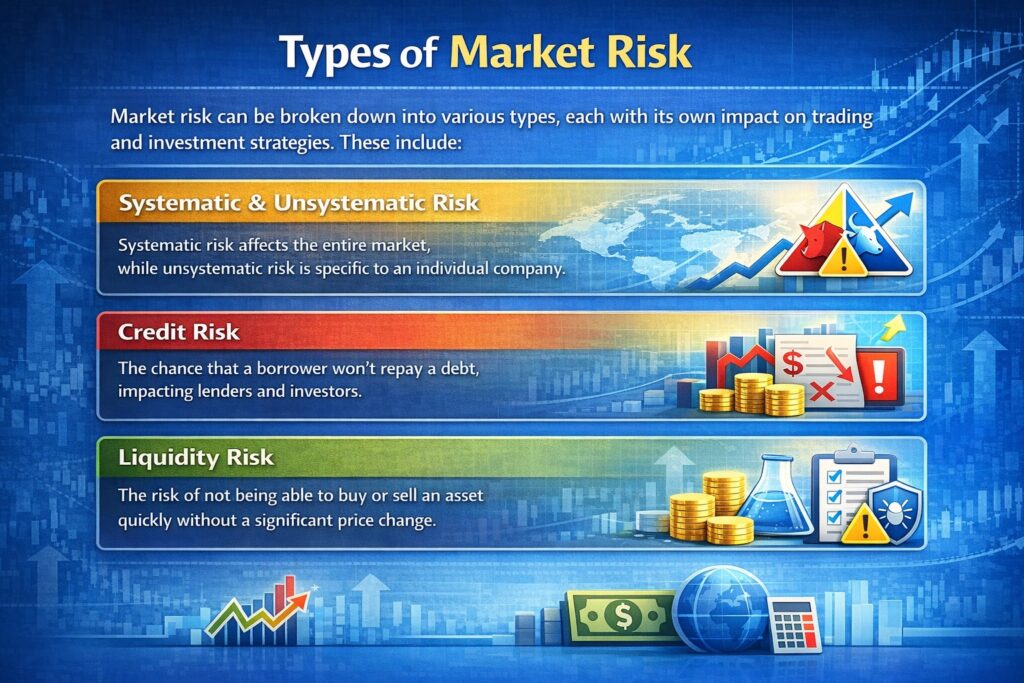
Market risk can be broken down into various types, each with its own impact on trading and investment strategies. These include:
- systematic and unsystematic risk
- credit risk
- liquidity risk
- operational risks.
Understanding these risks is essential for building accurate market risk models that help traders manage potential losses effectively.

Note:
Risk management strategies differ across markets. Forex traders may use currency pair diversification, gold traders may hedge with options, and crypto traders require specialised tools due to high volatility.
Managing Market Risk and Its Approaches
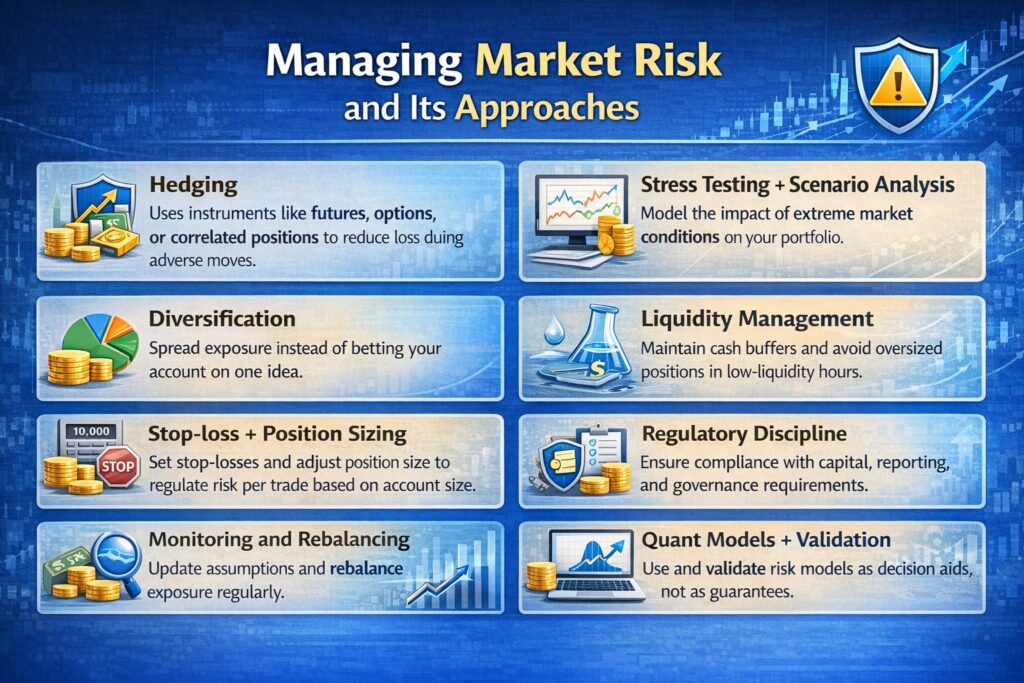
Managing market risk means you don’t just “hope” the market behaves. You build rules that limit damage when price, volatility, or liquidity turns against you. A solid market risk approach usually combines several methods, not just one.
According to Quantified Strategies, Key strategies that help traders manage exposure to market fluctuations include:
- Hedging: using instruments such as futures, options, or correlated positions to reduce losses during adverse moves.
- Diversification: Instead of betting your account on a single idea, you spread your exposure.
- Stop-loss + position sizing: A stop-loss without sizing is useless. For example, if you risk 1% per trade on a $10,000 account, your max loss is $100. If your stop is 50 pips, your lot size must match that $100 risk.
- Stress testing + scenario analysis: allow traders to evaluate how extreme market conditions—such as sudden interest rate hikes or significant stock price drops—might impact their portfolios.
- Liquidity management: In thin markets, spreads widen and slippage spikes. Keeping a cash buffer and avoiding oversized positions in low-liquidity hours reduces blowups.
- monitoring and rebalancing: Correlations shift, volatility regimes change, and your risk model becomes outdated. Update assumptions and rebalance exposure regularly.
- Regulatory discipline: For institutions, market risk management also means meeting capital, reporting, and governance requirements.
- Quant models + validation: Use risk models (VaR, volatility, correlation) as decision aids, not as guarantees. Validate with backtesting, exceptions tracking, and “model drift” checks.
Value at Risk (VaR): The Core of Market Risk Models
Value at Risk (VaR) is a fundamental tool that helps traders and financial institutions assess their risk exposure and set capital protection limits.
Understanding the concept of Value at Risk (VaR)
According to finans-blog, Value at Risk (VaR) is a widely used measure of potential portfolio losses over a specified time frame at a given confidence level. It estimates the maximum loss a trader might face under normal market conditions, providing a clear picture of risk exposure.
For example, if a portfolio has a 1-day VaR of $1,000 at the 95% confidence level, there is a 95% chance that the portfolio’s 1-day loss will not exceed $1,000.
How VaR measures potential losses in trading positions
VaR uses historical data and current market conditions to assess risk. It takes into account factors like price volatility, which reflects how much an asset’s price fluctuates.
For example, if an asset is highly volatile, its VaR will be higher, indicating a greater risk of loss.
Applications of VaR in real-time market risk management
In real-time market risk management, VaR is used to determine the amount of capital to allocate for risk exposure, set stop-loss levels, and guide decision-making under uncertainty. It helps traders maintain a balance between risk and reward by providing insights into potential losses and supporting risk-adjusted returns.
For example, if a trader’s portfolio reaches its VaR limit, they may reduce exposure or adjust positions to avoid further risks.
Types of VaR models: Historical simulation, parametric, and Monte Carlo simulation approaches
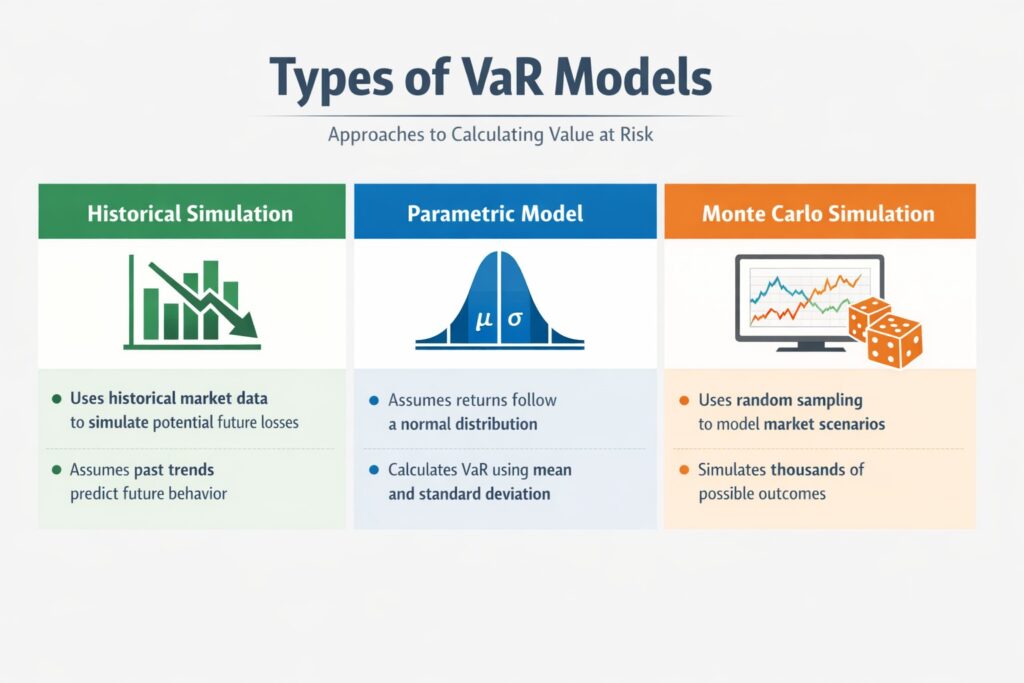
There are three primary approaches to calculating VaR:
- Historical simulation: Uses historical market data to simulate potential future losses, assuming that past price movements can predict future behaviour.
- Parametric (variance-covariance): Assumes that asset returns follow a normal distribution and calculates VaR using the mean and standard deviation of returns.
- Monte Carlo simulation: Uses random sampling and statistical modelling to simulate thousands of possible market scenarios, providing a more flexible and comprehensive view of potential risk.
Advantages and limitations of different VaR models
Each VaR model has its strengths and weaknesses.
- Historical simulation is straightforward and doesn’t require assumptions about return distributions, but it can be limited by data availability.
- The parametric model is computationally efficient but assumes normal distribution, which might not always be accurate during market extremes.
- Monte Carlo simulation is the most flexible and robust, but can be complex and resource-intensive.
Table: Advantages and limitations of different VaR models
| VaR Model | Advantages | Limitations |
|---|---|---|
| Historical Simulation | Simple to implement, no distribution assumptions required | Limited by historical data availability, may miss extreme events |
| Parametric Model | Computationally efficient, quick to calculate | Assumes normal distribution, less accurate in extreme markets |
| Monte Carlo Simulation | Most flexible and robust, simulates various scenarios | Complex, resource-intensive, requires significant computation |
Q: How can VaR models be optimised for volatile markets like cryptocurrencies?
A: Monte Carlo simulations are useful for volatile markets, as they simulate multiple scenarios, while updating VaR models in real-time improves accuracy in assessing risks.
Integrating VaR with Position Sizing and Risk Per Trade
Integrating VaR with position sizing allows traders to manage risk more precisely and consistently. Rather than relying on gut feeling, traders use VaR to define the maximum capital at risk for each trade based on market conditions and their risk tolerance.
This approach prevents over-leveraging during quiet periods and ensures traders don’t under-trade when opportunities arise, creating a balanced and emotion-free trading strategy.
Calculating Optimal Position Sizes Using VaR Limits
To calculate optimal position sizes, traders set a daily VaR limit, typically 1% to 2% of their total equity, and compare it to the asset’s volatility.
For example, if a trader has a $100,000 account and a $1,000 daily VaR limit, they would calculate position size based on the asset’s risk per unit. For an asset with $2 daily volatility, they can trade 500 shares, but for a more volatile asset with $10 daily volatility, they can trade only 100 shares.
This method ensures consistent risk management across different assets.
Practical Applications: VaR in Day-to-Day Trading
In live trading, VaR acts as both a pre-trade filter and an ongoing risk monitor. Traders calculate “Marginal VaR” to assess how a new trade will impact portfolio risk.
For example, if a trader holds a long position in the S&P 500 and wants to buy the NASDAQ, a quick VaR check reveals high correlation between the two, prompting them to adjust their positions to avoid excess risk. Similarly, during major news events that increase market volatility, traders may reduce position sizes to maintain their target risk levels, protecting their accounts from unexpected moves.
Volatility and Correlation in Market Risk Models
Volatility and correlation are crucial components in assessing market risk.
Volatility measures the degree of variation in asset prices over time, while correlation evaluates the relationship between different assets.
Both factors help traders and risk managers understand how markets and assets might behave under different conditions.
How Volatility Impacts Market Risk Models and Positions
Volatility plays a direct role in market risk models:
High volatility increases the risk of larger price swings, thereby increasing the potential for loss. In market risk models, assets with higher volatility will contribute to a higher VaR and influence position sizing.
For example, a highly volatile asset, like a cryptocurrency, requires smaller position sizes to limit the risk of significant losses, while stable assets, like government bonds, can support larger positions without significantly increasing risk.
Understanding Correlation Between Assets and Its Role in Risk Assessment
Correlation measures how assets move together.
If two assets are positively correlated, they tend to move in the same direction; if they are negatively correlated, they tend to move in opposite directions.
Understanding correlations is essential for diversifying a portfolio and minimising risk:
- Holding two positively correlated assets increases the portfolio’s overall risk, as both assets could lose value simultaneously.
- Negatively correlated assets can help balance risk, as the loss in one may be offset by gains in another.
Impact of Timeframe on Market Risk Modelling
The choice of timeframe directly impacts how risk is calculated and how market behaviour is predicted.
- Short-term modelling: focuses on shorter periods, such as daily or weekly price movements, and is more relevant for traders who frequently enter and exit positions. These models are more sensitive to market fluctuations and are used to manage frequent trades with higher volatility.
- Long-term modelling: averages out daily price swings, capturing broader trends over time. This approach is suited for investors looking to manage risk over an extended period, with less frequent adjustments needed.
Adjusting VaR calculations based on different timeframes
Traders and investors must tailor their VaR calculations based on their trading timeframe to accurately reflect the risk exposure of their strategies.
- Short-term timeframes (e.g., daily) carry a higher risk due to frequent price fluctuations, requiring traders to adjust VaR to account for greater volatility.
- Long-term timeframes (e.g., monthly, yearly) result in lower VaR as volatility is averaged over time, but the overall exposure to risk may increase with a longer holding period.
Stress Testing Market Risk Models: Why It Matters
Stress testing is a technique used to evaluate how a portfolio will react under extreme market conditions.
By simulating worst-case scenarios, traders and investors can assess potential vulnerabilities in their risk models. Stress testing is essential because it helps identify weaknesses that may not be visible during normal market conditions, ensuring that a portfolio can withstand unexpected market shocks.
Stress testing methodologies and how they prepare traders for extreme market conditions
According to MorningStar, there are two main types of stress testing methodologies:
- Market-driven Scenarios: These simulate the impact of past market events (e.g., a market crash or a sudden market rally). It allows traders to see how their portfolio would react to similar events in the future.
- Macrofinancial Scenarios: These simulate the impact of large-scale macroeconomic events (e.g., a global financial crisis or a regional recession). This approach helps traders assess how external economic factors could affect their portfolio.
Key stress test scenarios that traders should consider
The scenarios below help traders understand how their portfolios may react to extreme events, ensuring that their risk management strategies are robust and prepared for unexpected market movements.
- Market Crashes: Simulating a sudden drop in major asset prices (e.g., a 20% drop in global stock markets) to assess the portfolio’s resilience.
- Interest Rate Shocks: Evaluating the impact of sudden changes in interest rates on fixed-income assets and other interest-sensitive investments.
- Geopolitical Events: Modelling the effects of geopolitical instability (e.g., trade wars, military conflicts) on market performance.
- Liquidity Crises: Simulating periods of low market liquidity, which can increase volatility and hinder asset sales.
Backtesting VaR: Validating Risk Predictions
Backtesting is the process of testing a risk model using historical data to evaluate its accuracy. The goal is to determine whether the model’s predictions match past outcomes.
For VaR, backtesting helps verify whether the model’s estimated potential losses align with actual losses observed during specific time periods. This validation is essential to ensure that the VaR model is robust and reliable for future risk management.
The Process of Backtesting and Its Relevance to Market Risk Models
Backtesting evaluates the accuracy of VaR models by comparing predicted losses with actual outcomes. The process involves:
- Applying the VaR Model: Use the model to predict potential losses over a set time period at a given confidence level (e.g., 95%).
- Comparing Predictions with Actual Results: After the period, compare predicted losses with actual losses.
- Assessing Accuracy: If the model consistently aligns with actual outcomes, it’s deemed reliable. Otherwise, adjustments are necessary to improve its accuracy.
How to Backtest VaR Effectively to Ensure Robustness in Real Trading Environments
To backtest VaR effectively:
- Use Sufficient Historical Data: Test the model with data spanning various market conditions, including high-volatility periods.
- Conduct Regular Backtesting: Continuously refine the model as market conditions change.
- Compare Multiple VaR Models: Evaluate different models (e.g., historical simulation, parametric, Monte Carlo) to find the best fit for your risk profile.
- Evaluate Model Failures: Identify when the model fails to predict actual losses and adjust for weaknesses.
Key Insight:
Effective backtesting ensures that the VaR model remains relevant and accurate, helping traders manage risk with greater confidence in real trading environments.
Combining VaR with Drawdown and Equity Curve for Comprehensive Risk Assessment
VaR measures potential loss over a specific time period but doesn’t capture long-term risk. Combining VaR with Drawdown and Equity Curve provides a fuller picture of risk and performance.
Combining VaR with drawdown for a more complete risk picture
Drawdown shows the peak-to-trough decline in a portfolio’s value, revealing potentially large, sustained losses that VaR might miss.
By combining VaR with drawdown analysis, traders can manage risk on two fronts:
- They can limit potential daily losses using VaR
- and ensure their strategies withstand longer downturns using drawdown metrics.
The importance of equity curves in understanding long-term trading performance
Equity curves track portfolio value over time, offering a visual view of performance.
By analysing the curve, traders can determine if their risk management techniques support consistent returns. A well-performing equity curve shows steady growth, with the ability to recover from drawdowns.
Combining equity curves with VaR and drawdown provides a complete view of risk and performance, ensuring sustainable strategies in the long run.
Why Market Risk Models Fail in High Volatility Periods
Market risk models often struggle during periods of high volatility because extreme market conditions are unpredictable.
The limitations of risk models during market crises and volatile periods
Market risk models are often based on historical trends, assuming that volatility and price movements follow certain patterns. However, during market crises or periods of extreme volatility, these assumptions break down.
Factors such as sudden market crashes, geopolitical events, or unexpected economic changes can lead to miscalculations and misinterpretations of the actual risk exposure.
Historical examples of failed models in extreme market conditions
Many models failed during the 2008 global financial crisis when markets behaved unpredictably.
For example, the risk models that banks and financial institutions relied on underestimated the potential losses from mortgage-backed securities, leading to massive losses.
Another example includes the failure of models during the “flash crash” of 2010, where algorithmic trading caused sudden, severe market drops that were not predicted by traditional risk models.
Enhancing risk models to cope with unprecedented volatility
To improve their reliability in extreme conditions, risk models need to incorporate more dynamic data sources, such as real-time information, sentiment analysis, and scenario-based stress tests. Models also need to account for “black swan” events and adjust to changing market conditions. By combining multiple risk assessment techniques, incorporating forward-looking data, and increasing model adaptability, traders can better prepare for periods of extreme volatility.
Q: How can social sentiment data improve risk models?
A: Incorporating social sentiment data, like from social media or news, helps predict market shifts and complements traditional models for better risk assessment.
Strengthening Your Market Risk Models
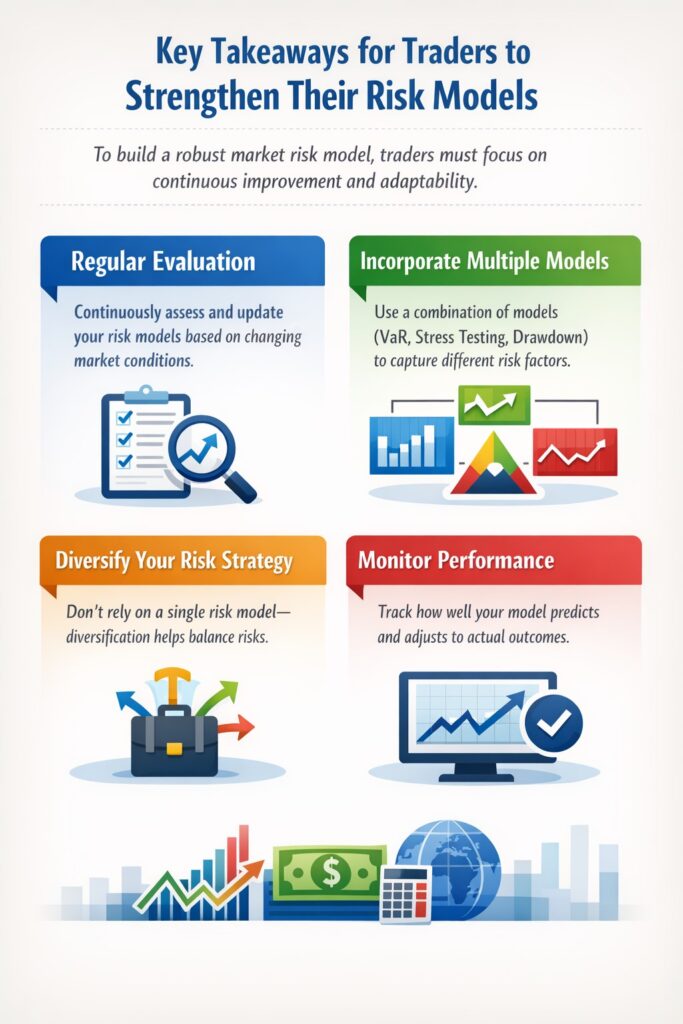
To build a robust market risk model, traders must focus on continuous improvement and adaptability.
Key takeaways for traders to strengthen their risk models
- Regular Evaluation: Continuously assess and update your risk models as market conditions change.
- Incorporate Multiple Models: Use a combination of models (e.g., VaR, stress testing, drawdown analysis) to capture different risk factors.
- Diversify Your Risk Strategy: Don’t rely on a single risk model—diversification across tools and techniques helps balance risks.
- Monitor Performance: Regularly track how well your model predicts and adjusts to actual outcomes to identify areas for improvement.
Q: How can market risk models be used effectively in volatile markets?
A: In volatile markets, combining models like VaR, scenario analysis, and stress testing, and updating them regularly with new data, ensures accurate risk assessment during extreme conditions.
The future of market risk modelling and emerging tools
The landscape of market risk modelling is evolving with the introduction of new technologies and data sources.
- AI and Machine Learning: Emerging technologies are enabling more dynamic, adaptable risk models that can process vast amounts of data in real time.
- Alternative Data Sources: New data sources, such as social media sentiment or geopolitical risk indicators, are being integrated into market risk models to better predict extreme market events.
- Improved Stress Testing: Advanced stress-testing techniques are evolving, allowing traders to simulate more complex and extreme market scenarios.
Q: How can risk models be improved in low-liquidity markets?
A: Managing liquidity by holding cash buffers and using scenario analysis for low liquidity periods helps mitigate risks in these markets.
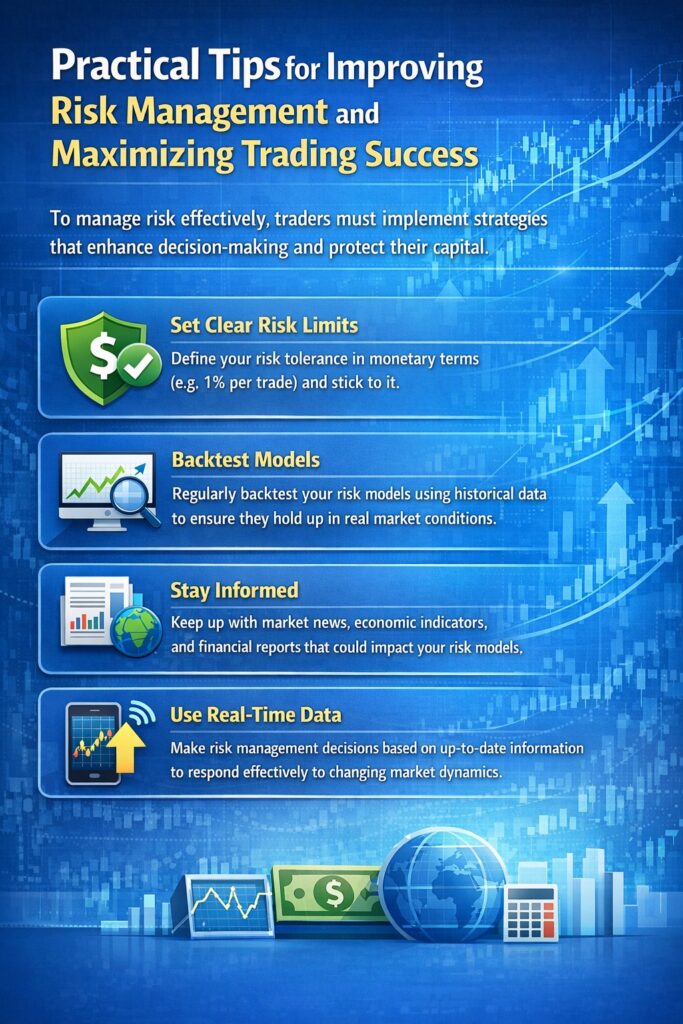
Practical tips for improving risk management and maximising trading success
To manage risk effectively, traders must implement strategies that enhance decision-making and protect their capital.
- Set Clear Risk Limits: Define your risk tolerance in monetary terms (e.g., 1% per trade) and stick to it.
- Backtest Models: Regularly backtest your risk models using historical data to ensure they hold up in real market conditions.
- Stay Informed: Keep up with market news, economic indicators, and financial reports that could impact your risk models.
- Use Real-Time Data: Make risk management decisions based on up-to-date information to respond effectively to changing market dynamics.
Q: How can social sentiment data improve risk models?
A: Incorporating social sentiment data, like from social media or news, helps predict market shifts and complements traditional models for better risk assessment.
Conclusion
Market risk models, such as VaR, are essential tools for traders to estimate potential losses and guide their decisions. By integrating these models with techniques like stress testing, backtesting, and validation, traders can enhance the robustness of their strategies and better navigate volatile markets. Understanding the different types of risks and applying risk management approaches, such as diversification and hedging, helps traders safeguard their investments and improve long-term performance.


