


Most trading strategies look great on past data until you trade them live, when they fail out of sample backtesting fixes that by testing your strategy on unseen data. If it performs well there, too, your edge is more likely to be real.
Whether you trade Forex, stocks, gold, or crypto, understanding how out of sample testing works can protect you from curve-fitting and false confidence.
In this guide, you will learn how to structure, evaluate, and strengthen your trading strategy using proper validation techniques.

- Out-of-sample backtesting validates robustness by testing the same rules on unseen data—no tweaks allowed.
- In Out-of-sample backtesting, stable degradation is normal; collapse is a red flag.
- Avoid backtest illusions: look-ahead bias, data snooping, and data leakage can make weak strategies look profitable.
- Profit factor, drawdown, Sharpe ratio, and expectancy matter more than raw returns in Out-of-sample backtesting.
- Validation set should include stress periods and a sufficient sample size (often 100–200+ trades) to be meaningful.
Understanding Out-of-Sample Backtesting
Backtesting is the process of applying a trading strategy to historical price data to evaluate how it would have performed in the past. However, not all backtests are equal. The real strength of a strategy appears only when it is tested on unseen data. Out-of-sample backtesting is a validation method used to assess whether a trading strategy performs well outside the data used to develop it.What Out-of-Sample Backtesting Really Means
َAccording to quantifiedstrategies, Out-of-sample backtesting means testing your strategy on historical price data that you did not use to build or optimise the rules. The goal is simple: check whether your edge survives outside the “training” period. In professional trading research, analysts always separate in-sample vs out-of-sample data to measure robustness.- In-sample data → Used to build and optimise the strategy
- Out-of-sample data → Used only for validation
- 50 EMA and 200 EMA
- 1:2 risk-reward ratio
- 1% risk per trade
- If performance remains consistent, your edge may be genuine.
- If results collapse, your strategy was likely optimised only for past conditions.

Key Insight:
Validation is the process of testing a strategy on new, unseen data to confirm that its performance is genuine and not the result of overfitting.
Using Unseen Data in Backtesting to Prevent Overfitting and Curve Fitting
Overfitting occurs when a model is overly well-fit to past data. It “memorises” price history rather than capturing repeatable market behaviour.
For example:
- Strategy A has a 65% win rate in-sample
- Profit factor = 2.1
- But the out-of-sample win rate drops to 42%
- Profit factor falls to 0.9
That is curve fitting.
Proper out of sample backtesting helps detect this early. It forces the strategy to prove itself under different volatility, liquidity, and trend conditions.
In-Sample vs Out-of-Sample Backtesting Explained
The mistake most traders make is trusting in-sample results too much. But optimisation can create artificial performance.
If a strategy performs well only during optimisation but fails during validation, the edge is not durable. Professional quants continually evaluate in sample vs out of sample backtesting before deploying capital.
Comparing In-Sample and Out-of-Sample Backtesting Forecasts
A strong system should show similar behaviour across both In-Sample and Out-of-Sample Backtesting. The numbers do not need to be identical, but they must be stable.
Example: Crypto momentum strategy (BTCUSD)
In-sample (2018–2021):
- Annual return: 28%
- Profit factor: 1.9
- Max drawdown: 15%
Out-of-sample (2022–2024):
- Annual return: 22%
- Profit factor: 1.6
- Max drawdown: 18%
This is healthy degradation. Performance dropped slightly, but the edge remains intact.
Now compare with a weak case:
Out-of-sample:
- Annual return: -5%
- Profit factor: 0.85
- Drawdown: 35%
That gap suggests overfitting.
Avoiding Look-Ahead Bias and Data Snooping Pitfalls in Backtesting
Even proper out of sample testing can fail if the data processing is flawed.
Two dangerous errors are:
- Look-ahead bias
- Data snooping
According to QuantStrategy, Look-Ahead Bias happens when your strategy uses information that would not have been available at the time of the trade.
For example, entering a trade based on the daily close before the candle has actually closed. That is unrealistic.
Also, data snooping happens when you test dozens of parameter combinations until one looks perfect. For example, a trader might test 200 moving average settings and select the best-performing one. It may feel like a skill, but in reality, the result can be pure randomness.
To reduce these risks:
- Lock parameters before running the out-of-sample test
- Avoid excessive optimisation
- Use realistic spreads, slippage, and commissions
- Keep rule logic simple and explainable
Designing a Robust Out-of-Sample Backtest
A proper out of sample backtesting process does not happen by accident. It requires structure, discipline, and precise data separation.
Many traders understand the concept of in-sample vs out-of-sample, but fail when designing the actual test.
The goal is simple: simulate how the strategy would behave in the real world. That means:
- No parameter adjustments during validation
- No hidden future information
- No optimisation after seeing results
A robust design forces the strategy to operate under realistic constraints. If the system only works after repeated tweaking, it is not strong. A well-structured out of sample test protects you from false confidence and capital loss.
Splitting Historical Data for Accurate Backtesting Validation
The first step is to divide your historical dataset correctly. A typical structure is separating data into three distinct buckets rather than just two:
- In-Sample (Training),
- Out-of-Sample (Validation),
- and Holdout (Test).
In-Sample (Training) Data: This is the sandbox where you build your strategy, optimising parameters and rules. It typically consumes the most significant portion of your historical data (e.g., 60-70%).
Out-of-Sample (Validation) Data: This segment is used to test the parameters generated from the training data. It acts as a feedback loop to refine the model, but it is still part of the development process.
Warning:
Random splitting (like in machine learning) is dangerous in trading because markets evolve. The most robust method for maintaining time order when comparing data is Walk-Forward Analysis.
Choosing the Validation Window and Holdout Dataset in Your Backtest
Selecting the right size for your validation and holdout windows is critical to statistical significance.
- The Holdout Dataset:
This is your “vault” data. It should be a pristine segment of recent historical data (e.g., the last 1–2 years) that is never looked at during the strategy development or optimisation phase. It is used exactly once: at the very end of your process to simulate live trading.
If the strategy fails on the holdout data, it must be discarded; tweaking it based on holdout results essentially turns that data into “In-Sample” data.
- Window Sizing:
The length of your validation window depends on your strategy’s trade frequency.
A high-frequency trading strategy might only need 3 months of data to generate statistically significant validation metrics (300+ trades)
whereas a trend-following swing strategy might require a 3–5-year validation window to capture a complete market cycle.
Warning:
Ensure your holdout or validation datasets include periods of high volatility or market stress to prevent the strategy from performing well only in calm, trending markets.
Avoiding Data Leakage in Out-of-Sample Backtesting
Data leakage occurs when information from the validation dataset indirectly influences the model during development.
For example, you run an out-of-sample test and see weak results. Then you adjust stop-loss settings slightly and test again. That adjustment uses future knowledge. The dataset is no longer “unseen.”
To prevent leakage:
- Lock parameters before validation
- Run the out-of-sample test only once per configuration
- Keep development and validation datasets strictly separated
- Document every optimisation step
A clean out of the sample backtesting structure should feel rigid. That rigidity is what makes the results trustworthy.
Evaluating Strategy Performance in Backtesting
Backtesting is not about finding the highest return. It is about measuring reliability. A strategy that makes 80% in-sample but collapses during validation is dangerous. Proper evaluation focuses on stability, risk control, and consistency across both datasets.
How Out-of-Sample Backtesting Confirms Strategy Reliability
Out-of-sample testing is the primary filter that separates a real trading edge from a strategy that only “memorises” historical noise. Optimisation naturally fits a model to the quirks of the in-sample period. OOS backtesting removes that advantage by forcing the same rules to face unseen data—no tweaks, no excuses.
That’s why it works as a real stress test: it reveals whether your logic captures a repeatable market pattern or just explains the past.
A healthy strategy can degrade out-of-sample, but it should not break. If key metrics collapse—like a 50% drop in Sharpe Ratio or a drawdown that doubles—you’re staring at overfitting.
Compare a stable NASDAQ breakout system:
- In-sample (2017–2021): Win rate 58%, Profit factor 1.8, Max DD 12%
- Out-of-sample (2022–2024): Win rate 55%, Profit factor 1.6, Max DD 15%
That’s acceptable. The equity curve should still slope upward, and trade behaviour should look similar. Now the failure case:
- Out-of-sample: Win rate 41%, Profit factor 0.88, Drawdown 30%
That’s structural failure, not “a bad month.”
Key point:
Out-of-sample testing doesn’t guarantee profits, but it massively reduces the chance you’re trading a fake edge.
Key Performance Metrics in Backtesting for Traders
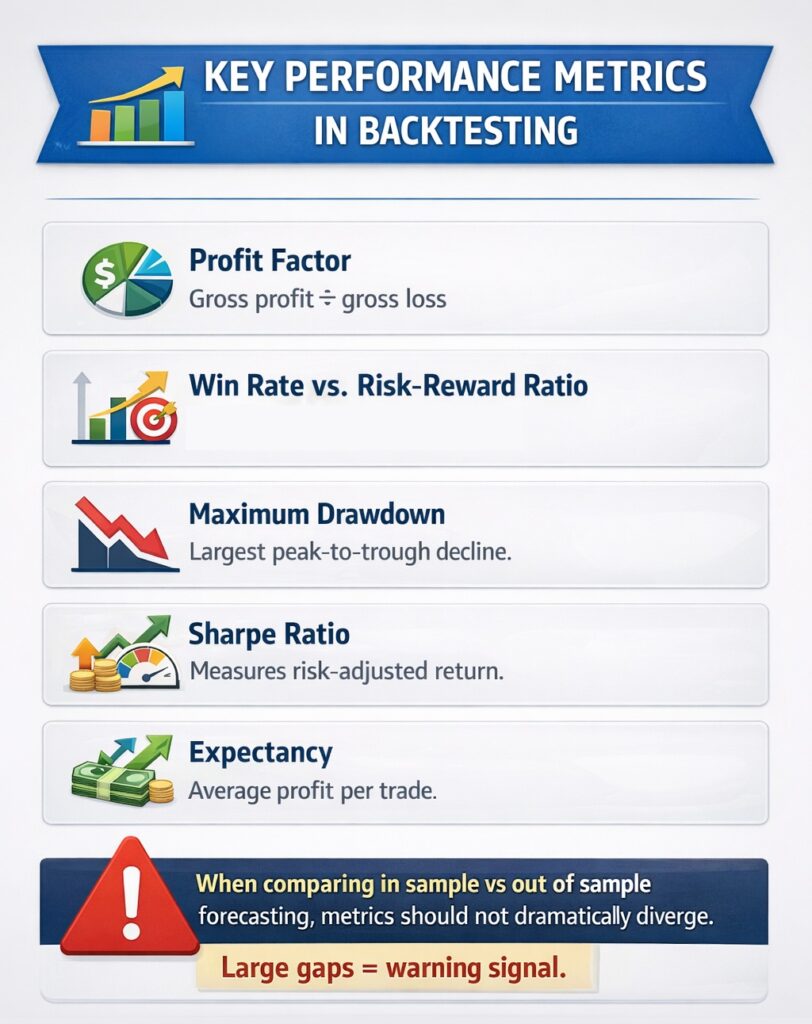
According to FXreplay, when running an out-of-sample test, focus on metrics that measure risk and stability—not just returns.
- Profit Factor: Calculated as Gross Profit divided by Gross Loss. A robust strategy typically has a profit factor greater than 1.5. Anything below 1.2 leaves minimal margin for error against slippage and commissions.
- Win Rate vs Risk/Reward: These two must be viewed together. A strategy with a 40% win rate can be highly profitable if the average winner is 3x larger than the average loser. Conversely, a high-win-rate scalping strategy requires strict loss control to survive.
- Maximum Drawdown: The maximum peak-to-trough decline in the strategy’s equity. It is the most critical metric for psychological viability; a plan with 100% returns but a 60% drawdown is likely untradeable for most investors.
- Sharpe Ratio: This measures return per unit of risk. A Sharpe ratio above 1.0 is generally acceptable, while a ratio above 2.0 is excellent.
- Expectancy: Average profit per trade.
When comparing in sample vs out of sample forecasting, metrics should not dramatically diverge.
Model Validation and Strategy Evaluation Best Practices in Backtesting
Beyond the raw numbers, the evaluation phase must rigorously question the mechanics of the strategy itself.
- Parameter Stability (Sensitivity Analysis): A robust strategy should not rely on “magic numbers.” If your moving average crossover works at length 50 but fails at 49 or 51, the strategy is unstable.
- Logical Soundness: Every strategy must have a clear economic or behavioural hypothesis (e.g., “trend following works because investors herd”). If you cannot explain why the strategy makes money, it is likely a statistical fluke that will fail out-of-sample.
- Monte Carlo Simulations: Run simulations that shuffle the order of your trades. This helps determine if your backtest results were merely a lucky sequence of trades. If 95% of the shuffled simulations result in a blown account, your strategy relies too heavily on a specific, lucky path of returns.
A useful guideline:
If the out-of-sample profit factor drops more than 30–40% from the in-sample, re-evaluate the strategy logic.
Advanced Backtesting Techniques
Basic out of sample backtesting uses one split: build on one period, validate on another.
That is good—but not enough for serious strategy development.
Markets evolve—volatility shifts. Monetary policy changes. Liquidity cycles rotate. A strategy that works in one regime may weaken in another. Advanced testing methods help you evaluate robustness across multiple time segments instead of relying on a single validation window.
Rolling, Walk-Forward, and Progressive Backtesting Approaches
If your goal is long-term survival in Forex, equities, or crypto markets, you must move beyond static in-sample vs out-of-sample testing and apply dynamic validation techniques.
The methods that simulate how a strategy adapts over time are as follows:
- Walk-Forward Optimisation
- Rolling Backtesting
- Progressive Backtesting
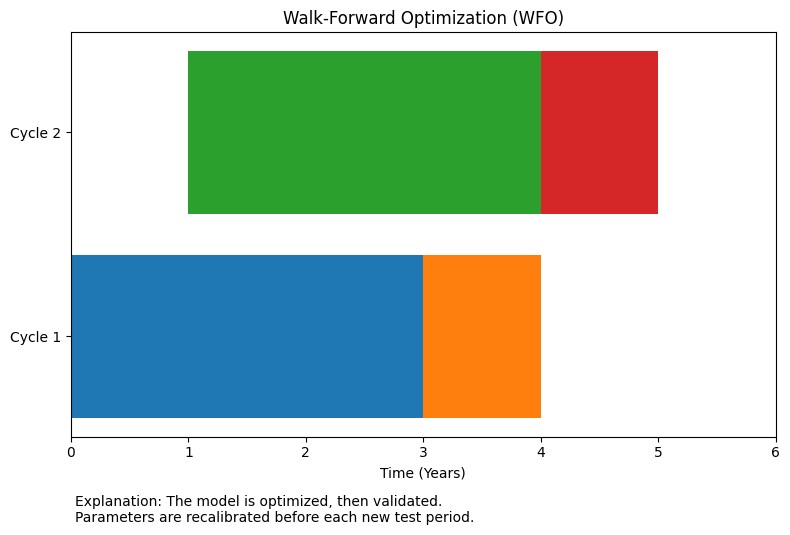
Walk-Forward Optimisation
By Walk Forward Optimisation, you optimise on one window, validate on the next, then shift the window forward and repeat.
Example:
- Optimise on 2016–2018 → Test 2019
- Re-optimise on 2017–2019 → Test 2020
This method mirrors real trading conditions where parameters are periodically recalibrated.
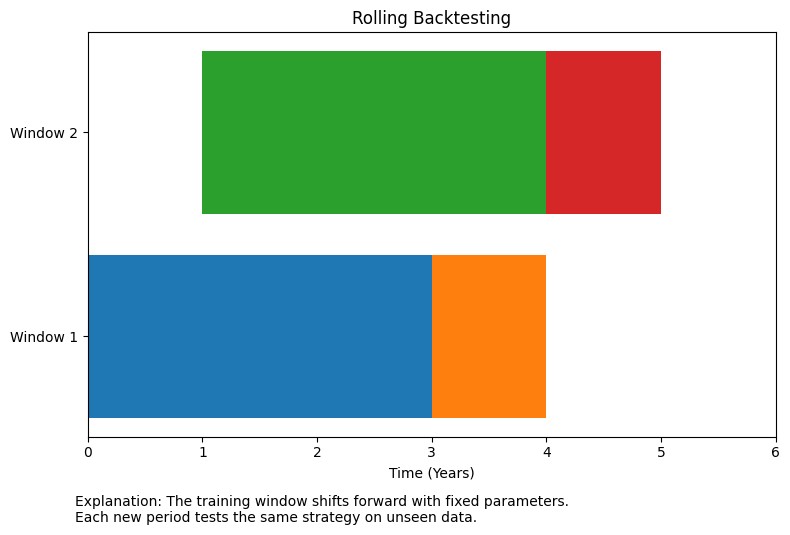
Rolling Backtesting
Similar to walk-forward, this uses a fixed-length training window that “rolls” through time. It helps identify if a strategy’s edge is persistent or if its performance is decaying over time.
Example:
- Train: 2015–2018 → Test: 2019
- Train: 2016–2019 → Test: 2020
- Train: 2017–2020 → Test: 2021
This shows that performance remains stable across different cycles.
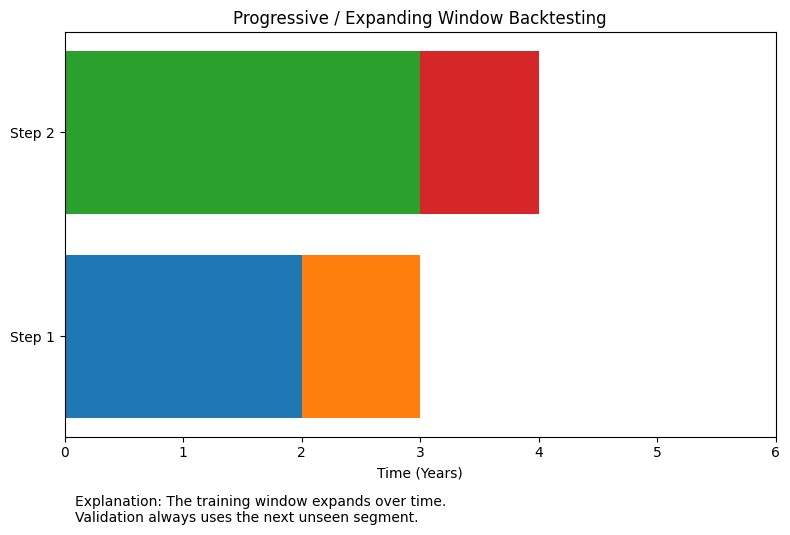
Progressive Backtesting
Also known as “Anchored” backtesting, this method keeps the start date of the training period fixed but expands the window forward. It is beneficial for strategies that require large amounts of data to reach statistical significance.
- Train: 2015–2017 → Test 2018
- Train: 2015–2018 → Test 2019
Combining In-Sample and Out-of-Sample Backtesting Results for Robust Insights
To get robust insights, don’t judge in-sample (IS) and out-of-sample (OOS) results separately; compare them side by side.
You want stability, not OOS “beating” IS. For example:
- If the IS profit factor is 2.0 and the OOS is 1.6, that’s healthy
- If OOS falls to 0.9, it likely signals overfitting.
A sound check is the OOS/IS performance ratio (like OOS Sharpe ÷ IS Sharpe); if it stays reasonably high and consistent, the model is more credible.
In walk-forward testing, stitching together only the OOS segments into a single equity curve gives a more realistic proxy for live performance.
Finally, compare results across regimes (bull/bear, trend/range): a strategy that survives only one regime isn’t robust enough for long-term trading.
Common Backtesting Pitfalls to Avoid
Backtesting can protect your capital—or destroy it. The difference lies in how honestly you test your strategy. Many traders believe they are doing proper out of sample backtesting, but hidden mistakes distort the results. These errors create false confidence and unrealistic expectations.
Overfitting and Curve Fitting in Backtests
Overfitting occurs when a trading strategy is so finely tuned to a specific historical dataset that it captures random noise rather than a repeatable market edge.
Adding too many filters or parameters often leads to “curve fitting.” While the backtest looks perfect, the strategy will likely fail in live trading because the exact conditions that prevailed in the past are unlikely to repeat.
Misinterpreting Out-of-Sample Backtesting Results
Some traders panic when the OOS profit factor drops from 2.0 to 1.6. That is healthy performance decay. Markets change.
The real red flag appears when:
- Sharpe ratio drops by 50%+
- Drawdown doubles
- Win rate becomes unstable
- Trade frequency changes drastically
Another mistake is re-optimising immediately after poor OOS results. That destroys the integrity of the validation.
Remember:
Out-of-sample testing is a reality check, not a perfection test.
Small Sample Sizes and Market Regime Blindness in Backtesting
Statistical reliability requires enough observations. For systematic strategies, a minimum of 100–200 trades is often a baseline for meaningful evaluation.
For example, if your strategy wins 8 out of 10 trades, that’s 80%. But with only 10 trades, the result is statistically weak.
Another pitfall is Market regime blindness.
According to Buildalpha, if your OOS period only covers a “quiet” market, you haven’t truly tested the strategy’s robustness.
For example, a strategy optimised during a ten-year bull market will likely fail during a sudden flash crash or a prolonged sideways range.
Conclusion
Out-of-sample backtesting is your reality check. It forces a strategy to prove itself on unseen data, where curve-fitting can’t hide. When you separate in-sample vs out-of-sample data, lock parameters, and evaluate stability across market regimes, you drastically reduce the chance of trading a fake edge. It won’t guarantee profits—but it will help you avoid the most expensive mistake in trading: trusting a backtest that only works on paper.