


The RSI indicator is one of the most widely used technical analysis tools in financial trading. Trading strategies based on the RSI allow traders to anticipate potential changes in price trends and identify optimal entry and exit points. This article will explore these strategies, combining the RSI with other indicators, risk management within this strategy, and more.
Introduction to the RSI Indicator and Its Applications
The RSI, or Relative Strength Index, is one of the most widely used and popular tools in technical analysis, employed to measure the speed (momentum) and changes in price movements. This indicator oscillates within a range of 0 to 100 and was introduced by J. Welles Wilder in 1978. The RSI helps traders identify market conditions in terms of overbought and oversold levels and find potential reversal points by observing divergences.
This indicator’s primary application is to diagnose trend strength or weakness. This means that when the price of a currency pair or an asset reaches a high level and becomes overbought, a price correction is likely imminent. Conversely, in oversold conditions, a price rebound to the upside is anticipated.
How to Identify Overbought and Oversold Levels with the RSI
One of the most compelling applications of the RSI is identifying overbought and oversold levels. If the RSI value rises above 70, the market is considered to be in an overbought condition. This state typically signifies the potential for a price decline in the near future.
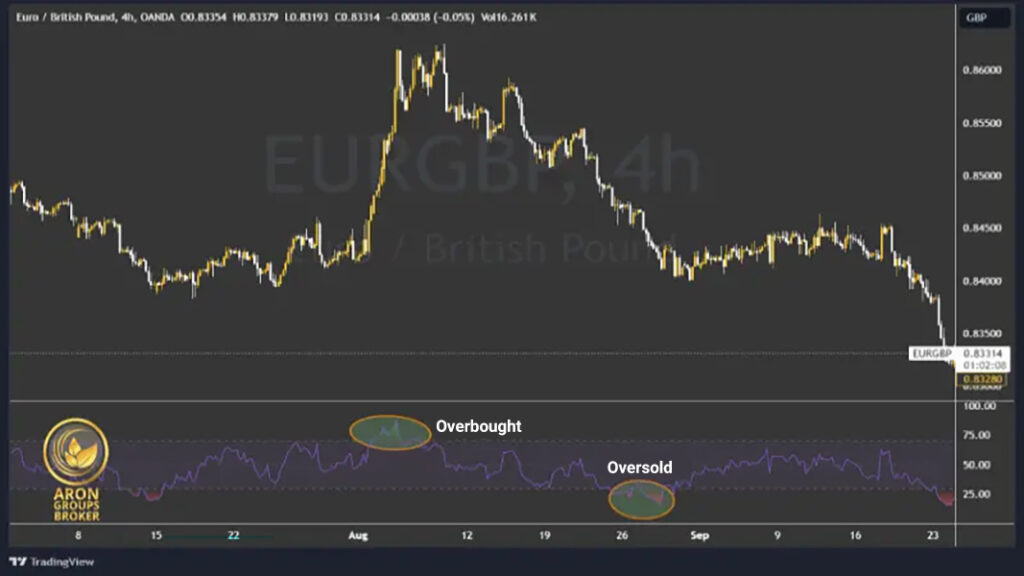
Conversely, when the RSI falls below 30, it creates an oversold condition, which is a sign of a potential price rally (or “price increase”) in the future. However, it is important to note that crossing these levels alone is not sufficient justification for entering a trade. These signals must be confirmed with other forms of analysis.
Using the RSI to Determine Entry and Exit Points
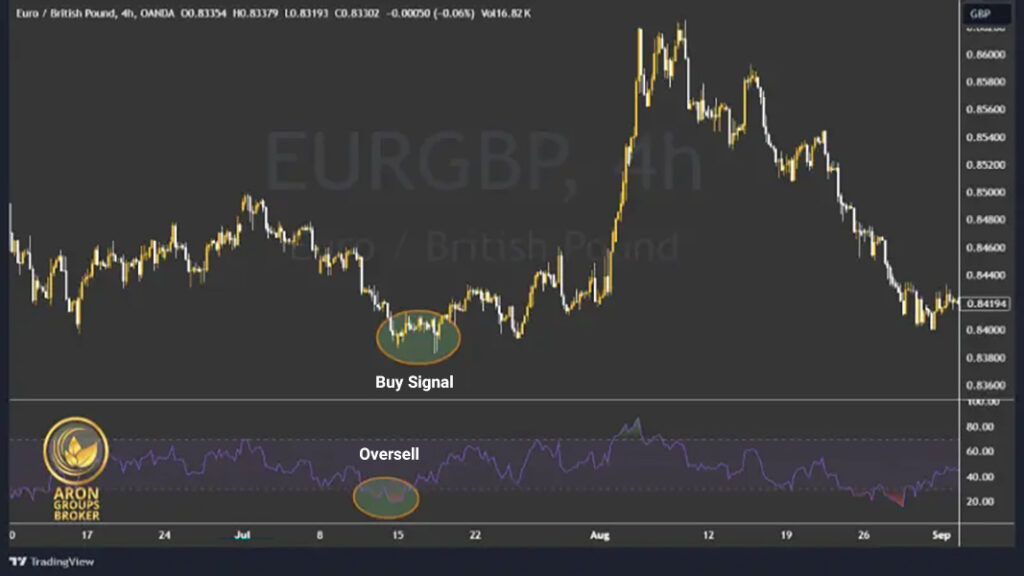
The RSI indicator can be utilized as a tool for determining long and short positions. When the RSI moves upward from the oversold region (below 30), it indicates that selling pressure in the market has peaked and a price increase is probable. Therefore, it can be used as an entry signal for a long position (buy).
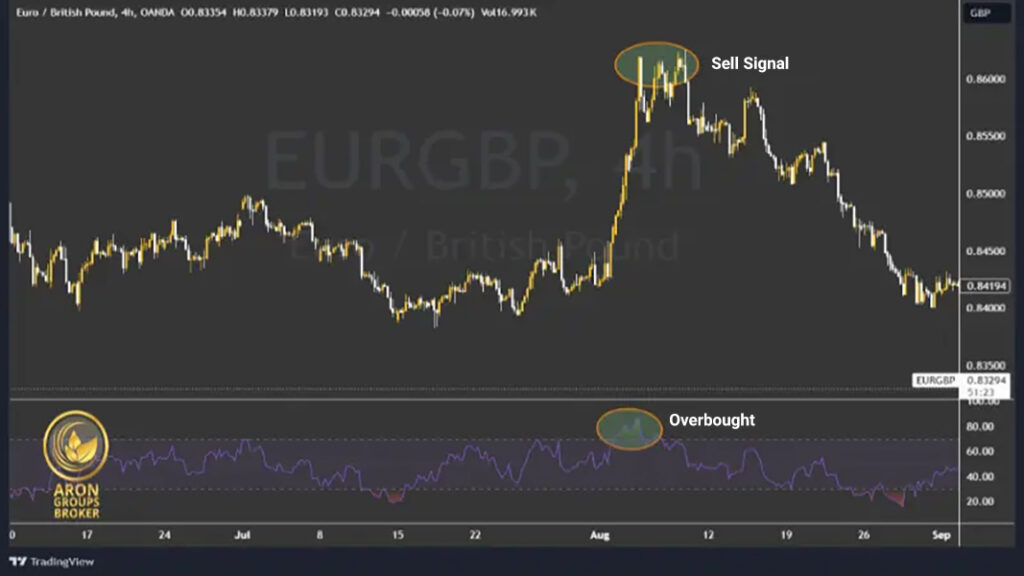
Conversely, when the RSI moves downward from the overbought region (above 70), it suggests that the price has reached a peak and a downtrend is likely to begin. This can serve as a signal for entering a short position or exiting long positions.
Risk Management Using the RSI
One of the significant applications of the RSI is in risk management. Professional traders often use the RSI to set their stop-loss levels. For example, if you receive a buy signal in the oversold region, you can place your stop loss slightly below key support levels.
Furthermore, when the RSI approaches overbought or oversold zones, it is prudent to enter trades with greater caution to avoid increased risk. For instance, any trade taken within the overbought or oversold zones that goes against the prevailing market trend (counter-trend) should preferably be executed with half the usual risk.
Additionally, using the RSI in conjunction with other indicators can help mitigate trading risk and filter out false signals.
Combining the RSI with Other Indicators
Combining the RSI with other technical indicators can significantly increase the accuracy of trading signals. For example:
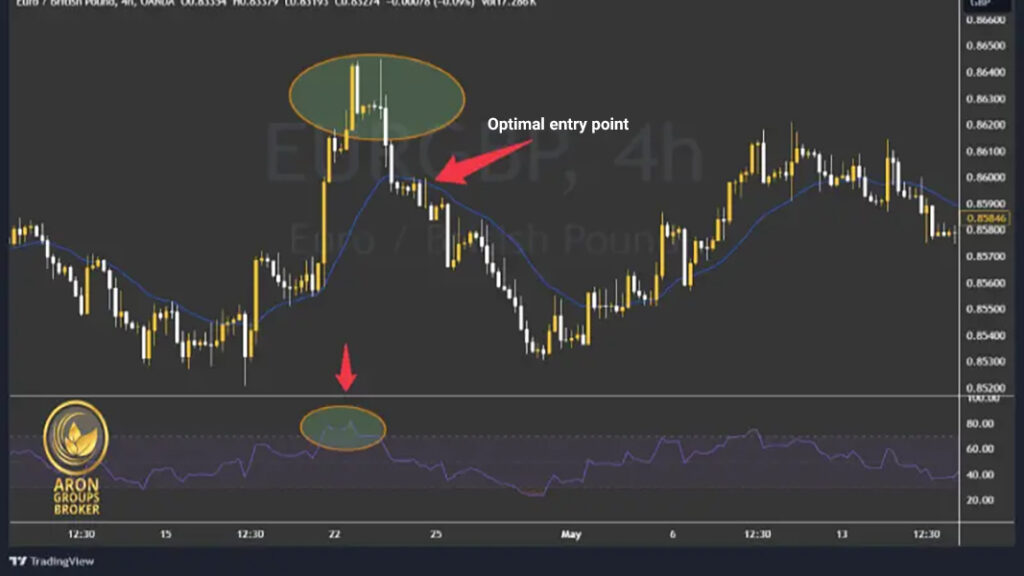
- Moving Average (MA): Using a Moving Average alongside the RSI can help traders identify strong trends. If the RSI provides a buy signal while the price is also above the Moving Average, the signal is considered more valid. Often, price pullbacks to the Moving Average area, when confirmed by the RSI, result in profitable trades. Observe the chart below:
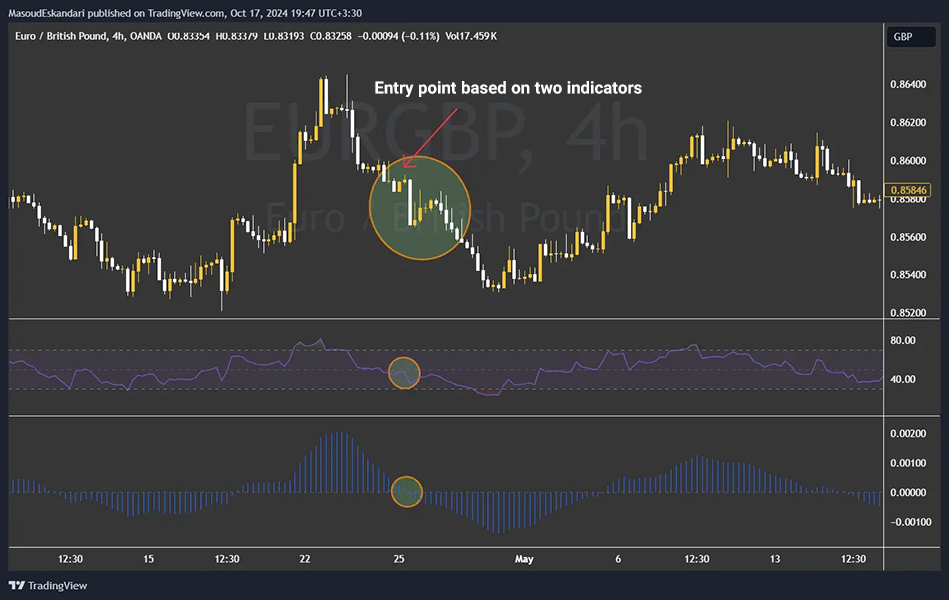
- MACD: The MACD indicator is another popular tool in technical analysis. If both the RSI and the MACD provide a similar signal simultaneously (such as a centerline cross or signal line crossovers), the probability of a successful trade increases. Observe the chart below:
The Psychology of RSI Strategies
When using any indicator, paying attention to psychological factors plays a vital role in a strategy’s success. The RSI indicator may provide signals that cause anxiety or excitement in traders. For example, in conditions where the RSI is in the oversold region, many traders might enter the market prematurely, which can lead to unwanted losses.
Given that indicators derive their data from price, they inherently have lags that must be considered in trading and psychological management. As mentioned in previous sections, using complementary indicators or employing the RSI as a confirmation tool within a trading strategy can play a significant role in one’s trading psychology. Furthermore, traders must learn to control their emotions and act solely based on available data, not on emotional reactions.
Advantages and Disadvantages of Using the RSI Indicator
RSI Indicator Advantages
- Ease of Use: The indicator is simple to apply for market trend analysis and does not require complex mathematical or technical knowledge.
- Visual Clarity: Its visual and comprehensible nature helps traders quickly identify critical points and levels on the price chart.
- Identifies Reversal Points: It effectively spots overbought and oversold conditions, alerting traders to potential price reversals. This is highly valuable for those seeking trend reversal opportunities.
- Versatility: It is flexible and can be applied across various timeframes (from short-term to long-term), making it adaptable to different trading strategies.
RSI Indicator Disadvantages
- False Signals: The RSI is prone to generating inaccurate signals, especially in markets with high volatility (or “choppy markets”).
- Signal Lag: The indicator inherently lags behind the price. This means actual price changes may occur before the RSI reflects them, requiring traders to use it with caution.
The Impact of Market Volatility on the RSI Indicator
Market volatility has a direct impact on the RSI’s performance. In highly volatile markets (or “choppy markets”), the indicator may quickly enter overbought or oversold zones and produce false signals. Conversely, in calm, low-volatility markets, the RSI can effectively identify trends and provide suitable entry and exit points.
An important tip when using this indicator is to combine it with other indicators that determine trend strength. For example, by using the Ichimoku indicator to find the trend’s direction, a trader can use the RSI to enter trades during price corrections (pullbacks).
Timing Entry and Exit Using the RSI
One of the keys to success when trading with the RSI is properly timing entries and exits. This timing is typically determined by analyzing multiple timeframes. For instance, if the RSI generates a buy signal on a long-term timeframe but remains in an overbought condition on a short-term timeframe, it is best to wait for a suitable entry point when conditions align on both.
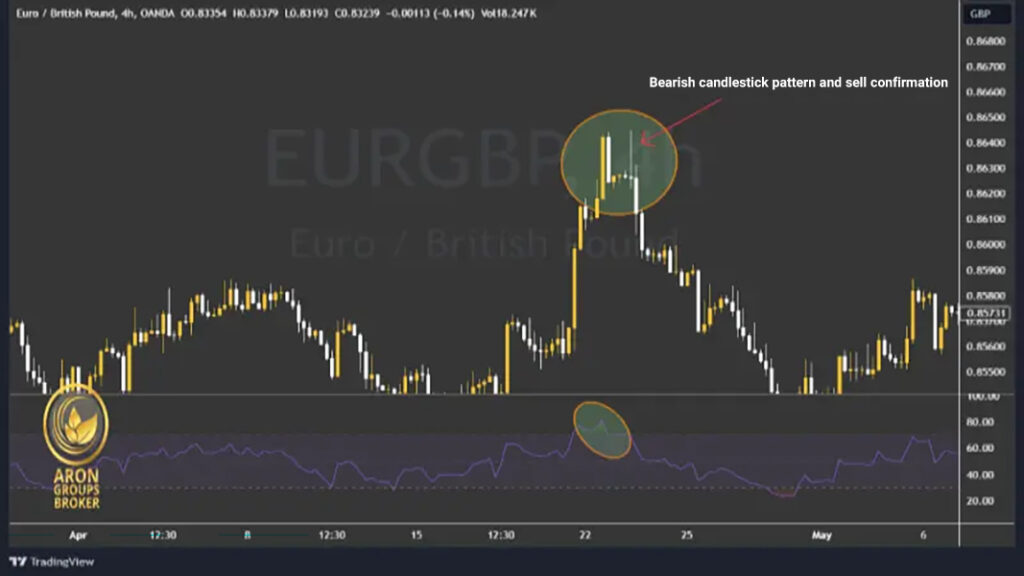
Furthermore, the RSI can be combined with price patterns, such as candlestick patterns, to derive better entry and exit signals. For example, the chart below illustrates a combination of candlestick patterns and the RSI.
Comparing the RSI Indicator with Other Indicators
The RSI acts faster compared to indicators like the MACD and can provide earlier signals of potential trend changes. However, the MACD typically offers more confirmation signals and gives traders deeper insight into long-term trends.
In contrast, Bollinger Bands focus more on price volatility and are also highly effective at identifying overbought and oversold zones. The RSI is primarily used to assess price momentum, whereas Bollinger Bands emphasize shifts in market volatility.
Conclusion
The RSI indicator can be used as an excellent tool within a broader strategy. However, if the indicator is treated as the primary strategy itself, trading solely based on overbought and oversold zones, the trader requires significant psychological discipline (or “a steady mindset”) and exceptionally strong money management. This is necessary to remain composed and adhere to the defined strategy, especially when encountering false signals.
Source: capital, Investopedia


