The financial markets are often viewed through the lens of potential profit. However, seasoned professionals focus primarily on the probability of survival. This fundamental shift in perspective separates those who thrive from those who eventually vanish. Understanding the risk of ruin is the first step toward long-term consistency.
In this blog post, we will explore the “Risk of Ruin Table,” explain key concepts such as win rate, payoff ratio, and sequence of returns risk, and provide actionable insights on how to calculate and mitigate the risk of ruin in your trading journey.
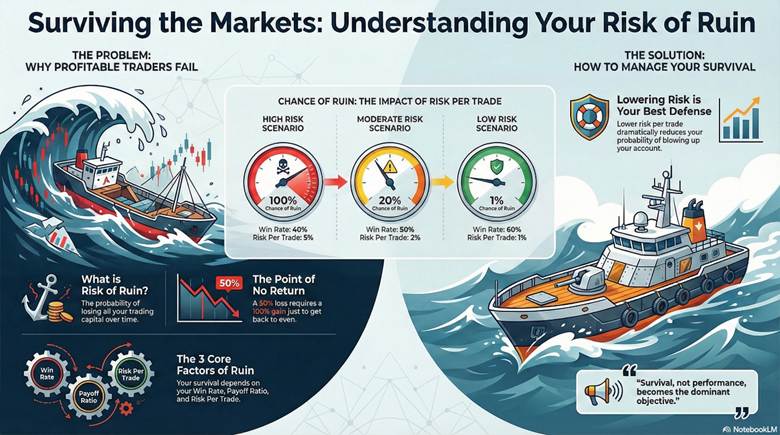
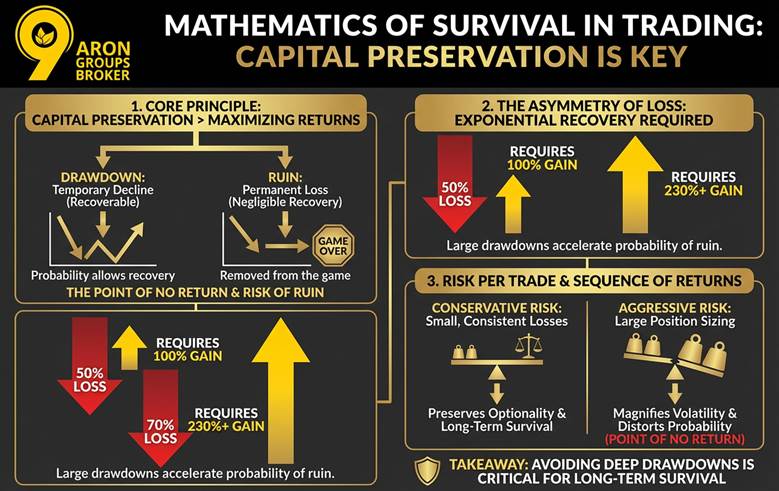
- Long-term survival in trading depends more on controlling risk exposure than on short-term profit or hit rate performance.
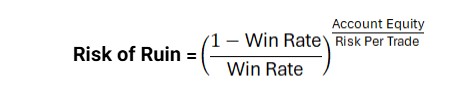
- The probability of ruin accelerates exponentially with higher risk per trade, making position sizing the most critical driver of survival.
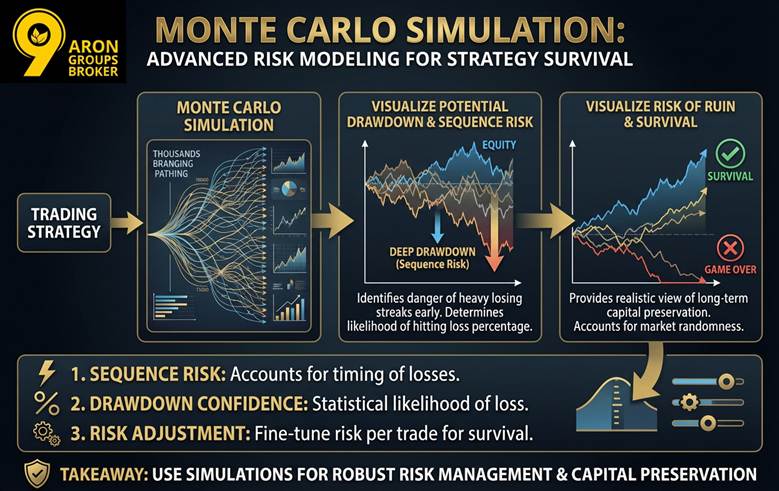
- The sequence of returns risk means identical statistical strategies can perform very differently depending on the order of wins and losses.
- Even with a positive edge (profitable strategy), failure to manage drawdowns can erase equity faster than historical backtests predict.
What Is Risk of Ruin in Trading?
Risk of ruin is a probability-based metric that estimates the chance a trader will completely lose their trading capital over time. It does not measure a single losing trade, but the long-term outcome of repeated risk decisions under uncertainty.
In professional risk management, risk of ruin is treated as a capital survival problem, not a performance metric. This probability is driven by how often you win, how much you risk per position, and how efficiently profits outweigh losses.
Even a profitable strategy can still carry a high risk of ruin if position sizing is aggressive. This is why traders must evaluate the risk of ruin before focusing on returns.
Core variables that define risk of ruin include:
- Win Rate (Strike Rate): The percentage of trades that close with a profit over a statistically meaningful sample.
- Risk Per Trade: The fixed percentage of account equity exposed to loss on each position.
- Payoff Ratio (Risk to Reward): The average profit earned relative to the average loss when a trade fails.
These variables interact non-linearly, meaning small changes in risk per trade can drastically alter the probability of ruin.
According to Investopedia, risk of ruin highlights how poor capital management can override a positive trading edge.
Did You Know?
A strategy with a high win rate can still reach account ruin if losses are larger than gains on average.
Mathematics of Survival in Trading: The Point of No Return and Risk of Ruin
The mathematics of survival explains why protecting trading capital is more important than maximising short-term returns. The Point of No Return describes the stage where losses make recovery statistically improbable. At this stage, the risk of ruin rises sharply, even if the trading strategy itself remains unchanged.
This concept is central to professional risk management and capital preservation frameworks. It clarifies why many traders fail despite having profitable systems on paper. Survival, not performance, becomes the dominant objective.
The Difference Between Drawdown and Ruin
A drawdown represents a temporary and mathematically recoverable decline in account equity. Ruin, however, defines a permanent loss state where the probability of recovery becomes negligible. Confusing these two concepts leads traders to underestimate their true risk of ruin.
Drawdowns allow probability to recover over time. Ruin removes the trader from the game entirely. This distinction is foundational to understanding long-term survival in financial markets.
The Mathematics Behind the Point of No Return
Capital loss follows an asymmetric mathematical structure that favours losses over gains. As losses deepen, the required return to recover increases exponentially. This is why large drawdowns accelerate the probability of ruin.
For example, a 50% loss requires a 100% gain to break even. A 70% loss requires more than a 230% return to recover fully. These figures illustrate the unforgiving nature of compounding against the trader.
Why Risk Per Trade Accelerates Ruin
Risk per trade plays a decisive role in how quickly a trader approaches the point of no return. Higher position sizing increases volatility and magnifies sequence of returns risk. Even a strong win rate cannot compensate for excessive exposure.
- Small, consistent losses preserve optionality.
- Large losses compress decision-making and distort probability.
This is how poor risk control transforms drawdown into ruin.
According to ACY, avoiding deep drawdowns is more critical to long-term survival than achieving high returns.
Risk of ruin does not increase linearly; once critical drawdown levels are reached, survival probability collapses rapidly.
Trading Risk of Ruin: Calculating Your Probability of Account Failure
A risk of ruin table is a practical framework that converts abstract probability into visible, decision-driven outcomes. It shows how win rate and risk per trade interact to determine the probability of total account failure. This table is widely used because it translates trading behaviour into survival consequences.
Rather than analysing single trades, the table reflects repeated exposure to market uncertainty. It highlights how small increases in position sizing can radically change long-term survival odds. For traders, this makes the risk of ruin measurable rather than theoretical.
How to Read a Risk of Ruin Table Correctly
The columns represent win rate, while rows reflect the percentage of capital risked per trade.
Each cell shows the probability that the account will eventually reach ruin under those conditions. The table assumes consistent execution and no external capital injections.
| Win Rate | Risk Per Trade (%) | Risk of Ruin (%) |
|---|---|---|
| 40% | 5% | 100% |
| 50% | 2% | 20% |
| 60% | 1% | 1% |
These figures reveal why capital preservation dominates performance metrics. A moderate win rate cannot offset excessive risk per trade. This is the core logic behind professional risk frameworks.
According to XS.com, professional traders use risk of ruin tables to define acceptable loss thresholds rather than waiting for full account depletion.
Using a position size calculator helps traders visualise how small changes in exposure dramatically alter survival probability.
Why the Table Is So Effective for Traders
The risk of ruin table removes emotional bias from risk decisions. It forces traders to confront the statistical cost of aggressive exposure. This makes it one of the most persuasive tools in risk education.
What the table clearly demonstrates:
- Higher win rates do not guarantee survival if position sizing is excessive.
- Lower risk per trade dramatically reduces the probability of account blowout.
- Risk of ruin responds exponentially, not linearly, to changes in exposure.
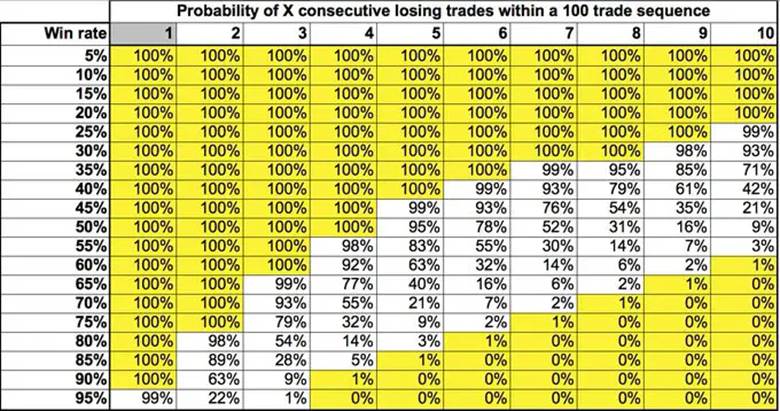
Q: Does the risk of ruin table assume perfect execution?
A: Yes. Real-world errors often increase the actual probability of ruin beyond table estimates.
Monte Carlo Simulation: Advanced Risk Modelling for Trading Strategy Survival
A Monte Carlo Simulation uses thousands of random iterations to predict the probability of various outcomes within a trading system. This method helps traders account for the “sequence of returns” risk, which simple averages often ignore during backtesting.
By simulating different trade sequences, you can visualise the potential drawdown and risk of ruin your account might face. This advanced statistical approach provides a realistic view of how market randomness impacts your long-term capital preservation goals.
Why Pro Traders Use Random Simulations
Standard backtesting only shows one historical path, whereas a simulation explores thousands of possible future scenarios for your strategy. This depth allows you to identify if a strategy is truly robust or just lucky during a specific period.
- Sequence Risk: It identifies the danger of experiencing a heavy losing streak early in your trading career or account lifecycle.
- Drawdown Confidence: You can determine the mathematical likelihood of your account hitting a specific loss percentage during active trading.
- Risk Adjustment: Simulation results help you fine-tune your risk per trade to ensure your strategy survives extreme market volatility.
Q: How does a Monte Carlo Simulation differ from standard backtesting?
A: Backtesting looks at one historical sequence, while simulations shuffle those trade results to test thousands of different random variations.
Calculating Risk of Ruin: Using Excel for Advanced Trading Risk Management
The Risk of Ruin formula is an essential tool for traders who want to quantify their probability of capital exhaustion. By inputting your specific performance data into Excel, you can objectively determine if your current risk management strategy is sustainable.
This mathematical approach removes emotional bias, allowing you to see how small changes in your win rate impact survival. Using an automated spreadsheet ensures you can monitor your drawdown risk in real-time as your account equity fluctuates.
According to Grokipedia, the risk of ruin originates from the gambler’s ruin problem, which proves that repeated exposure eventually leads to failure without strict capital constraints.
The Risk of Ruin Excel Formula
To calculate your survival probability, use the following formula structure, which accounts for your edge and your total exposure. In Excel, you can represent this formula using the power function to determine your long-term statistical safety.
- Win Rate: Enter your historical percentage of winning trades as a decimal (e.g., 0.55 for a 55% win rate).
- Risk Units: This represents your total capital divided by the dollar amount you risk on each trade.
- Capital Protection: Use this formula to test how lowering your position size can exponentially reduce your chances of account failure.
Key Insight:
A simple Excel formula can reveal hidden fragility in trading strategies long before losses become visible on the equity curve.
Conclusion
While you can never fully eliminate the Risk of Ruin, adopting a professional risk management mindset makes it manageable. By mastering the mathematical probability of loss, you ensure that individual market setbacks do not result in permanent account failure.
Every trader must accept that the potential for a total drawdown exists within any system, regardless of past performance. Success comes from using statistical tools to drive that probability toward zero while maintaining the discipline to follow your plan.