


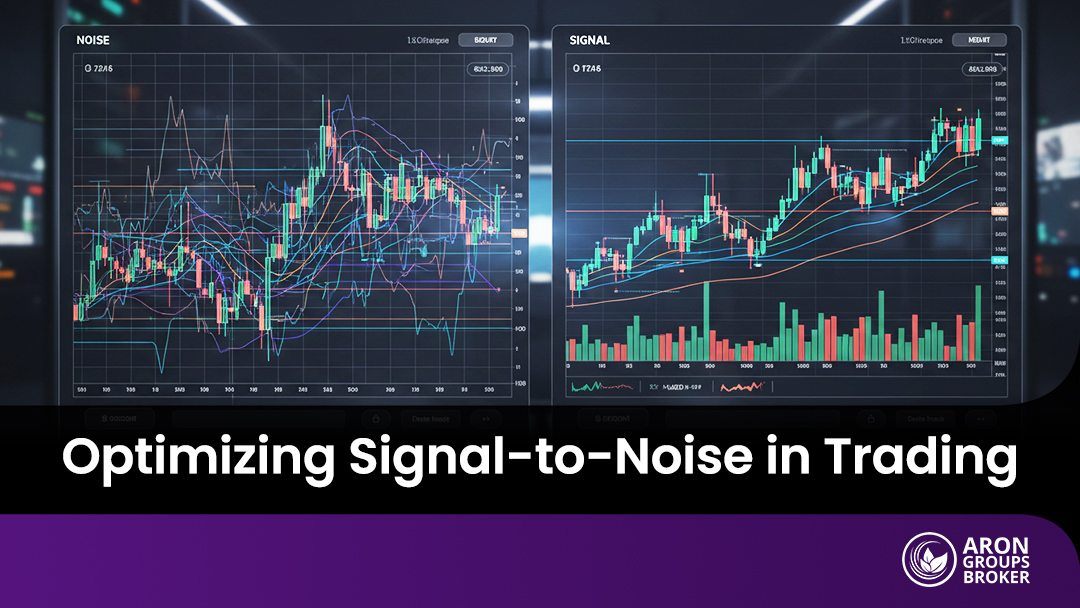


Many traders have seen a clean setup fail for no clear reason. Often, the issue is signal to noise ratio, meaning how much real information is inside the price moves. When market noise is high, even good ideas can turn into false trading signals. A simple signal to noise ratio approach helps you judge whether a pattern is worth trusting. It can also support better risk choices when results feel random. Keep reading to learn how to calculate it, spot a high signal-to-noise ratio, and avoid wasting trades on weak signals.

- A higher signal to noise ratio improves signal extraction by filtering market noise that can hide real price information.
- In signal to noise ratio finance, “good” depends on horizon, costs, liquidity, and turnover, not a fixed threshold.
- The Sharpe ratio can act as a practical signal versus noise proxy, but short samples and smoothing can inflate it.
- Low SNR increases overfitting risk, so protect training data vs unseen data using time-aware validation like purging and embargo.
What is Signal-to-Noise Ratio (SNR) in Trading?
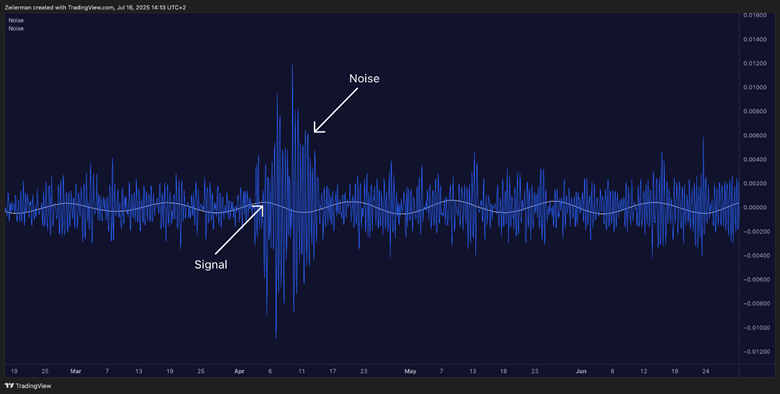
What is signal to noise ratio in trading is a simple question: how much of a price move is useful information. The standard signal-to-noise ratio definition compares a desired signal with background noise.
In practice, the signal is a repeatable edge from an indicator, feature, or forecast you can test. Noise is randomness, regime shifts, and microstructure effects that distort short-term moves in noisy market data.
Markets also use “noise” as a formal concept. It refers to misleading activity that obscures real trends, making interpretation harder.
You may also see signal noise ratio and noise-to-signal ratio used for the same idea. For systematic measurement, quantitative trading helps you compare signals consistently.

Key Point:
A strategy can be right often and still lose. Small average gains, large losses, and costs can erase accuracy, so SNR can remain weak.
Why SNR Matters in Trading?
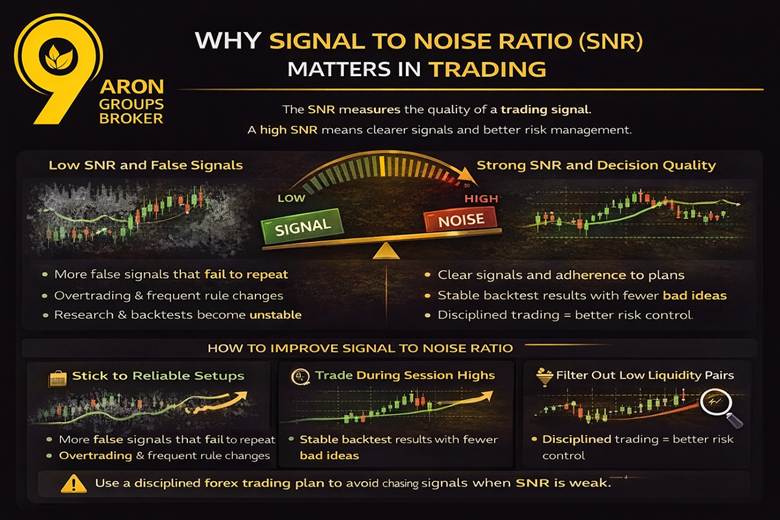
The significance of signal to noise ratio is simple. It shapes decision quality and confidence in every trade. With a poor signal to noise ratio, patterns can look convincing but fail to repeat.
Low SNR increases false trading signals, especially when markets are choppy. According to axiory, that pushes traders into overtrading and frequent rule changes.
It also harms signal extraction during research and testing. Backtests can turn unstable because false positives rise when you test many ideas.
Strong data quality in trading helps you avoid bad inputs that create misleading results. Better data support more reliable decisions and risk estimates.
Use a disciplined forex trading plan to avoid chasing signals when SNR is weak.
Q: Does low SNR mean you cannot trade profitably?
A: No. Edges can be small yet consistent, but costs and discipline decide whether the edge survives.
Calculating and Interpreting SNR
This section shows a practical way to turn SNR into a number you can monitor. You will use simple proxies that fit trading data and changing market regimes.
What is the Formula for SNR and Its Key Components?
A classic signal to noise ratio formula is signal power divided by noise power. This framing keeps the signal-to-noise ratio explained idea clear, even without heavy maths.
For trading, a common proxy uses the mean divided by the standard deviation of a series. This approach is often used in signal-to-noise ratio statistics when power is hard to estimate.
In signal to noise ratio data analysis, define signal as your forecast, factor score, or expected return. Define noise as volatility, forecast error, or residual variation from the model.
More Info:
According to Wikipedia, if signal and noise use different units, normalise first with z scores or standardisation.
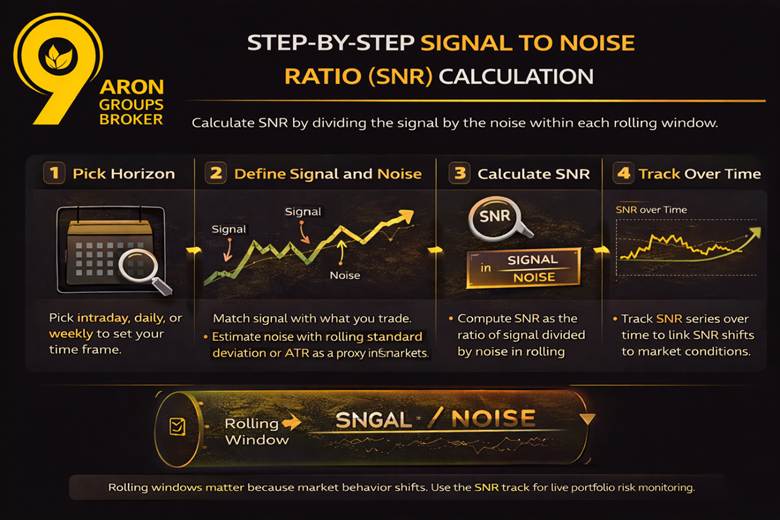
Step-by-Step SNR Calculation
Pick your horizon first, such as intraday, daily, or weekly. This choice affects signal-to-noise ratio, time series behaviour and stability.
Build a signal series that matches what you actually trade. Then choose a noise estimate, such as the rolling standard deviation of errors.
You can also use ATR as a volatility proxy for noise in fast markets. Then compute signal to noise ratio calculation as signal divided by noise within each rolling window.
This is the core of how to calculate signal to noise ratio for live monitoring. Track signal to noise ratio (SNR) over time, not as a one-off number.
Rolling windows matter because market behaviour changes across regimes. For risk inputs, link volatility assumptions to determining portfolio risk.
Examples of High vs Low SNR in Trading Data
A high signal-to-noise ratio often appears when a trend signal stays stable across nearby windows. It also survives realistic costs without collapsing into randomness.
A low signal-to-noise ratio is common when an oscillator flips frequently in ranges. That environment increases false trading signals and frustration in noisy market data.
A good signal to noise ratio should not disappear after small parameter changes. If it vanishes quickly, you likely measured noise rather than signal.
| Example | What signal is | What noise is | Typical outcome |
|---|---|---|---|
| Trend filter | Directional drift across weeks | Short-term reversals | Fewer trades and steadier results |
| Mean reversion | Snap back after extremes | Regime change in volatility | Works only in suitable regimes |
| Range oscillator | Frequent crossings | Choppy movement | More false trading signals |
Practical Applications of SNR in Trading
SNR becomes useful when it changes what you do in real time. It helps you prioritise information and reduce mistakes caused by randomness in prices.
How to Identify Reliable Trading Signals in Noisy Markets?
Treat market noise as the default state, not an exception. Then use SNR to rank candidate features for signal extraction from noisy market data
Compare signals across multiple instruments and regimes, not one recent sample. Walk forward testing helps confirm whether a signal survives changing conditions.
Filtering and aggregation can reduce market noise before measuring SNR. Simple smoothing can make patterns easier to evaluate, but it must be tested carefully.
Instrument choice also matters, especially across sessions and liquidity conditions. This is where forex trading fits naturally into signal selection and validation.
How to Improve Data Quality for Better Signal Extraction?
Better data quality in trading raises the chance your SNR reflects reality, not errors. Survivorship bias and look-ahead bias can inflate results and distort signal tests.
Sampling frequency matters because very high frequency data can include microstructure noise. According to nber, Research shows microstructure noise affects inference and sampling choices.
For signal-to-noise ratio data analysis, standardise inputs and align timestamps. Winsorising outliers can reduce damage from bad ticks and extreme prints.
Clean data supports information vs randomness decisions with fewer hidden distortions. That makes your measurements more consistent across instruments.
Did You Know:
Low-quality labels can cap SNR even when features look strong in research. Weak targets limit learning, so signals may not generalise.
Using SNR to Minimise False Trading Signals
A rolling SNR gate can reduce false trading signals during unstable conditions. Trade only when rolling SNR clears a threshold that fits your costs and turnover.
Combine SNR gating with regime filters, such as trend and volatility conditions. This matters because a poor signal-to-noise ratio increases false positives.
The trade-off is fewer trades, but higher average setup quality. That is the practical significance of signal to noise ratio for execution discipline.
Use signal noise ratio consistently so definitions stay stable in your research notes. If you prefer the inverse framing, define it clearly once and keep it consistent.
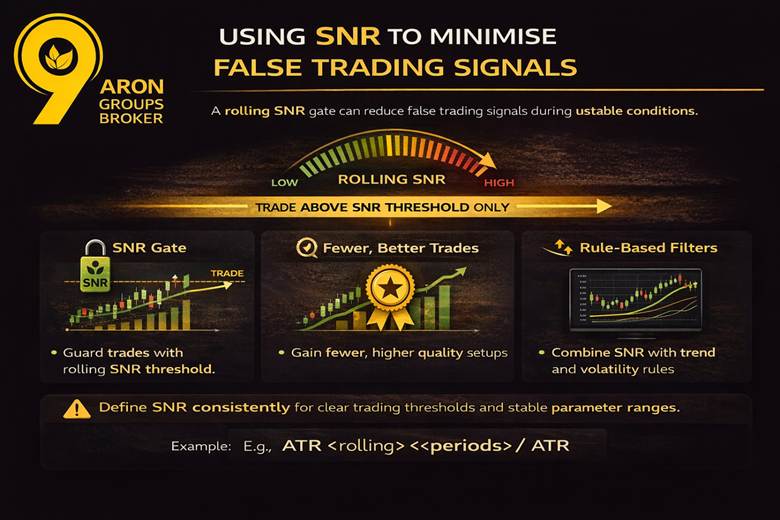
How Does SNR Apply in Rule-Based Trading Strategies?
In rule-based trading strategies, SNR helps you choose indicators that remain stable across samples. It also helps set thresholds that reduce whipsaw when conditions are unclear.
Use SNR to define robust parameter ranges, not one perfect setting. Walk forward validation can reveal whether ranges remain usable over time.
To connect signal quality with performance, use the Sharpe ratio as a reference point. A clearer signal-to-noise ratio explained framework supports more realistic expectations for stability.
SNR in Statistical and Quantitative Models
SNR helps you separate stable relationships from chance patterns in model outputs. It also explains why many “good” results fail when conditions change.
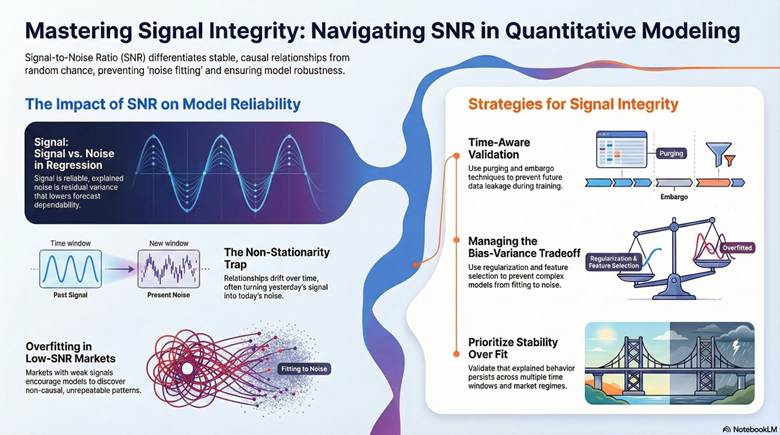
SNR in Time Series and Regression Models
In signal to noise ratio regression, “signal” is the variation your model explains reliably. It can also mean a coefficient that stays stable across samples and regimes.
“Noise” is the residual variance, which captures what the model cannot explain. Higher residual variance usually lowers the effective SNR and makes forecasts less dependable.
In signal-to-noise ratio time series, non-stationarity reduces the effective SNR over time. Relationships drift, so yesterday’s signal can become today’s noise.
This is why signal-to-noise ratio statistics rely on stability checks, not one fitted result. You want explained behaviour that persists across windows and markets.
SNR in Machine Learning for Trading
In signal-to-noise ratio machine learning, low signal markets encourage overfitting by default. Models can “discover” patterns that are not causal or repeatable.
Labels matter because weak targets cap learning even with strong features. Leakage also matters because future information can slip into training unintentionally.
Time-aware validation improves model robustness versus random splits. Purging and embargo help protect training data vs unseen data separation in financial labels.
This is exactly where machine learning in forex becomes practical, not theoretical.
Managing Bias and Variance with SNR
SNR helps explain the bias–variance tradeoff in trading models. Complex models often increase variance and start noise fitting.
Simple models can miss real structure, which raises bias and hides feature relevance. According to sciencedirect: Aim for model generalisation using regularisation, feature selection, and strong baselines.
Key Point:
Adding more features, rules, or model depth rarely creates new information in prices. It mainly increases flexibility, so the model starts fitting random fluctuations. That raises variance, makes results unstable across samples, and weakens model generalisation.
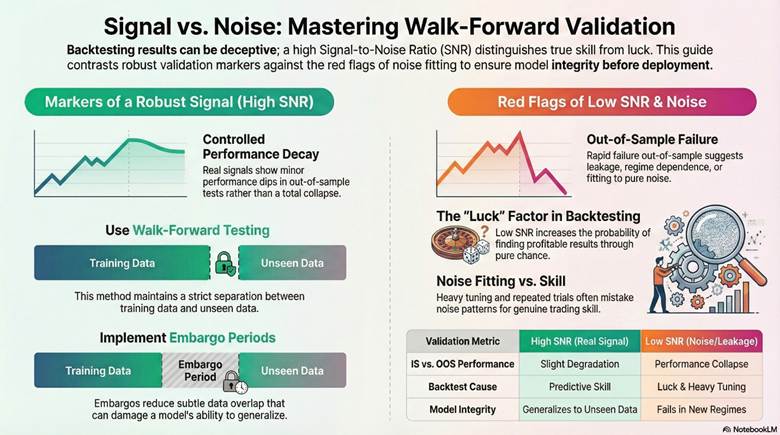
In-Sample vs Out-of-Sample Performance with SNR
If the signal is real, in-sample vs out-of-sample performance should degrade slightly, not collapse. A collapse often indicates leakage, regime dependence, or pure noise.
Use walk-forward testing to protect training data from unseen data separation. Embargo periods reduce subtle overlap that damages model generalisation.
How Does SNR Affect Backtesting Results?
Low SNR increases the chance you “find” profitable backtesting results by luck. This is a common outcome with heavy tuning and repeated trials.
A poor signal to noise ratio makes noise fitting look like skill in the sample. Stronger validation methods help expose false patterns before deployment.
Evaluating SNR for Trading Strategy Performance
This part helps you judge if your strategy signal is strong enough for live trading. It focuses on simple checks you can repeat over time.
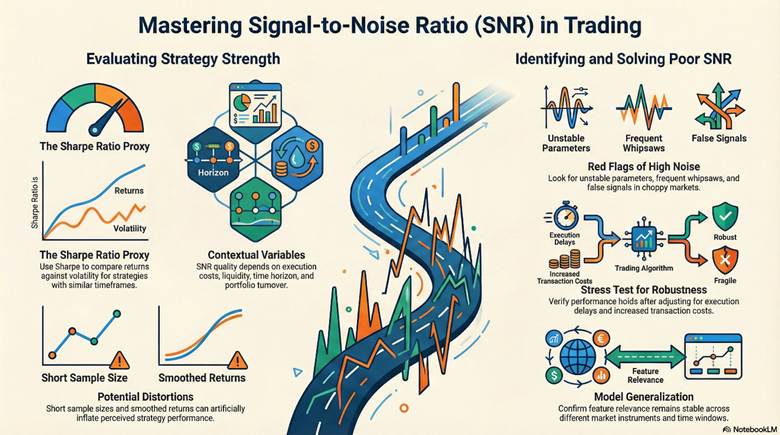
What is a Good SNR for Finance?
If you ask what a good signal-to-noise ratio is, there is no universal number.
A good signal to noise ratio depends on costs, liquidity, horizon, and turnover in signal-to-noise ratio finance.
Sharpe is a practical proxy because it compares returns to volatility. According to Investopedia, it is a risk-adjusted measure.
Use the Sharpe ratio to compare strategies with similar costs and timeframes. Be careful, because Sharpe can look better with short samples or smoothed returns.
Q: Is a high Sharpe always a high SNR strategy?
A: Not always. Sample length, regime dependence, and tail risk can distort results.
Recognising Poor SNR and Its Consequences
A low signal to noise ratio often appears as unstable parameters and changing feature behaviour. A poor signal-to-noise ratio can make backtests look strong but fail in live trading. It also increases false trading signals when market noise rises and conditions become choppy.
Common outcomes include whipsaws, higher slippage drag, and frequent rule changes. Many traders then switch strategies too often, because results feel random.
Using SNR to Assess Model Robustness and Generalisation
Check SNR across markets, time periods, and execution assumptions to improve model robustness. Stress test costs and delays, then see if performance still holds.
Track whether feature relevance stays similar across instruments and time windows. Stable behaviour supports model generalisation and reduces surprise under new conditions.
Enhancing Market Decision Making with SNR Insights
SNR can guide decisions after you have a working signal, especially when conditions shift. Use it to refine what you trade, how you trade it, and how much risk you take.
How to Leverage SNR for Feature Relevance?
Rank features by whether they improve SNR across different periods and instruments. Keep features that stay useful when you change the window or market.
Remove features that look strong in the sample but weaken out of the sample. Also, remove redundant indicators, because correlated inputs can amplify noise and instability.
Avoiding Noise Fitting and Overfitting in Strategies
Set limits on how many rules and parameters you allow. Fewer choices reduce the chance of noise fitting.
Lock your test set and never tune on it. If performance jumps only after tuning, it may be overfitting and a false discovery.
Applying SNR to Risk and Margin Management
Use SNR as a sizing input, not just a research metric. Lower SNR should mean smaller positions and stricter entry confirmation.
When volatility rises, SNR often falls, so margin use must become more conservative. Stress test sizing rules to protect model robustness when spreads widen or execution worsens.
Key Insight:
SNR acts like visibility in fog. When it drops, your signal is less reliable. Reduce position size, raise confirmation standards, and avoid aggressive margin.
Conclusion
The signal-to-noise ratio works best as a process metric, not a one-time score. When you track it consistently, your decisions become calmer and more repeatable.
Build a simple habit: measure your signal, validate it across conditions, reduce complexity, then manage risk. This routine helps you avoid impulsive changes and focus on what survives real market behaviour.
Use the signal to noise ratio to support disciplined execution, but do not treat it as certainty. All trading involves risk, and losses remain possible even with careful analysis.


