icon icon Home
icon icon Accounts
icon icon Quick start
icon icon Symbols

Market Timing Mastery: Essential Tools and Indicators for Smart Traders

Author
Abe Cofnas
Abe Cofnas
calendar Last update: 26 December 2025
watch Reading time: 10 min

With technological advancements and the widespread use of the internet, many people seeking profitable income have entered the trading market. Technical analysis is one of the best and most practical methods to analyse the market. It helps identify entry and exit points. 

Technical analysis is performed on price charts with two axes: vertical (price) and horizontal (time). Many traders mistakenly focus only on the vertical axis (price). However, a comprehensive analysis requires examining all aspects of the market. Below, we will introduce and review various time analysis tools.

bookmark
Key Points:
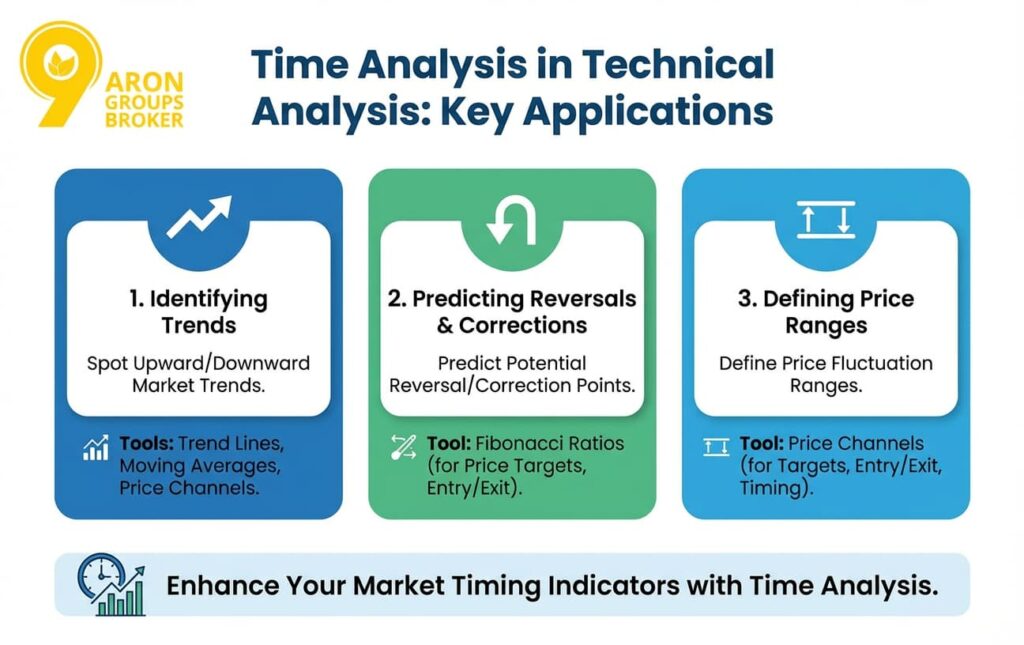
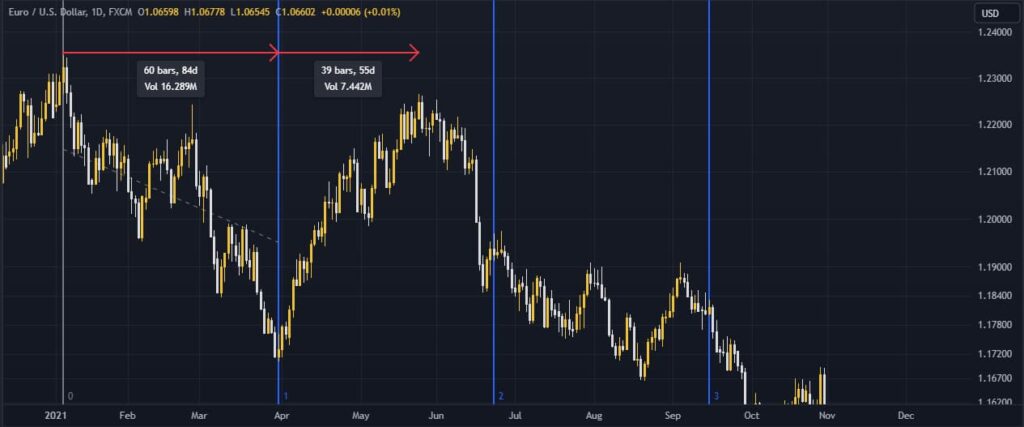
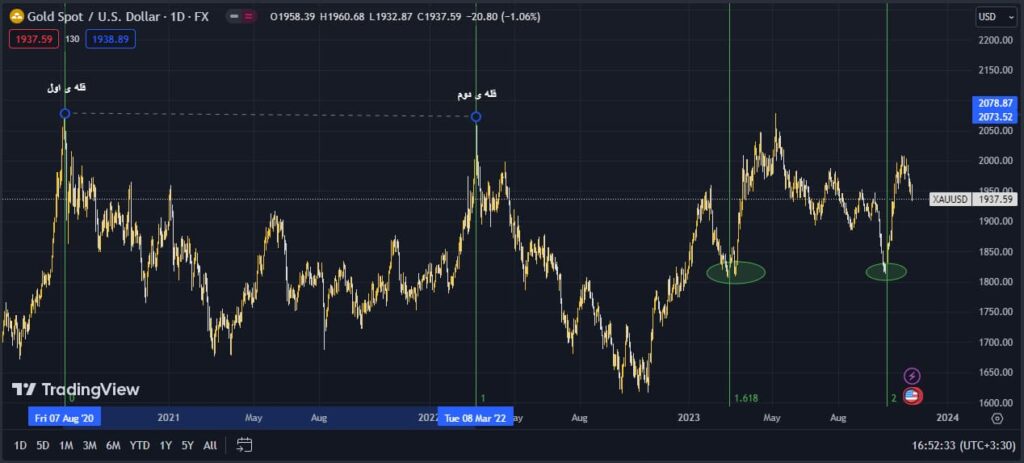
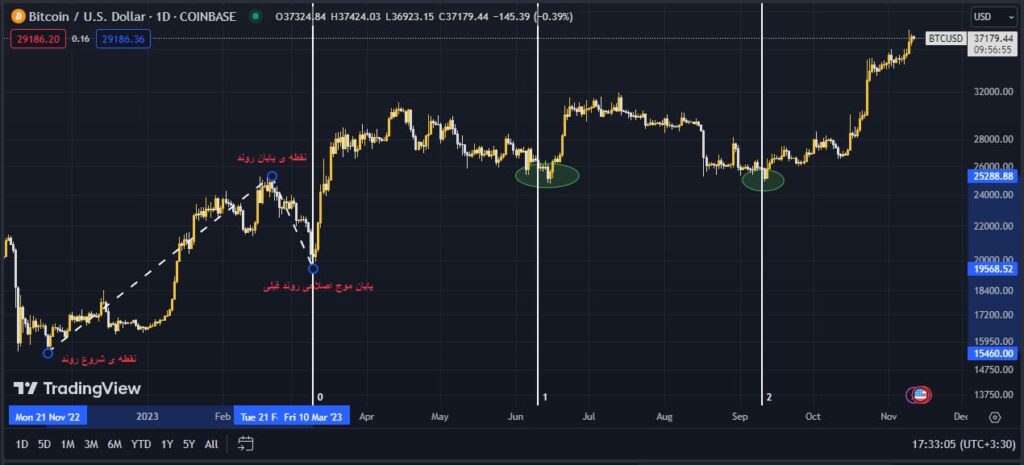
  • Combining tools like Fibonacci ratios and market timing indicators improves prediction accuracy for price trends.
  • Time analysis should be used alongside technical and fundamental analysis for comprehensive decision-making.
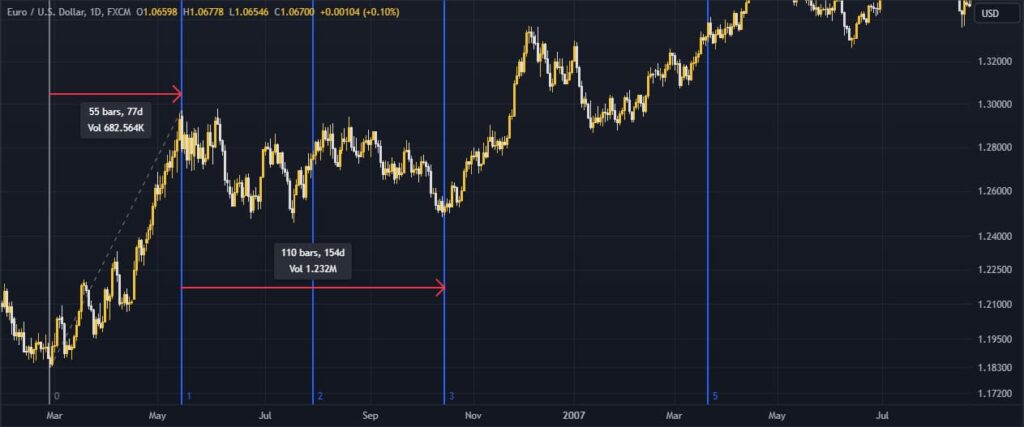
  • Price and time overlaps are essential for identifying potential entry and exit points in market trends.
  • Fibonacci ratios are useful but must be applied cautiously, as they are not always precise indicators of future price movements.

What is Time Analysis?

Time analysis is one of the two main branches of technical analysis, focusing on the study of price trends across different time periods. Time divergence analysis helps analysts identify price Behaviour patterns, allowing for more accurate predictions about future price movements.

Understanding Time Analysis in Market Timing

In time analysis, we examine the duration of past trends on the chart. By using market timing indicators, we can predict future support and resistance levels with high probability. This approach plays a key role in market timing vs time in the market.

Best Tools for Time Analysis in Technical Analysis

Time analysis is a key part of technical analysis that helps traders predict future price movements by examining past trends. By using market-timing indicators, traders can identify key entry and exit points, thereby improving their ability to time the market effectively. 

Below, we explore two essential tools for time analysis: 

  • Trend Lines,
  •  and Price Channels.

A. Trend Lines

Trend lines are simple yet highly effective tools for time analysis. They represent the overall price trend over a specific period. Upward trend lines indicate rising prices, while downward trend lines indicate falling prices.

Trend lines help traders understand the market’s general direction and enhance market timing strategies. To draw a trend line, select two extreme points in the trend and connect them with a straight line.

If the trend line breaks, a price trend change is likely. As long as the trend line holds, it suggests that the market is not yet reversing.

market timing indicators
sms-star

Key Insight

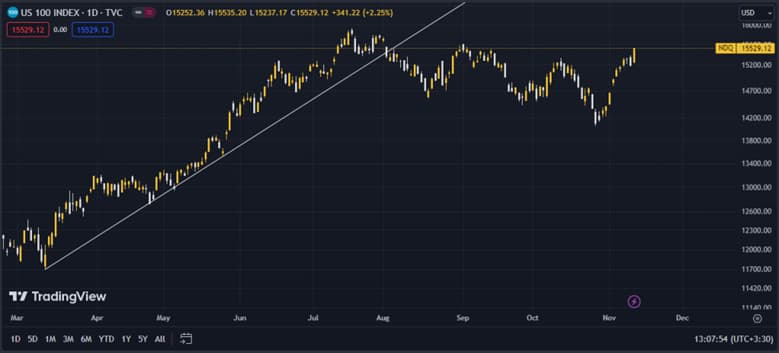
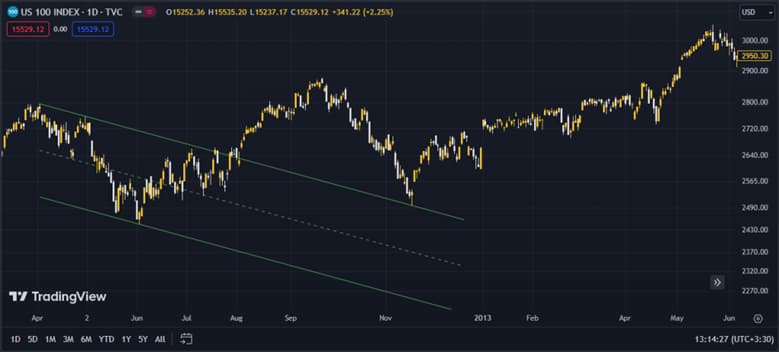
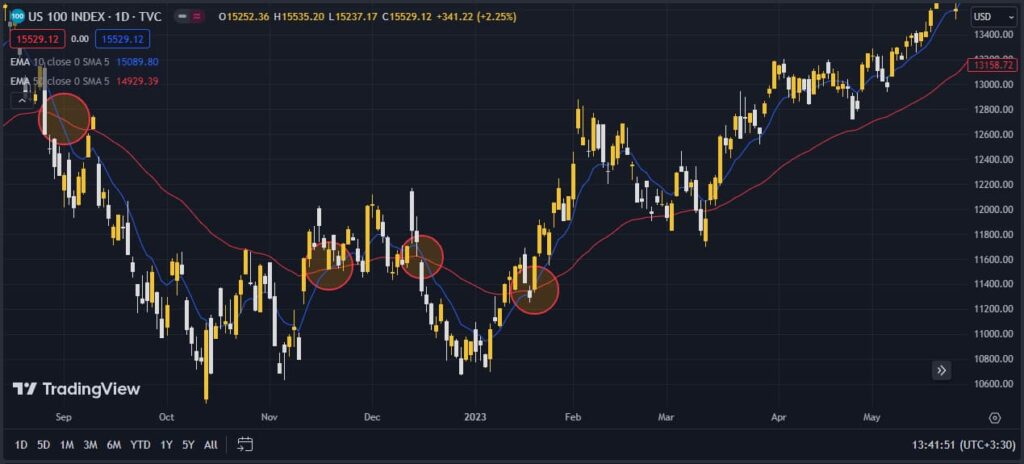
Trend lines can act as dynamic support or resistance levels. When price consistently respects a trend line, it validates the current market direction. A break of this trend line often indicates a shift in momentum.

B. Price Channels

Price channels are a more advanced version of trend lines. These channels consist of two parallel trend lines that define a price range. Price vs time analysis is essential, as the channel’s width indicates the strength of the trend. Price channels help traders identify potential market timing indicators for both entry and exit points.

When the price moves within the channel, the market is expected to continue its current trend. However, if the price breaks out of the channel in the opposite direction, a market timing model suggests a possible reversal is near.

market timing indicators

C. Time Indicators

Time indicators are tools that provide information about price trends over a specific time period. These indicators help analysts better understand price behavior patterns. Below, we will introduce and review some of these indicators:

1. Moving Averages

Moving averages are often considered a type of trend line. They represent the average of past market candles. If current candles are higher or lower than the moving averages, it can signal an upward or downward trend.

When the current candles cross a moving average, it indicates that we are likely near a market timing model or price correction.

market timing indicators

Another way to use moving averages is with two averages of different periods, such as 10 and 50. If the 10-period moving average crosses below the 50-period moving average, it often signals a potential trend reversal or price correction.

For example, during an upward trend, when the 10-period moving average falls below the 50-period moving average, a market reversal may be imminent.

market timing indicators

2. Relative Strength Index (RSI)

The RSI is another indicator used to determine potential market reversals or corrections. This indicator has two key levels: overbought and oversold. When the RSI enters these zones, it signals potential weakness in the current trend and a possible price correction or trend reversal.

market timing indicators

For example, in an upward trend, if the RSI enters the overbought zone, it suggests the upward momentum may weaken, signaling a potential reversal. Similarly, in a downward trend, if the RSI enters the oversold zone, it can indicate a possible reversal to an upward trend.

market timing indicators

A further signal for market timing can be obtained by looking for divergence between price and the RSI. 

Example: If the price is making higher highs but the RSI shows lower highs, it signals a divergence. This divergence suggests potential weakness in the trend and may indicate a possible market reversal.


Q: How can traders ensure alignment between short-term and long-term trends for better entry decisions?

A: Using a time alignment matrix, traders can compare trend reversals and corrections across multiple timeframes (hourly, daily, weekly). Overlapping points typically indicate strong continuation or reversal zones. 

In practice, if short-term trends align with long-term trends, entries can be executed with higher confidence. If they diverge, it may be wiser to wait or avoid trades. This method offers a unique, practical perspective on multi-timeframe trend coordination.

sms-star

Pro Tip

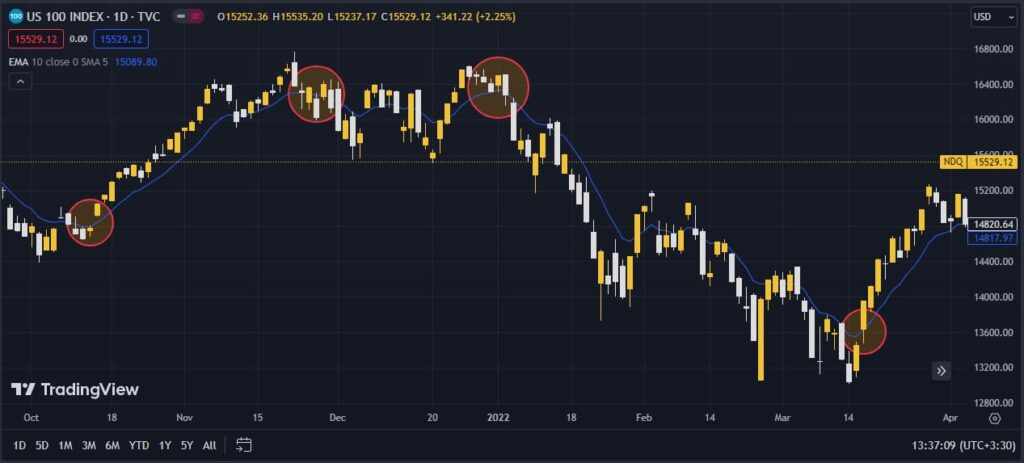
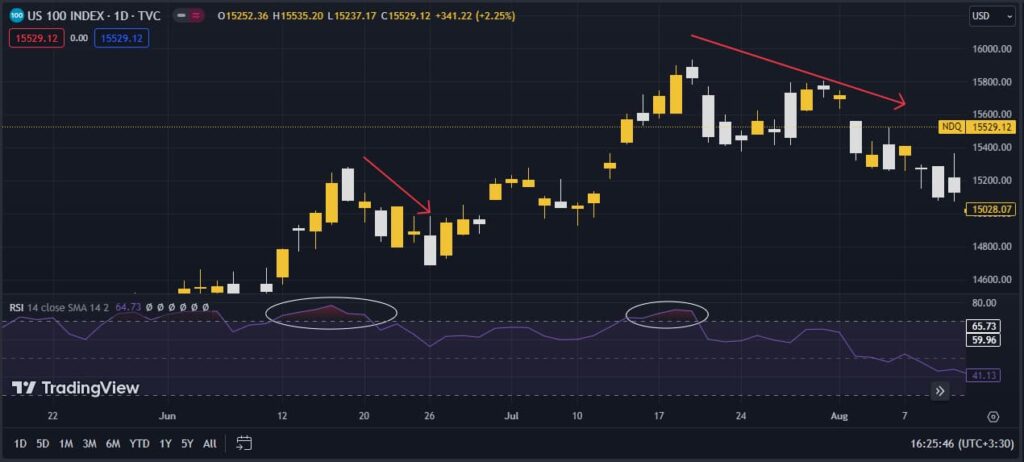
Market timing indicators such as moving averages and RSI should not be used in isolation. Combining these indicators with other technical analysis tools like volume analysis can offer more reliable trade signals and help identify market reversals with greater accuracy.

D. Time Divergence

In time divergence, there is a behavioral conflict between price and time. Here, the focus is not on the behavior of the indicator but on the duration of the trend correction (e.g., the number of candles). Time divergence is divided into two types: regular time divergence and smart time divergence, both of which we will explore below:

1. Regular Time Divergence

Regular time divergence occurs when the number of candles in the corrective wave exceeds the number of candles in the preceding trend wave. In an upward trend, regular time divergence indicates strong buying power and weak selling power.

In other words, regular time divergence happens when the price chart corrects beyond 100% of the Fibonacci Time Zone drawn on the previous trend wave.

Market Timing Mastery: Essential Tools and Indicators for Smart Traders

2. Smart Time Divergence

Smart time divergence occurs when the number of candles in the corrective wave is less than the number of candles in the preceding trend wave. This means the corrective wave does not cover 100% of the previous trend wave. To identify smart time divergence, Fibonacci Time Zones need to be plotted.

market timing indicators

Q: How can traders use non-linear time patterns to anticipate sudden market moves?

A: Markets rarely move in perfectly linear trends. By analysing uneven time intervals between highs and lows and identifying clusters of volatility in shorter intervals, traders can anticipate potential price reversals or sharp moves before they occur. For example, if new lows appear in shorter-than-usual intervals, it signals rising selling pressure and a possible strong correction. This approach is beneficial in highly volatile markets, such as crypto or precious metals.

sms-star

Source Box

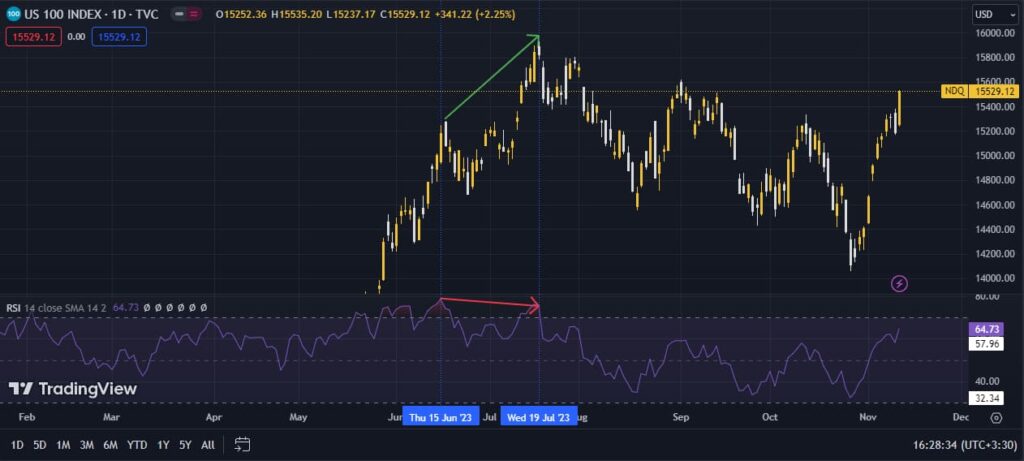
According to Investopedia, Divergence between price and momentum indicators can be an early warning of trend shifts, indicating weakening trend momentum before price changes.

E. Fibonacci Time

Fibonacci Time is a technical analysis tool used to predict the potential time for a price trend change. This tool uses Fibonacci numbers to draw vertical lines along the time axis. Fibonacci time is divided into two main types: Time Zone Fibonacci and Trend-Based Fibonacci. Let’s review how to use each of these two Fibonacci types:

1. Fibonacci Time Zone

The Fibonacci Time Zone is the simplest type of Fibonacci time. To use this tool, select two points on the price chart. These points can be two peaks, two valleys, or a combination of both. Then, vertical lines are drawn based on Fibonacci numbers between the first and second points.

Common Fibonacci numbers used for Time Zones are 1.618, 2, 2.618, 3, 3.618, etc., with 1.618 and 2 being the most significant. For example, in the chart below of global gold prices, the Fibonacci Time Zone drawn between two peaks shows how the levels 1.618 and 2 accurately identify the end of the downward trend and price reversal.

market timing indicators

2. Trend-Based Fibonacci Time

The Trend-Based Fibonacci Time is more complex than the Time Zone method. To use this tool, first select three points on the price chart. Next, draw vertical lines using Fibonacci numbers from the trend’s starting point to the third point.

These points are as follows:

  • Starting point of the trend,
  • End point of the trend,
  • End of the previous correction wave.

Common Fibonacci numbers for this method are 1, 1.618, 2, 2.618, 3, 3.618, etc., with 1 and 2 being the most important. For example, the chart below of Bitcoin prices shows how the Trend-Based Fibonacci can accurately identify the price reversal and upward trend at the 1 and 2 Fibonacci levels.

market timing indicators

Advantages of Using Fibonacci Time

Fibonacci Time offers several advantages, including:

  • It is simple and easy to understand.
  • It can be used to predict potential trend reversal points at any time frame.
  • It can help confirm existing trends.

Disadvantages of Using Fibonacci Time

Like all technical analysis tools, Fibonacci Time has some drawbacks:

  • It is not always accurate.
  • Prices may not return to the predicted levels.
sms-star

Source Box

According to Stockchart, Fibonacci Time Zones help identify when significant price changes may occur by marking time rather than price levels, helping anticipate turning points.

Applications of Time Analysis in Technical Analysis

  • Identifying Upward or Downward Trends:

One of the most important applications of time analysis is identifying upward or downward market trends. Market timing indicators, such as trend lines, moving averages, and price channels, can help spot these trends.

  • Predicting Market Reversal or Correction Points:

Fibonacci ratios are tools that can predict potential market reversals or correction points. These points can assist in determining price targets or identifying suitable entry and exit points using market timing indicators.

  • Defining Price Fluctuation Ranges:

Price channels are tools that define price fluctuation ranges. These ranges can help set price targets or identify appropriate entry and exit points, improving the accuracy of market timing indicators.

Q: How can combining price volatility and market timing help set optimal stop-loss and take-profit levels?

A: By calculating time-weighted volatility and aligning it with key timing tools like Fibonacci Time Zones or Trend-Based Fibonacci, traders can pinpoint more precise stop-loss and take-profit levels.

For instance, if timing indicates an upcoming end of a correction and volatility is decreasing, a trader can tighten take-profit levels and reduce risk exposure. This method is efficient for mid- to long-term trades and improves risk-reward efficiency.

market timing indicators

Some General Tips for Using Time Analysis Tools

  • To get a precise time zone, use multiple market timing indicators. The area with the highest Fibonacci ratios is most reliable.
  • By applying time analysis and overlap, identify the time range with the highest probability for our target. Combining time and price overlaps improves accuracy.
  • Fibonacci ratios are helpful, but they aren’t always precise. Use them carefully as support and resistance levels.
  • Market timing indicators provide valuable insights into price trends. They should supplement, not be the sole basis, for decisions.

Conclusion

By using time analysis tools, you can gain a better understanding of price trends and make more informed trading decisions. However, keep in mind that no market timing indicator can provide precise predictions about future prices. Therefore, always combine technical analysis tools with other factors like fundamental analysis to enhance your decision-making process.

Continue Reading
not-found
calendar 26 December 2025
Rate this article
Plugin not installed

Leave a Reply

Your email address will not be published. Required fields are marked *

No thanks