


Learning about trendlines helps you not only identify the overall market direction but also pinpoint potential price reversal points. This fundamental tool in technical analysis, especially in markets like Forex, plays a crucial role in trading decisions.
By recognizing the market trend and understanding the different types of trends, such as uptrends and downtrends, you can achieve a more accurate analysis. In this article, we will explore the various types of trendlines in technical analysis and how to draw them to improve your trading strategies.

- Understanding the concept of trendlines helps traders better comprehend the overall structure of price movements and adjust their decisions based on market logic.
- Trendlines hold the most validity when they are used in conjunction with price action analysis and trading volume, rather than simply being drawn based on appearance alone.
- The ability to recognize trend reversals and quickly adapt to new market conditions is a key trait of professional traders.
- Continuous use of analytical tools like trendlines, without practice and practical experience, can lead to misinterpretation of data and emotional decision-making.
What is a Trendline and Why is It Important?
In technical analysis, a trendline is a line that connects the highs or lows of a price chart, indicating the market’s direction. Simply put, this line shows whether the price is rising or falling. When drawn correctly, it can highlight dynamic support and resistance levels in the market, allowing us to predict where the price is likely to stop or reverse.
In Forex trading, trendlines are one of the primary tools for forecasting market movements. For example, in the EUR/USD currency pair, when the price is in an uptrend, the trendline can act as support. If the price breaks this line, a breakout is likely, and the trend may change.
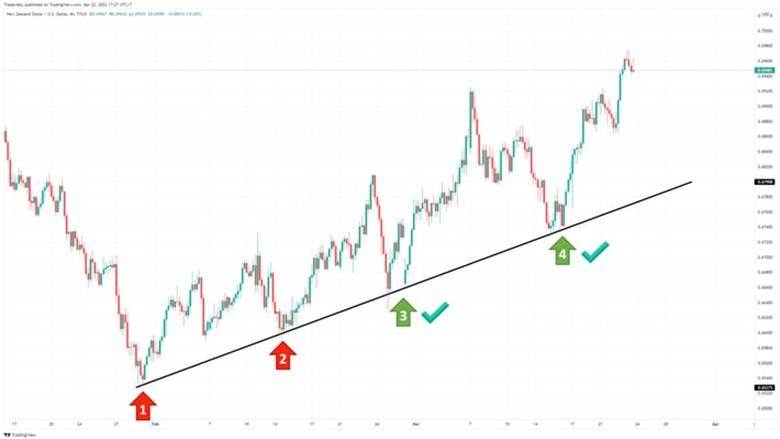
Another critical point to consider is that the more times the price touches the trendline, the more reliable the trendline becomes. For instance, if the price touches the trendline more than three times, the line has greater strength, and it can be trusted more.
Learning how to draw and interpret trendlines allows you to use this tool effectively in your analysis. Additionally, trendlines can assist in risk management, helping you enter the market at the right times and avoid costly mistakes.

Trendlines not only indicate the overall direction of an asset, but also forecast support and resistance levels. They help traders identify strategic entry points or determine stop-loss placements for effective risk management.
Types of Trends in Technical Analysis
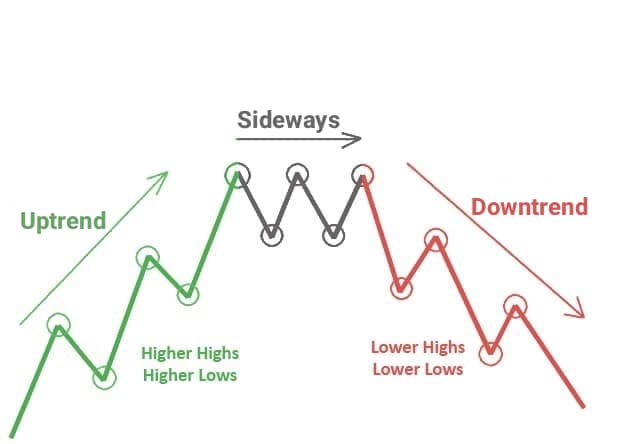
In technical analysis, one of the most important principles is identifying the different types of trends. Trends help you predict the market’s direction and make the best decisions for your trades. According to Dow Theory, the market generally moves in one of three types of trends: an uptrend, a downtrend, or a sideways trend. Each of these trends has distinct characteristics, and understanding them can help you develop better trading strategies.
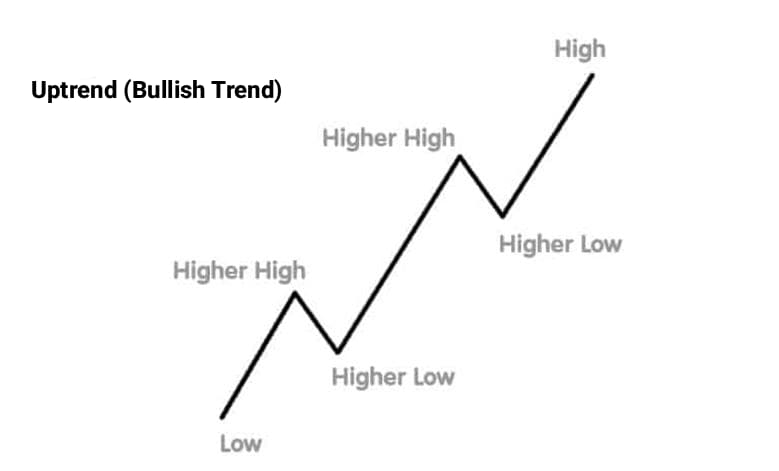
Uptrend (Bullish Trend)
An uptrend occurs when prices consistently form higher peaks and higher troughs. This indicates higher demand than supply in the market, typically leading to price increases. In an uptrend, the trendline acts as a support level, where prices continue to rise.
For example, in AAPL stock, you can observe that prices consistently rise, which reflects the strength of the uptrend. By identifying this trend, traders can make better decisions for buying and take advantage of the upward movement.
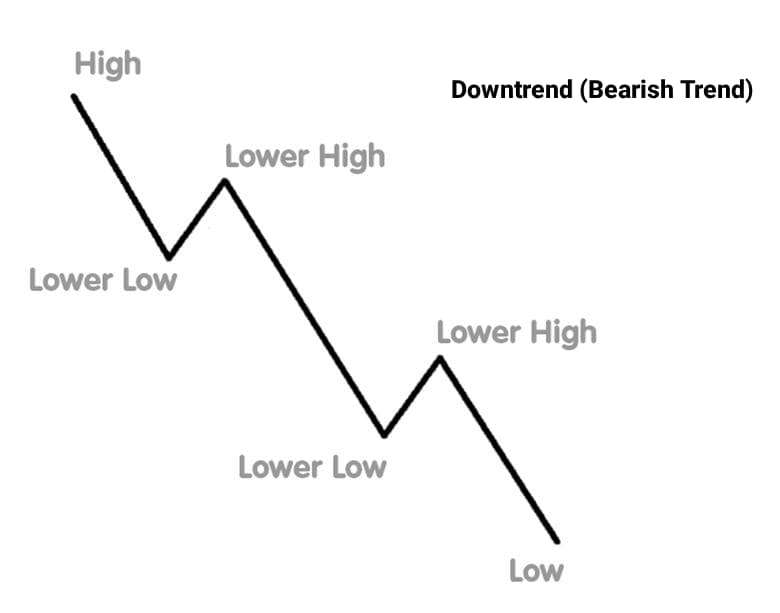
Downtrend (Bearish Trend)
In a downtrend, prices consistently create lower peaks and lower troughs. This means that, over time, prices are falling, and the downward movement continues. In this type of trend, the trendline serves as a resistance level, and traders use it as a point for selling.
In the Forex market, the GBP/USD currency pair is an example of a downtrend where prices have fallen, and the bearish trend continues. This trend reflects selling pressure and reduced demand, ultimately leading to price decreases.
Sideways (Neutral or Horizontal Trend)
A sideways trend occurs when prices oscillate within a specific range without any clear direction. In this case, neither an uptrend nor a downtrend exists. Prices typically move within a horizontal channel, bouncing between a limited range of highs and lows. This type of trend usually occurs due to an equilibrium between supply and demand.
For instance, in the gold market, prices often move within a sideways trend, fluctuating within a defined range. This trend can indicate a lack of clear decision-making in the market, and traders must act with greater caution.
Importance of Accurately Identifying Trends in Trading Decisions
Correctly identifying trends is one of the most crucial skills in technical analysis. For example, in an uptrend, the best buying strategy is when the price approaches the uptrend line. At this point, the price is likely to continue its upward movement.
In a downtrend, the best-selling strategy is when the price reaches the downtrend line. Additionally, combining uptrend and downtrend lines with indicators like moving averages can enhance the accuracy of analyses. Ultimately, risk management is crucial in each of these trends because correctly identifying the trend can guide you toward better decisions and help prevent mistakes.
Types of Trendlines in Technical Analysis
In technical analysis, having a correct understanding of the different types of trendlines helps traders better identify the price direction and key entry and exit points in the market. Trendlines not only show the overall price path but can also act as dynamic support or resistance levels. The more accurately these lines are drawn, the more reliable the analysis becomes, making trading decisions easier.
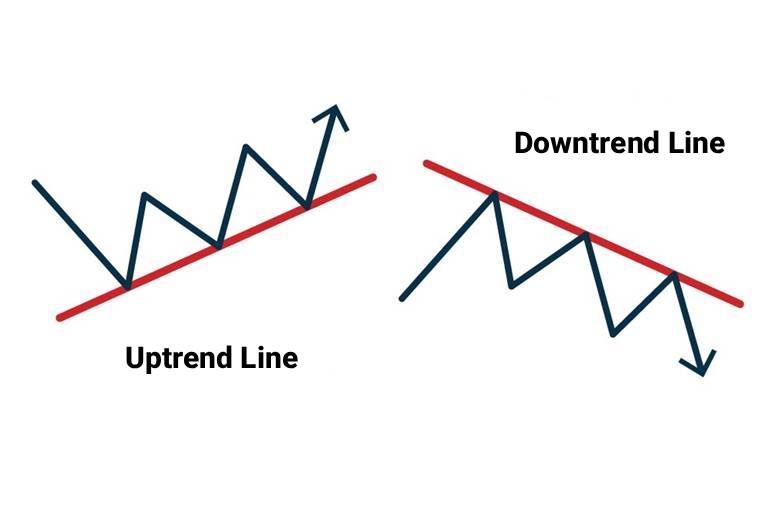
Uptrend Line and How to Draw It
In financial markets, an uptrend line forms when prices record higher lows compared to previous ones. To draw an uptrend line, simply connect two or more consecutive troughs, each higher than the previous one. This line typically acts as a support level and indicates increasing buying strength.
When prices approach this line again, many traders expect the trend to continue upwards. As mentioned on platforms like Babypips, the more touchpoints the line has, the more reliable it becomes.
Downtrend Line and How to Draw It
Conversely, a downtrend line appears when prices create lower peaks than before. In this case, a line is drawn connecting lower high points, which is usually considered a resistance level. This line indicates increasing selling pressure, and as long as the price remains below it, the overall trend stays bearish. Traders in such scenarios typically look for selling opportunities. Properly identifying both uptrend and downtrend lines gives you a better understanding of the market’s strength or weakness.
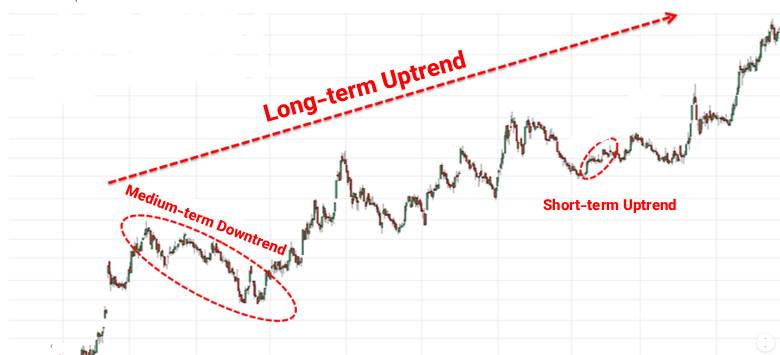
Short-Term, Medium-Term, and Long-Term Trendlines
Each trendline can vary depending on the time frame. Short-term trendlines are typically drawn over a few weeks to three months and are useful for day traders or those engaging in short-term trades. Medium-term trendlines cover periods between three to twelve months and are more suitable for swing traders.
Long-term trendlines usually last over a year and represent the overall market trends. In technical analysis, considering all three types of trendlines simultaneously helps you better understand the market structure and make more accurate decisions.
Key Points for Drawing Accurate Trendlines
For trendlines to be accurate and reliable, there are several essential tips. First, the trendline should have at least three valid touchpoints to be considered credible. When drawing the line, it should not pass through the body of the candles but rather through their wicks or shadows to pinpoint more precise levels.
Also, avoid excessively altering the lines to fit your analysis, as this can lead to analytical errors. Finally, precision in drawing trendlines enables you to identify potential price reversal points more quickly, allowing for more confident trading decisions with proper risk management.
In ranging markets, a horizontal trendline can define support or resistance levels within a specific range; however, trendlines are typically designed to indicate an upward or downward direction.
Difference Between Trendlines and Price Channels
In technical analysis, a trendline indicates the primary direction of price movement by connecting successive lows or highs. In contrast, a price channel consists of two parallel lines that display the price movement within a specific range. Essentially, a trendline shows only the market’s direction, while a channel illustrates the extent to which the price can fluctuate.
Traders often use channels when the market is in a neutral phase to better identify the range for buying and selling. In situations where the market follows a clear trend, trendlines are more effective. Combining these tools with price action analysis helps improve the understanding of price behavior and leads to more precise decision-making.
Common Mistakes Traders Make When Drawing Trendlines
When drawing trendlines in technical analysis, many traders make simple errors that weaken their analysis. One common mistake is drawing the line based on the candle bodies, while it should be drawn using the wicks or shadows for greater accuracy.
Additionally, some traders draw trendlines using only two touchpoints, whereas at least three points are required for the trendline to be valid. Another mistake occurs when traders draw trendlines based on their preconceived notions, aligning the line with their analysis rather than the market’s reality.
Furthermore, ignoring the timeframe can cause a short-term trendline to conflict with the overall trend. To avoid these mistakes, it is better to consider the overall market structure to ensure a more accurate and reliable analysis.
Trading Strategies Based on Trendlines
In financial trading, many traders use trendlines in Forex to better understand the price direction and make informed decisions. When traders can correctly identify the various types of trendlines in technical analysis, they can design more effective trading strategies.
One simple and commonly used method is buying when the price touches an uptrend line. In this case, the trader waits for the candles to close near the support line and then enters a buy trade.
On the other hand, some traders use a trendline breakout strategy. This approach is applied when the price breaks through a trendline and moves in the opposite direction. In such situations, the trader can enter a sell trade once the breakout is confirmed or wait for the price to return to the broken level to enter at a safer point.
Resources like Investopedia suggest that combining trendlines with indicators such as RSI or moving averages can increase the reliability of signals. Additionally, setting stop-loss orders below or above the trendline is a simple and practical method for risk management in trades. This combination helps traders better understand market trends and enter trades at the right time.
Conclusion
Correctly identifying the price direction is crucial to trading decisions, and one of the most effective tools for this is trendlines. With consistent practice and analysis, traders can gain a deeper understanding of market trends and detect potential changes earlier. It is recommended to strengthen your visual analysis skills by practicing drawing trendlines on platforms like TradingView. Ultimately, the ability to accurately identify and use trendlines can provide a solid foundation for long-term trading success.