


Most trading strategies don’t fail because the rules are “bad.” They fail because the parameters go stale, and the backtest is quietly curve-fitted to a single historical mode. Walk Forward Optimisation (WFO) fixes that by forcing your system to earn its keep through repeated out-of-sample tests, not a single flattering all-history report. If you want a process that behaves like real trading—optimise, deploy, review, recalibrate—this is it.

- Walk forward optimisation is a repeatable cycle: optimise on in-sample, validate on out-of-sample, then roll forward and repeat.
- Walk forward testing answers “does it keep working on unseen data?” while optimisation focuses on finding settings.
- rolling walk forward adapts quickly to recent market changes, while anchored walk forward improves stability by recalibrating parameters using an expanding dataset.
- Track robustness with out-of-sample validation KPIs: Walk-Forward Efficiency, drawdown behaviour, Sharpe/Sortino, and Profit Factor.
What Is Walk Forward Optimisation?
According to Algotrading101, Walk Forward Optimisation (WFO) is a structured method for testing and refining trading strategies that mimics real market conditions. Instead of running one large backtest over all historical data, WFO divides the data into sequential segments and repeatedly performs two steps:
- Optimise the strategy on historical data (In-Sample).
- Test those parameters on the next unseen segment (Out-of-Sample).
Then the window moves forward in time, and the process repeats.
This rolling process simulates how a professional trader would actually manage a system—periodically recalibrating parameters as volatility, liquidity, and market regimes change.
Why Professionals Choose WFO:
The key purpose of walk forward optimisation is to reduce curve fitting. A strategy that performs well only on the data it was trained on is fragile. An approach that maintains performance across multiple out-of-sample segments demonstrates robustness.
In simple terms:
- Traditional backtest: “Did it work in the past?”
- Walk Forward Optimisation: “Does it keep working as conditions change?”
WFO is widely considered one of the most reliable validation techniques for algorithmic trading systems because it tests not only the strategy’s rules but also its ability to adapt over time.
Core Principles Behind Walk-Forward Windows
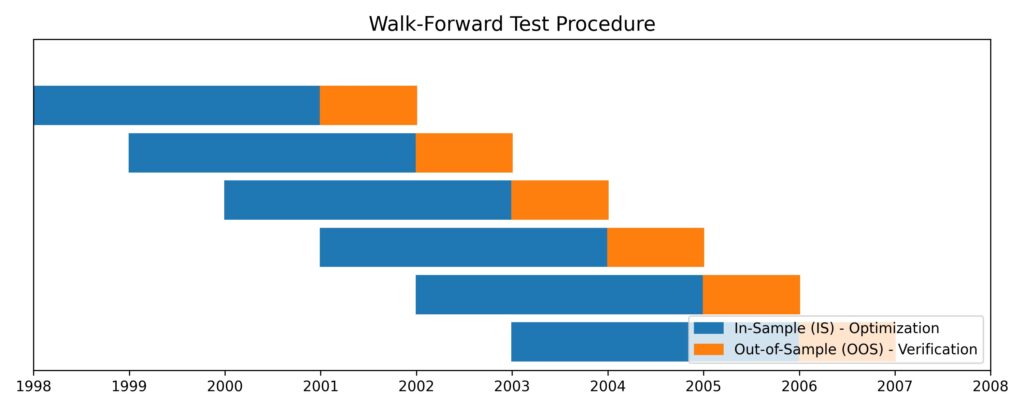
The engine of this process is the “Walk-Forward Window.” This is a specific time slice divided into two critical components: the In-Sample (IS) and Out-of-Sample (OOS) windows.
- In-Sample (IS): This is your training ground. The optimiser searches for the “best” settings—such as the ideal RSI period or MACD crossover values—within this block of data.
- Out-of-Sample (OOS): This is the moment of truth. The optimal settings from the IS window are applied to the immediately following data block to see if the performance holds up in a “forward” environment.

Trader's Rule of Thumb:
A typical window ratio is 80/20. If you optimise on 12 months of data (IS), you should validate it on the following 3 months (OOS). If the results diverge sharply, you have likely over-optimised for noise rather than signal.
Time-Segmented Optimisation Explained
Time-segmented optimisation assumes markets change over time, so a strategy that works in one regime (e.g., a strong-trend year) can fail in another (e.g., a choppy, high-inflation regime). By splitting historical data into multiple periods, you stress-test the strategy across different market conditions rather than relying on a single long backtest.
key Insight
If a strategy fails across several segments (e.g., 4 out of 10), it’s likely not robust enough for live trading—no matter how impressive the total historical profit looks.
The Logic of Rolling Optimisation Windows
According to therobusttrader, there are two common ways to run WFO:
- Rolling Walk Forward
- Anchored Walk Forward
Rolling Walk Forward (default approach)
In a rolling setup, the in-sample window maintains a fixed length and advances by steps. That means the optimiser always uses only the most recent block of history as in-sample.
Example (IS = 1 year, OOS = next period):
- Window 1: IS = Year 1
- Window 2: IS = Year 2
- Window 3: IS = Year 3
So the model stays focused on recent events.
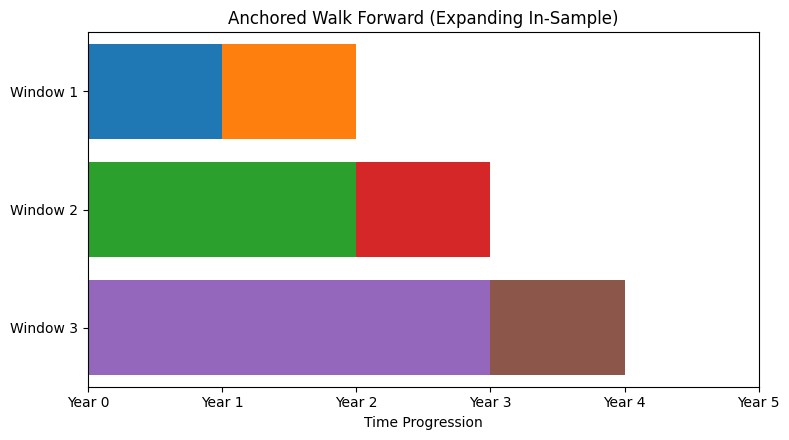
Anchored Walk Forward (expanding in-sample)
An anchored walk-forward is different because the in-sample window grows over time.
Instead of dropping older data, it keeps all previous history and adds new blocks.
Example:
- Window 1: IS = 1 year
- Window 2: IS = 1 + 1 = 2 years
- Window 3: IS = 1 + 1 + 1 = 3 years
So the optimiser has more data each time it recalibrates.
The rolling structure is what makes the process genuinely “walk forward.” Instead of optimising once on a static dataset, the strategy is repeatedly recalibrated and tested as market conditions evolve.
Fixed windows favor adaptability, while expanding windows favor stability.
The Role of Walk Forward Optimisation in Modern Algorithmic Trading
In today’s fast-changing markets, walk-forward optimisation (WFO) helps close the gap between “good on paper” backtests and live execution. Unlike static backtests that treat history as one fixed block, WFO assumes market conditions evolve. By re-optimising on rolling periods, traders keep strategies aligned with current liquidity, volatility, and trend structure.
Why Static Backtests Fail in Evolving Markets
Static backtests often fail because markets are non-stationary. A strategy tuned for the low-rate, low-volatility environment of 2020 may break in a higher-inflation, higher-volatility regime like 2024. The bigger issue is that many static results rely on hindsight-driven tuning, and when regimes shift (trend → range), a fixed model cannot adapt—leading to rapid performance decay.
The Problem of Static Parameters in Dynamic Markets
Fixed settings—like RSI(14) or a constant 50-pip stop—can work in one EUR/USD environment but lose effectiveness as liquidity, institutional flow, and macro drivers change. Parameters tend to “decay” over time.
The core problem is logical: static inputs assume stable market behaviour, while fundamental markets cycle through different volatility and policy regimes.
From Curve-Fitting to Robustness Testing
WFO shifts the focus from curve fitting (making the past look perfect) to robustness testing (proving the strategy can withstand future conditions). Over-optimising many variables often produces fragile systems that only match one historical path. By using repeated out-of-sample validation across multiple segments, WFO checks whether the edge persists on unseen data—one of the most evident signs of a professional-grade process.
How Walk Forward Analysis Improves Performance Stability
Walk-forward analysis improves stability by showing how strategies behave as parameters age and markets change.
- Smoother equity behaviour: Regular recalibration can reduce drawdowns caused by stale settings.
- Higher confidence than one backtest: Consistent performance across many forward segments is more meaningful than a single optimised curve.
- Adaptive selection: It supports selecting parameters that align with recent market efficiency, helping the system remain appropriately aggressive or conservative.
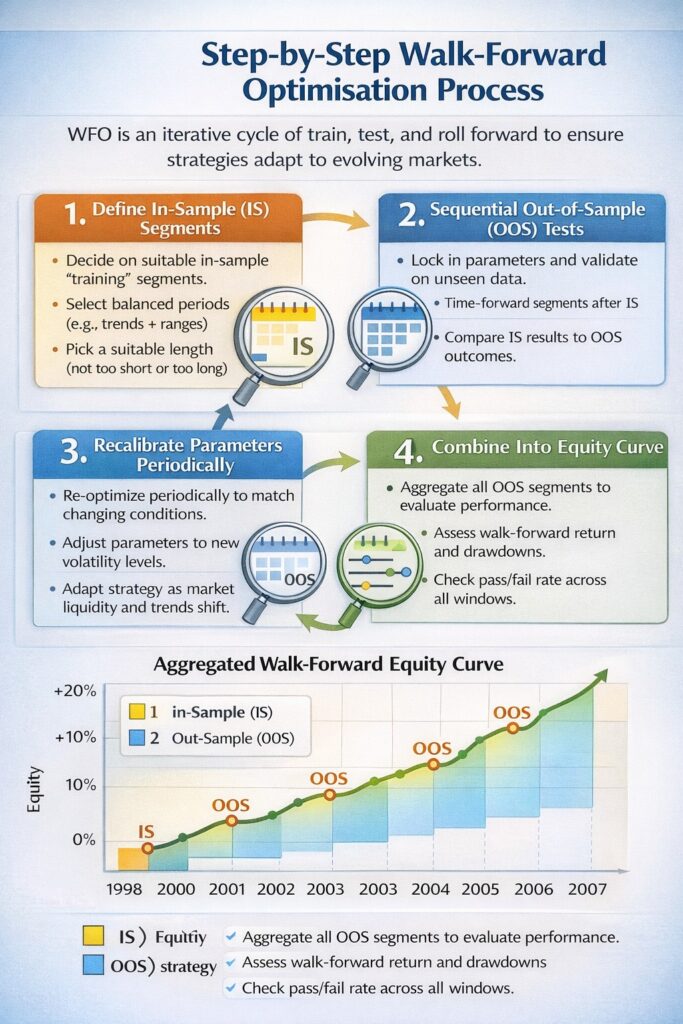
Step-by-Step Walk-Forward Optimisation Process
Walk forward optimisation (WFO) is a repeated cycle of train → test → roll forward.
Instead of treating history as a single long backtest, you break it into sequential steps so performance reflects adaptation to new market behaviour rather than a single lucky period.
Initial In-Sample Data Segments Definition
Start by defining the In-Sample (IS) “training” segments where the optimiser searches for strong parameters.
- Choose a suitable segment length:
o Too short = weak statistics
o Too long = stale settings that miss recent shifts.
- Use representative data: Include enough different conditions (trends + ranges) so the optimiser finds durable settings, not regime-specific ones.
Running Sequential Out-of-Sample Validations
After optimisation, lock the chosen parameters and test them on the next Out-of-Sample (OOS) segment.
- OOS must be unseen: It comes after IS in time and cannot influence parameter selection.
- A strong IS but weak OOS is a curve-fitting warning. The goal is OOS performance that reasonably matches IS.
Parameter Recalibration Across Market Cycles
As the windows move forward, you re-optimise periodically to reflect changing regimes. This mirrors real system management and helps the strategy adjust to shifts in volatility, liquidity, and macro conditions.
Aggregating Walk-Forward Performance Results
Finally, stitch all OOS segments into one aggregated walk-forward equity curve—a closer simulation of live trading with periodic updates. Evaluate:
- Walk-forward return
- Pass/fail rate across segments (e.g., 8/10 passes)
- Drawdown behaviour (avoid sharp “cliffs” after recalibration)
A high pass rate and smooth aggregated curve suggest better performance stability and readiness for demo or small-scale live deployment.
Over-Optimisation and Curve Fitting in Strategy Development
The line between a “highly tuned” strategy and a “broken” one is incredibly thin. While we want our algorithms to perform at their peak, pushing the optimisation process too far leads to a model that remembers the past but cannot predict the future. In the world of quant trading, this is known as the “Optimisation Paradox.”
What Is Over-Optimisation in Trading Systems?
According to articlesfactory, over-optimisation happens when a strategy uses too many variables and ends up fitting random market noise rather than a repeatable signal. With excessive parameters (multiple moving averages, several oscillators, extra filters), the optimiser can “discover” a combination that worked in the past by coincidence, producing a fragile model that looks great historically but has poor real-world predictive power.
How Curve Fitting Distorts Backtest Results
Curve fitting is the visual manifestation of over-optimisation. It produces backtest results that look like a smooth, diagonal line from the bottom left to the top right with almost no drawdowns. However, this is a distortion. The “fit” is so tight to the historical price curve that the strategy cannot handle even a slight deviation in market conditions. Using a walk-forward optimisation backtesting approach often reveals the truth: the moment the data changes even slightly, that beautiful equity curve turns into a vertical drop.
Why the Best Backtest Often Fails in Live Markets
It is a typical irony in trading: the better a backtest looks, the more likely it is to fail in a live environment.
- Selection Bias: If you run 1,000 optimisation passes and pick the single best one, you aren’t picking the best strategy; you are picking the luckiest outlier.
- Parameter Sensitivity: Over-fitted strategies are extremely “brittle.” If the optimal RSI period was 14.2 in the backtest and the market requires 14.5 in real time, the strategy’s logic breaks down.
- Lack of Generalisation: A robust strategy should work reasonably well across a range of parameters. An over-optimised one only works at a single, specific “perfect” point.
How Walk Forward Optimisation Mitigates Overfitting Risk
Walk-forward optimisation acts as a practical “reality check” by reducing overfitting through:
- Blind Testing: Validating on out-of-sample data so the strategy can’t just memorise past prices.
- Consistency over Perfection: Preferring steady performance across many segments over one exceptional (and likely lucky) period.
- Parameter Stability Analysis: Checking whether “best” parameters stay relatively stable across windows (large swings suggest instability and overfitting).
Walk Forward Testing vs Traditional Backtesting
Traditional backtesting is a single “all-history” report that often rewards hindsight and over-tuning. Walk forward testing is closer to how trading actually works: you make decisions using past data, then the market moves on, and you deal with whatever comes next. That’s why walk-forward frameworks are used as a stress test for whether a strategy can survive outside its comfort zone.
H3: What Is Walk Forward Testing?
Walk forward testing follows a simple loop: optimise on one period, test on the next.
You calibrate parameters on an in-sample block, lock them, then run them on the immediately following out-of-sample block. The out-of-sample part is treated like a “live” period—no edits, no second chances. That’s the whole point: to see if the logic holds once the market moves forward.
In-Sample vs Out-of-Sample Validation
The credibility of the results depends on a rigid separation between the two datasets:
- In-Sample (IS): The training/optimisation zone. This is where you search parameter values (RSI length, MACD settings, filters, stop logic).
- Out-of-Sample (OOS): The validation zone. It must remain untouched while optimising.
If performance collapses when you shift from IS to OOS, the strategy is likely “curve-fitted” to the noise of the training data rather than the signal of the market. Walk-forward optimisation backtesting is specifically designed to catch these failures before they cost real capital.
Key Differences in Forward Validation Accuracy
Traditional backtests can look “accurate” because they evaluate everything at once, using a dataset you never have access to in real time. Walk-forward methods reduce that illusion by repeating the IS→OOS cycle across multiple segments, so the strategy must keep proving itself in fresh conditions.
| Feature | Traditional Backtesting | Walk-Forward Optimisation |
|---|---|---|
| Data usage | Static (one large block) | Dynamic (rolling segments) |
| Parameter logic | Fixed settings | Parameter recalibration + forward validation |
| Overfitting risk | High (especially after heavy tuning) | Reduced (repeated OOS checks) |
| Realism | Idealised/theoretical | Closer to live execution conditions |
Key Insight:
Forward validation is not about finding the “best” curve—it's about proving the strategy can maintain performance when the market stops behaving as it has in the past.
Q: Can I do walk forward testing manually?
A: While possible, it is incredibly tedious. Most professionals rely on MetaTrader 5 strategy tester forward optimisation, walk-forward features, or custom scripts to ensure the mathematical accuracy of the shifting windows.
Walk Forward Testing vs Walk Forward Optimisation
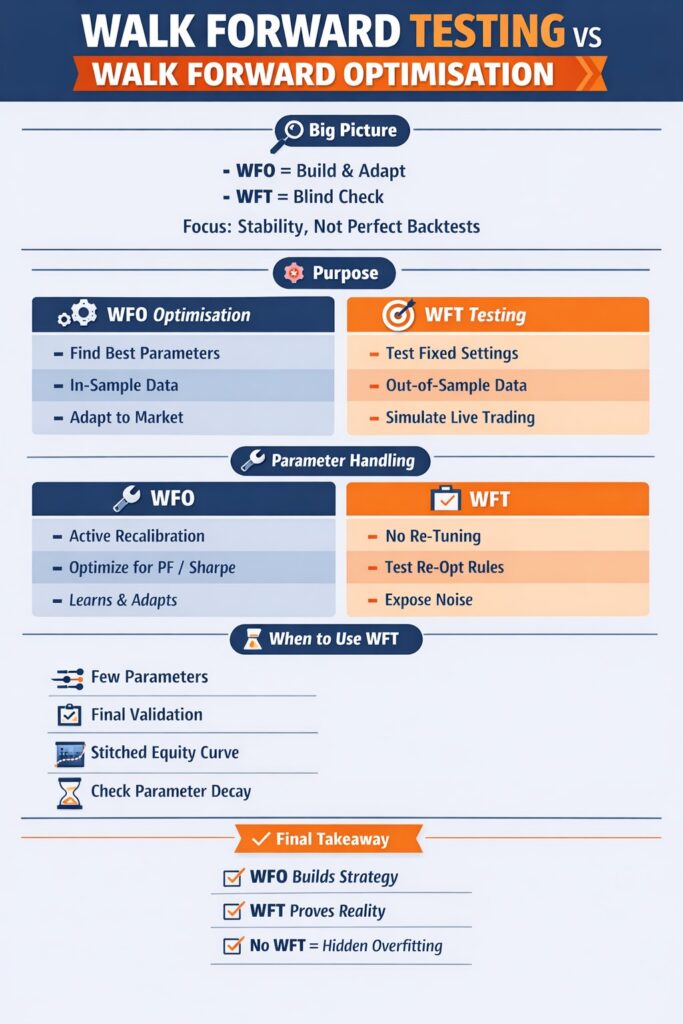
Walk Forward Optimisation (WFO) is the comprehensive process of training and validating a strategy.
Walk Forward Testing (WFT), however, is frequently viewed as the final performance audit—the “blind run” that proves the optimisation logic can withstand a range of market conditions.
Conceptual Differences Between Testing and Optimisation
The primary difference lies in the intent.
- WFO (Optimisation): Finds the best parameter settings for a given market regime using in-sample data (e.g., RSI settings, Fibonacci rules).
- WFT (Testing): Verifies those settings on out-of-sample data to simulate how the strategy would have performed without hindsight.
How Each Method Handles Parameter Recalibration
Parameter recalibration is the heartbeat of a walk-forward approach, but it is handled differently in each phase:
- In WFO: Recalibration is active and goal-driven—parameters are re-tuned to maximise metrics like Profit Factor or Sharpe.
- In WFT: Recalibration is treated as a rule to be evaluated—testing shows whether your chosen re-optimisation schedule improves results or just chases noise.
When to Use Walk Forward Testing Instead of Optimisation
You don’t always need a full-blown optimisation suite. Walk forward testing is the preferred choice in specific scenarios:
- Low-Parameter Strategies: If your strategy has only one or two parameters, running heavy WFO could lead to curve fitting. Instead, a simple WFT across different years can prove the core logic is robust.
- Final Validation: WFT is the final “gatekeeper.” After you have found your optimal settings through WFO, you run a WFT as a non-optimised, walk-through-time test to generate your “Stitched Equity Curve.”
- Checking Strategy Decay: Use WFT to determine how long your parameters last before they “expire.” If a WFT shows that performance drops off sharply after two weeks, you know your re-optimisation cycle needs to be shorter.
Walk-Forward Optimisation Backtesting: Building Realistic Strategy Models
Walk-forward optimisation backtesting mimics how a professional trader manages a strategy in real life: monitor it, adjust it, and recalibrate parameters over time rather than “set and forget.” It shifts the focus from finding what worked historically to testing whether an ongoing update process can stay effective as markets change. Tools like the MetaTrader 5 strategy tester help evaluate whether a strategy can maintain its edge through evolving market conditions, not just produce high past returns.
Avoiding Overfitting Through Dynamic Strategy Tuning
Walk-forward optimisation helps prevent overfitting by discouraging endless “extra filters” that only make a backtest look smoother.
It forces strategies to prove themselves on out-of-sample data right after tuning, which quickly exposes curve-fitted settings.
If parameters perform well in-sample but fail in the forward test, the optimisation is not valid—so only strategies with a real, repeatable edge survive across walk-forward cycles.
Evaluating Adaptive Parameter Selection
You know your parameter selection logic is sound when it produces stable, not just profitable, settings:
- The Stability Test: If your optimal RSI period jumps from 5 to 50 between two windows, your strategy is likely unstable.
- The Selection Rule: Robust models often favour “the most stable” parameter over “the most profitable.”
Walk-forward optimisation helps verify whether your recalibration rules truly add value or simply chase past market noise.
Stress-Testing Strategies Across Market Regimes
Walk-forward backtesting assesses a strategy’s performance across different market regimes by testing it across sequential out-of-sample periods (crisis volatility, range-bound markets, and bull markets). By reviewing each forward segment, you can pinpoint the conditions where the strategy breaks, estimate realistic drawdowns and performance decay, and avoid being blindsided when market sentiment shifts in live trading on platforms like TradeStation or NinjaTrader.
Designing Effective Walk-Forward Windows
Designing a robust walk-forward structure is less about finding “magic numbers” and more about engineering a simulation that mirrors your actual trading frequency and the market’s underlying cycles. If the windows are too tight, the algorithm overreacts to temporary noise; if they are too wide, the strategy becomes “stale,” failing to adjust to structural shifts in volatility or trend.
Choosing Optimal Window Lengths
Choosing the right In-Sample (IS) window length requires balance.
Too short, and results lack statistical meaning; too long, and outdated market conditions distort today’s parameters.
A practical rule is to cover at least one complete market cycle.
For swing trading, this often means 18–24 months of data, whereas high-frequency intraday strategies may require only a few weeks, provided the trade count is sufficient for reliable analysis.
Balancing Optimisation and Validation Periods
The split between optimisation (IS) and validation (OOS) periods is usually set by a ratio, most commonly 70/30 or 80/20.
With an 80/20 split, parameters are optimised on 80% of the data and tested on the next 20%. This balance matters because an OOS period that is too long can cause parameters to expire mid-test, while one that is too short may produce misleading results from random wins.
Key Insight
Effective walk-forward optimisation keeps the OOS window long enough to reflect changing price action but short enough to retain parameter relevance.
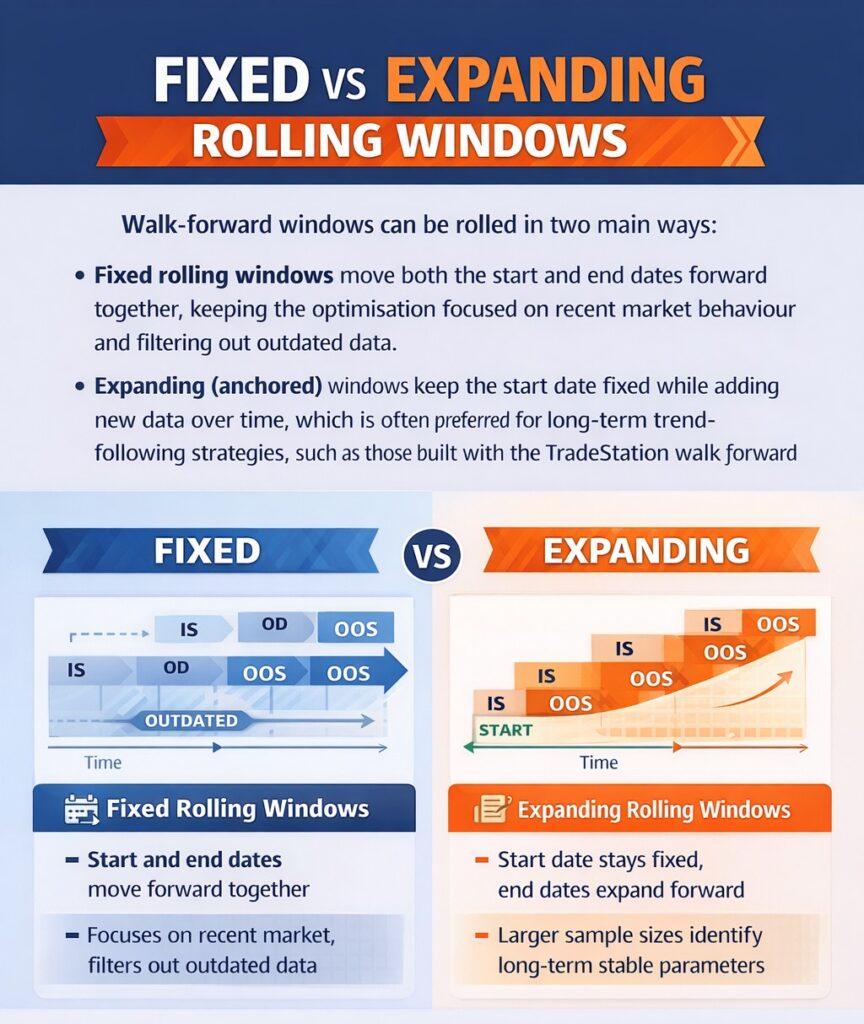
Fixed vs Expanding Rolling Windows
Walk-forward windows can be rolled in two main ways:
- Fixed rolling windows move both the start and end dates forward together, keeping the optimisation focused on recent market behaviour and filtering out outdated data.
- Expanding (anchored) windows keep the start date fixed while adding new data over time, which is often preferred for long-term trend-following strategies, such as those built with the TradeStation walk forward optimiser, where larger datasets help produce more stable parameters.
Aligning Window Structure With Strategy Horizon
Your walk-forward window structure must align with your trading horizon:
- Short-horizon strategies (scalping/intraday):
Require frequent parameter updates. Short, rolling windows keep the model responsive to recent liquidity and volatility shifts. - Long-horizon strategies (swing/trend following):
Require stability. Longer, anchored windows reduce overreaction to short-term noise and volatility spikes.
Key insight
With tools like NinjaTrader's forward optimisation, traders can test different window lengths to find the optimal balance.
Performance Analysis in Walk-Forward Optimisation
Walk-forward optimisation only becomes valuable when you interpret the results correctly. That’s how you strip away curve-fitting and estimate whether the strategy has a repeatable edge.
According to Quantstrategy, in addition to assessing Performance Stability by WFE, walk-forward performance is also evaluated by three core KPIs:
- Drawdown
- Sharpe/Sortino (risk-adjusted stability)
- and Profit Factor (trade efficiency).
Performance Stability Across Walk-Forward Segments
Consistency is a key sign of a robust system. Walk Forward Efficiency (WFE) compares out-of-sample (OOS) performance to in-sample (IS) performance:
- High WFE (Above 0.7): OOS results are close to IS results → stronger robustness.
- Low WFE (Below 0.4): Big drop from IS to OOS → likely overfitting and poor generalisation.
- Stability Check: A high pass rate across segments (e.g., 9/10 profitable segments) matters more than profit concentrated in just a few lucky periods.
Risk-Adjusted Return Consistency
In a walk-forward analysis, profit is meaningless if it comes with unstable volatility.
Track Sharpe Ratio (and Sortino Ratio if downside risk matters) across all OOS segments.
- Target: Similar Sharpe/Sortino across market regimes.
- Red flag: Sharpe looks “elite” in trend windows (e.g., 2.5) but collapses in ranges (e.g., 0.2). That’s regime dependency, not robustness.
Drawdown Behaviour in Forward Periods
In standard backtests, drawdowns can look artificially small because optimisation “smooths” the curve. Walk-forward results expose drawdowns more realistically—and that’s the point.
- Depth vs. duration: WFO shows how deep the drawdown is and how long it takes the strategy to recover after each recalibration.
- Forward drawdown ratio: Compare OOS drawdown to IS drawdown to spot fragility. If OOS drawdowns are much worse, the strategy is likely struggling in the current regime.
Profit Factor In walk-forward analysis
Profit Factor (PF) shows how efficiently a strategy turns losses into profits:
- PF = 1.0: Break-even ( total profits equal total losses)
- PF > 1.0: Profitable
- PF < 1.0: Losing system (negative edge)
In walk-forward analysis, focus on out-of-sample PF across segments. If PF drops in forward windows, it’s a red flag for overfitting.
A practical target is PF > 1.3–1.5 after costs.
Robustness Testing Through Parameter Sensitivity
Robustness means a strategy still performs reasonably well even when parameters aren’t perfectly tuned.
In WFO, test the parameter space. For example, if a moving average works at 20 but fails at 19 or 21, the strategy is too fragile.
- Look for a “flat top”: Strong strategies show a plateau of good results across nearby parameter values. A single sharp peak surrounded by losses is usually a statistical fluke, not a real trading edge.
Platform-Based Walk Forward Optimisation Tools
Choosing a platform for walk-forward testing depends on two factors:
- The amount of code you have
- and the level of depth you want the analytics to achieve.
Regardless of platform, the aim is the same: automate the in-sample optimisation vs out-of-sample validation cycle so your strategy is tested for real-world survival, not just a great-looking backtest.
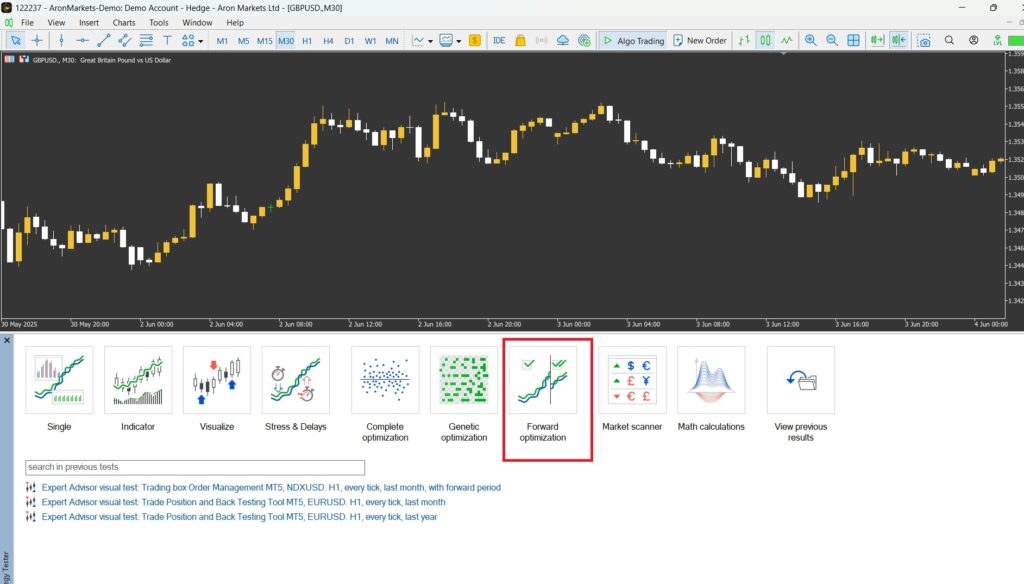
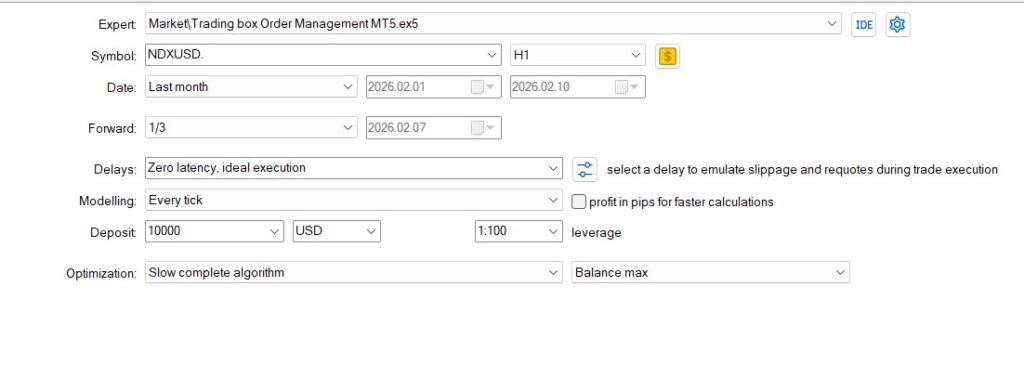
MetaTrader 5 Strategy Tester Forward Optimisation (Walk-Forward Setup)
MetaTrader 5 is one of the most accessible options for retail traders to run forward-style validation. In the Strategy Tester, you can set Forward modes (e.g., 1/2, 1/3, Custom) to split data into optimisation (IS) and forward test (OOS). A key advantage is the MQL5 Cloud Network, which speeds up large optimisation runs and makes it easier to compare IS vs OOS results inside the platform.
TradeStation Walk Forward Optimiser Features
TradeStation is widely used for structured walk-forward research thanks to dedicated tooling and reporting.
It highlights Walk-Forward Efficiency (WFE)-style comparisons (exact formulas may vary) and often supports pass/fail evaluation to help spot curve fitting. It’s a strong choice if you want more research-grade reporting and robustness checks.
NinjaTrader Walk Forward Optimisation Capabilities
NinjaTrader’s walk-forward functions in its Strategy Analyser are popular among C# traders for their flexibility. It typically offers detailed control over rolling windows (how far to step each cycle), multiple optimisation methods, and clear “stitched” equity curves that combine out-of-sample segments into a more realistic performance track record.
Table: Platform Comparison: Walk Forward Optimisation Tools
| Feature | MetaTrader 5 | TradeStation | NinjaTrader |
|---|---|---|---|
| Built-in Walk Forward | Yes (Forward Optimisation mode) | Yes (Dedicated Walk Forward Optimiser) | Yes (Strategy Analyser) |
| Data Split Options | 1/2, 1/3, Custom Forward ratios | Custom IS/OOS configurations | Fully customizable rolling windows |
| Walk-Forward Efficiency (WFE) | Basic IS vs OOS comparison | Advanced WFE-style metrics & pass/fail analysis | Performance comparison across segments |
| Optimization Speed | High-speed (MQL5 Cloud Network) | Moderate | Moderate (depends on hardware) |
| Parameter Recalibration Control | Standard forward splits | Advanced window & robustness control | Highly granular step-forward control |
| Reporting Depth | Basic forward report tab | Advanced robustness & cluster-style analysis | Detailed stitched equity curves |
| Best For | Retail algo traders & EA developers | Research-focused systematic traders | C# developers & flexible custom systems |
Advantages and Limitations of Walk Forward Optimisation
Walk forward optimisation helps bridge the gap between research and live trading by forcing a strategy to repeatedly validate on unseen data rather than a single static backtest. It reduces curve-fitting risk—but it won’t save a bad strategy or unrealistic assumptions.
Appropriately used, walk forward testing turns a “pretty backtest” into a disciplined, adaptive framework. Poorly used, it just burns compute and creates false confidence.
Benefits for Algorithmic and Systematic Traders
For systematic traders, the main advantage of walk forward optimisation is structural validation.
It doesn’t just ask “Did the strategy work in the past?” It asks: “Can it keep working as conditions change?”
Key benefits:
- Lower overfitting risk: By separating In-Sample optimisation from Out-of-Sample execution, walk forward testing forces the strategy to prove itself on data it didn’t “train” on.
- Adaptive parameter recalibration: Whether you walk forward optimisation on a platform, you can re-tune inputs as volatility and liquidity shift—instead of relying on stale settings.
- More realistic performance path: The stitched out-of-sample equity curve is closer to how a strategy behaves in live trading than a single, all-history backtest.
This matters most for multi-indicator systems (e.g., RSI + MACD + volatility filters).
Computational Complexity and Data Demands
The most significant practical limitation of walk-forward optimisation backtesting is resource intensity.
Running multiple optimisation cycles across rolling windows requires:
- Large, high-quality datasets
- Clean tick or bar history
- Significant processing power
For example, running MetaTrader 5 strategy tester forward optimisation across multiple parameter combinations can involve thousands of passes. Without proper parameter boundaries, this becomes a brute-force exercise rather than a structured validation.
Common Misinterpretations of Walk-Forward Results
Many traders misunderstand what walk forward optimisation actually proves.
Common mistakes include:
- Assuming WFO guarantees profitability: It reduces overfitting but does not eliminate regime risk.
- Over-relying on Walk-Forward Efficiency (WFE): A high WFE is encouraging, but without a consistent Sharpe Ratio and controlled drawdowns, it is incomplete.
- Ignoring segment-level failures: If 3 out of 10 windows fail badly, the system is unstable—even if total profit is positive.
Note:
Another misconception is treating WFO as a performance booster. It is not designed to maximise returns; it is intended to validate process integrity.
Practical Constraints in Live Trading Deployment
Even a strong walk forward optimisation result does not fully replicate live trading.
Real-world constraints include slippage variability, execution latency, liquidity fragmentation, and structural breaks (e.g., policy shifts, black swan events)
A strategy that passes every Out-of-Sample window can still struggle if its edge depends on microstructure conditions that disappear.
Additionally, parameter recalibration schedules must be operationally realistic. If your model requires weekly re-optimisation but you cannot reliably deploy updates, the theoretical robustness becomes impractical.
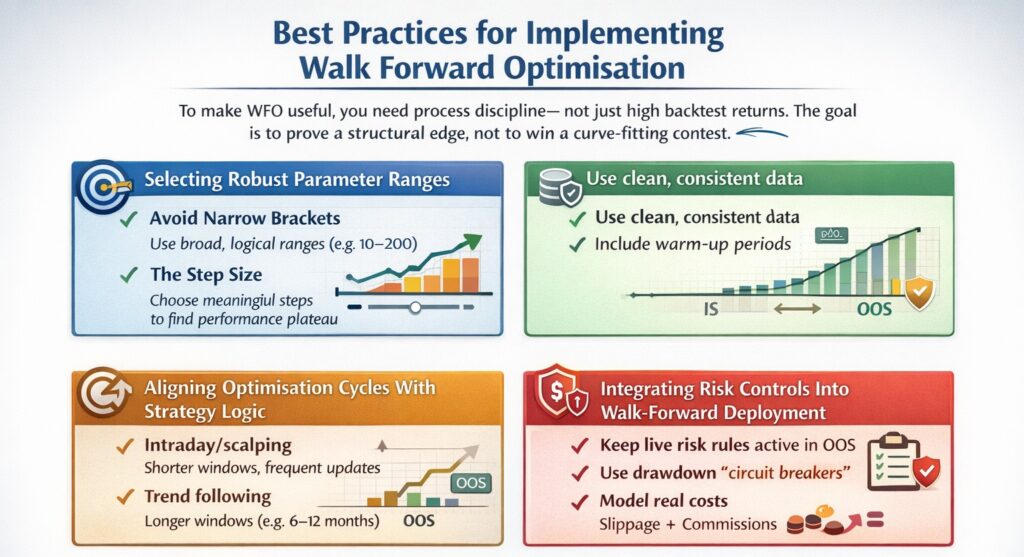
Best Practices for Implementing Walk Forward Optimisation
To make WFO useful, you need process discipline—not just high backtest returns. Most WFO failures stem from sloppy inputs: insufficient data, unrealistic costs, overly tight parameter ranges, or recalibration schedules that don’t align with the strategy.
The goal is to prove a structural edge, not to win a curve-fitting contest.
Selecting Robust Parameter Ranges
The foundation of a good WFO is the parameter space you choose to optimise.
- Avoid Narrow Brackets: If you only test a Moving Average between 19 and 21, you aren’t optimising; you are micro-tuning. Use broad, logical ranges (e.g., 10-200) to ensure the strategy works across different frequencies.
- The Step Size: Use a meaningful step size. Moving in increments of 1 for a 200-period average is often “noise mining.” Larger steps help identify the “plateau of profitability” rather than isolated spikes.
- Stability Over Peak Profit: Choose parameters that perform well across nearby values. A single profit spike is usually an indication of overfitting.
Ensuring Data Quality and Continuity
WFO is highly sensitive to “data gaps” and poor-quality history.
- Use clean, consistent data: Bad ticks, gaps, rollovers, splits/dividends can corrupt optimisation and mislead results.
- Include warm-up periods: Indicators need “pre-roll” data (e.g., 200 EMA). Without it, early OOS trades are mathematically invalid.
Aligning Optimisation Cycles With Strategy Logic
Your parameter recalibration frequency must match the “DNA” of your strategy.
- Intraday/scalping: Markets change fast → shorter windows and more frequent recalibration can make sense.
- Trend following: Markets change slowly → longer windows (6–12 months) reduce parameter whipsaw.
- Ensure enough trades per OOS: Your forward segment needs statistical weight (often 30+ trades as a practical baseline).
Integrating Risk Controls Into Walk-Forward Deployment
A walk-forward test is incomplete if it doesn’t account for the risk controls you intend to use in live trading.
- Keep live risk rules active in OOS: Position sizing, ATR stops, and exposure limits must be included during validation.
- Use drawdown “circuit breakers”: Fail a segment if drawdown exceeds your live risk threshold.
- Model real costs: Slippage + commissions must be included. If 1-tick slippage breaks the strategy, it’s not tradable.
When Should Traders Use Walk Forward Optimisation?
Use walk forward optimisation (WFO) when you’re building adaptive algorithm systems, not simple fixed-rule strategies. It’s most useful when your parameters must stay “fresh” as volatility, volume, and market structure change—especially if you plan to run the system for months or years and need a clear recalibration plan.
Strategy Types That Benefit Most
The strategies that gain the most from WFO are those with decaying edges.
- Mean Reversion: These systems rely on specific volatility bands. Since volatility is non-stationary, WFO helps adjust those bands as the market “stretches” or “shrinks.”
- Trend Following: WFO helps determine the optimal “lookback” period for moving averages or breakouts, ensuring the strategy doesn’t remain in trend-following mode during prolonged sideways chop.
- Multi-Indicator Models: Strategies that combine RSI, MACD, and Bollinger Bands are highly prone to curve-fitting; WFO is the only way to prove these complex layers actually work together.
Portfolio-Level Applications
WFO isn’t just for single strategies; it is vital for portfolio construction.
- Correlation Testing: A portfolio of five strategies might look diversified in a static backtest, but WFO can reveal if strategies “cluster” and fail together in specific regimes.
- Dynamic Weighting: Traders use WFO to decide which strategy in a portfolio should receive more capital based on their recent Out-of-Sample performance stability.
High-Frequency vs Swing Trading Use Cases
The application of WFO shifts significantly depending on the timeframe:
- High-Frequency (HFT) / Intraday: Use WFO with very short windows (days or weeks). These markets move fast, and parameters “expire” quickly. The focus here is on latency and liquidity adaptation.
- Swing Trading: Use WFO with long windows (6 months to 2 years). The goal is to capture broad economic cycles and avoid overreacting to short-term “noise.”
When Walk Forward Optimisation Adds Little Value
There are scenarios where WFO is overkill or even counterproductive:
- Fixed-Logic Strategies: If your strategy is “Buy every Monday at 9:00 AM and sell at 4:00 PM” with no variables to tune, WFO has nothing to optimise.
- Arbitrage: Pure arbitrage relies on price discrepancies, not parameter tuning.
- Insufficient Data: If you only have 6 months of data for a swing trading strategy, breaking it into IS and OOS segments will leave you with results that are not statistically significant.
- “Evergreen” Price Action: Simple strategies like “Inside Bar breakouts” with fixed risk-reward ratios often benefit more from a simple, long-term static backtest to prove the core concept’s longevity.
Table: When Walk Forward Optimisation Adds Little Value
| Scenario | Why WFO May Be Unnecessary |
|---|---|
| Fixed-Logic Strategy | No parameters to optimise |
| Pure Arbitrage | Edge comes from pricing gaps, not tuning |
| Insufficient Data | IS/OOS splits lack statistical meaning |
| Simple “Evergreen” Price Action | Long-term static backtest may be sufficient |
Conclusion
Walk Forward Optimisation is not a magic profitability button. It’s a truth machine. It exposes weak strategies, fragile parameters, and fake edges that collapse the moment conditions change. Appropriately used—with clean data, realistic costs, sensible windows, and disciplined evaluation—WFO gives you something most backtests can’t: evidence that your strategy can survive time, regime shifts, and parameter decay.


