icon icon Home
icon icon Accounts
icon icon Quick start
icon icon Symbols

Complete Guide to Breaker Blocks in Trading

Author
Abe Cofnas
Abe Cofnas
calendar Last update: 14 October 2025
watch Reading time: 11 min

Financial markets are filled with patterns and signals that traders use to understand price action better. One such concept is the breaker block, a price structure often seen at key turning points where the market suddenly reverses direction. Its importance lies in revealing the footprints of institutional players and their decisions on the chart.

Understanding breaker blocks goes beyond merely memorizing definitions. What truly matters is understanding the mechanics of their formation and applying them effectively in live trading scenarios.

bookmark
Key Takeaways
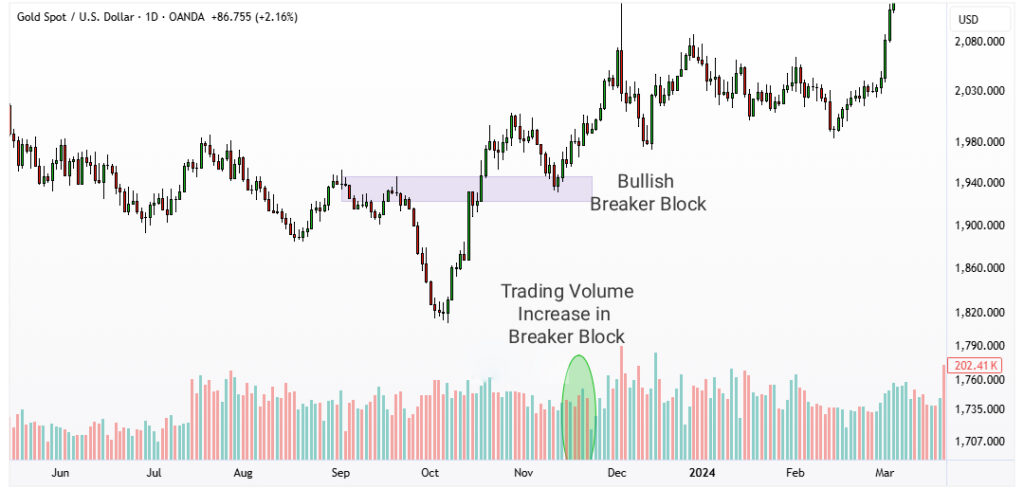
  • The validity and strength of a breaker block are significantly higher on higher timeframes (such as the 4-hour or daily chart).
  • If the price breaks through a breaker block decisively without any reaction, that zone becomes invalid and should be removed from your analysis.
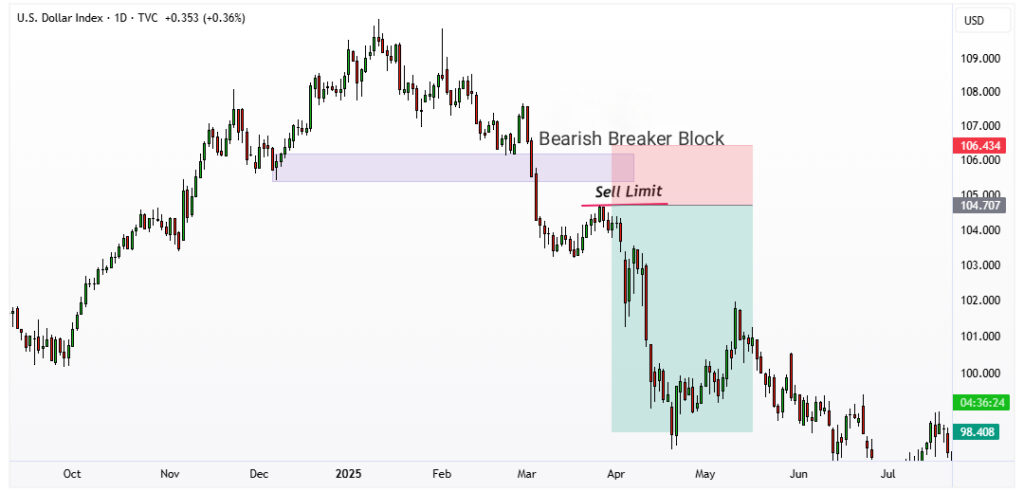
  • The first retest of a newly formed breaker block usually provides the strongest and most reliable reaction.
  • When setting your take-profit level, focus on the first significant swing high or low formed after the Break of Structure (BOS).
  • Never chase the price, if the market does not pull back to your breaker zone, it's best to let the trade setup go.

What Is a Breaker Block?

According to FluxCharts, a Breaker Block is one of the key patterns in price action trading. It forms when a previous Order Block is invalidated by price movement, but the same zone later gains new significance, often becoming a strong support or resistance level.

In simple terms, a breaker block is an order block that was initially broken, but the market later returns to it and respects it again, marking the beginning of a market structure shift.

What Is a Breaker Block

This concept was first introduced within the framework of Smart Money Concepts (SMC) and ICT (Inner Circle Trader) price action strategies. It is designed to illuminate the market movements of institutional players, also known as “Smart Money.” Breaker Blocks typically form following a liquidity grab—a scenario where price temporarily pushes past a key level, triggering the stop losses of retail traders, before rapidly reversing direction.

The Stages of Breaker Block Formation

For a valid Breaker Block to form on a chart, the market typically executes three key movements.

Breaker Block Formation

1. Stage One: The Trap, or Liquidity Grab

Initially, the price makes a deceptive move, breaking a previous significant high or low. At first glance, this suggests a trend continuation, prompting impatient traders to either enter new positions or have their stop losses triggered. This is precisely the point where “Smart Money” sweeps the necessary liquidity from the market.

2. Stage Two: The Powerful Reversal (Break of Structure – BOS)

After the liquidity has been absorbed, the market unexpectedly reverses. Price moves with significant speed and force in the opposite direction, breaking another key structural level. For instance, if a high was initially taken out, this stage is typically characterized by a break of a significant low (or vice versa). This sharp reversal indicates that the dominant market forces are redefining the directional bias.

3. Stage Three: The Return to the Opportunity Zone (Return to Breaker)

Following these movements, the zone where the initial false breakout occurred is now identified as the critical “Breaker Block.” A key characteristic of this stage is that before continuing in the new direction, the price will often retrace back to this area. This pullback provides the optimal trade entry, as it offers a lower-risk position that aligns with the new dominant market flow.

sms-star

A breaker block marks the moment when the market’s intention changes, when liquidity shifts from accumulation to distribution, and smart money begins to exit.

Types of Breaker Blocks

Breaker Blocks are classified into two main types based on their directional signal: the Bullish Breaker Block, which signals a potential buying opportunity, and the Bearish Breaker Block, which indicates a potential selling opportunity.

Bullish Breaker Block

This pattern occurs when the market initially fakes a move to the downside.

Here is how it unfolds: Price first breaks a key low, luring many traders into false short positions or triggering their stop losses. However, this is a trap. The market rapidly reverses and powerfully breaks a key high, and this sequence marks the formation of a Bullish Breaker Block.

How to Identify It: The last bearish (red) candlestick before the powerful upward move began is identified as the Bullish Breaker Block zone. This zone acts as a strong support platform, and it is expected that once the price retraces to this area, a new bullish move will initiate.

Types of Breaker Blocks

Bearish Breaker Block

The Bearish Breaker Block is the exact inverse of the bullish scenario and is often viewed as a precursor to a new bearish move in the market.

Here is how it unfolds: This time, the price first breaks a key high to entice traders into long positions. Subsequently, the market abruptly reverses and aggressively breaks a key low. This sharp reversal marks the formation of the Bearish Breaker Block.

How to Identify It: The last bullish (green) candlestick before the powerful down-move began constitutes the Bearish Breaker Block zone. This area now acts as resistance, and it is expected that when the price returns to this level, it will resume its bearish trajectory.

Bearish Breaker Block

How to Enter a Trade Using a Breaker Block

Identifying a valid Breaker Block is only half the battle; the other half is intelligently choosing an entry method. In practice, there are three common entry techniques, each suited to different trading styles and risk appetites.

Entry via Limit Order

This method is ideal for traders who cannot constantly monitor the market. Once the Breaker Block zone is identified, you simply place a Limit Order within that area:

  • For a Bullish Breaker Block, a Buy Limit order is placed.
  • For a Bearish Breaker Block, a Sell Limit order is placed.

The stop loss is set just beyond the Breaker Block zone—below the zone for a bullish setup or above it for a bearish one.

Primary Advantage: This is a “set-and-forget” approach, as the trader does not need to be present at the chart for the order to be executed.

How to Enter a Trade Using a Breaker Block

Entry with Candlestick Pattern Confirmation

This technique is suited for traders who prefer to see definitive confirmation from the price action itself before entering a trade. With this method, the trader waits for the price to re-enter the Breaker Block zone and then looks for a valid candlestick pattern to form as a confirmation signal.

Common confirmation signals include the formation of a Pin Bar or an Engulfing pattern within the zone.

Advantage & Drawback: This approach increases the trade’s probability of success. However, in fast-moving markets, a clear pattern may not form, causing the trader to miss the entry altogether.

sms-star

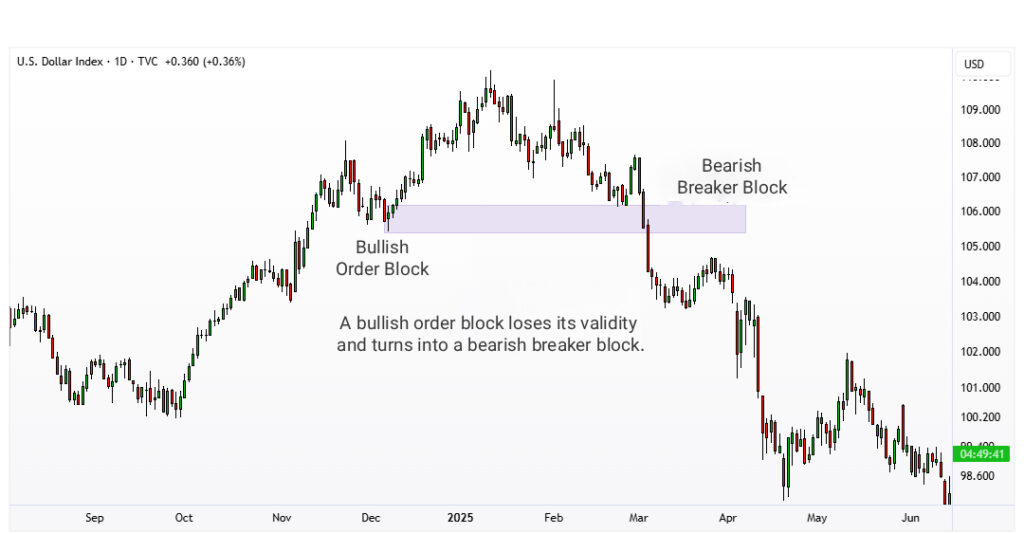
Every breaker block is a record of collective psychological error —a moment when the majority positions themselves on the wrong side of liquidity, and the market maker takes full advantage.

Entry with a Lower Timeframe Break of Structure (BOS)

This is a more precise and advanced approach that requires greater focus. The process is as follows:

  1. On your primary higher timeframe (HTF), such as the 4-hour chart, you wait for the price to reach the Breaker Block zone.
  2. Once the price enters this zone, you switch to a lower timeframe (LTF), like the 15-minute chart.
  3. On this LTF, you look for a Break of Structure (BOS) that aligns with your intended trade direction. For example, in a bearish scenario, you would look for the formation of a new lower low.

Key Advantage: This technique provides a highly precise entry point with a tight stop loss, making it possible to achieve a much higher risk-to-reward ratio.

How to Confirm Breaker Blocks in Forex Trading

A key point to remember is that not every zone that appears to be a Breaker Block is necessarily valid. To avoid false signals and increase the probability of success, traders should look for strong signs of confirmation. The two primary criteria for this are analyzing candlestick behavior and trading volume, as well as ensuring alignment with the overall market trend.

Analyzing Volume and Candlestick Strength for Confirmation

A valid Breaker Block typically forms as the result of a powerful and decisive market move.

  • Candlestick Strength: Pay close attention to the candles that create the Break of Structure (BOS). If these candles are long-bodied, powerful, and have a decisive close, it signals serious intent from institutional buyers or sellers. Conversely, small, indecisive candles undermine the validity of the Breaker Block.
  • Trading Volume: A significant increase in trading volume coinciding with the Break of Structure is a strong indicator of “Smart Money” participation. This liquidity footprint suggests that major players were involved in the move, giving the zone a higher degree of validity.
Confirmation

Using Price Action and Market Trend for Confirmation

Image showing a breaker block aligned with the market trend]

A fundamental rule in technical analysis is: “The trend is your friend.” This rule is especially important when dealing with Breaker Blocks.

  • A Bullish Breaker Block that forms within an established uptrend is far more reliable than one that appears in a counter-trend context.
  • Trading with the trend is like swimming with the current; it requires less effort and has a higher probability of reaching the objective.

To be certain, always assess the overall market direction first. If your Breaker Block setup aligns with the dominant trend, its validity and chance of success are significantly amplified.

sms-star

In most cases, broker blocks observed on lower timeframes are actually a reflection of minor order imbalances from higher timeframes, appearing as localized corrective price movements.

Overlap of Breaker Blocks and Order Blocks

In technical analysis, both an Order Block and a Breaker Block can serve as standalone, valid signals for a trader. However, when these two patterns overlap in the same price zone, the validity of that area is magnified significantly. It’s analogous to having two experts agree on the same conclusion, giving you much greater confidence in your decision.

  • Order Block: A supply or demand zone where large orders from institutions or major market players are concentrated. Price entering this zone typically causes a swift and strong market reaction.
  • Breaker Block: A zone that flips its role after a stop hunt has occurred. For example, a level that was previously support becomes resistance, or vice versa.

The true analytical power is revealed when an Order Block and a Breaker Block form in the same area, especially when the Order Block originates from a higher timeframe (HTF). This confluence simultaneously validates two key market principles: the presence of significant institutional order flow and the pattern of a level flipping its role after a liquidity grab.

Example: Imagine you identify a bearish Order Block on the daily chart. This area, on its own, is a strong potential sell zone. Now, if you drop down to the 4-hour timeframe and discover that a bearish Breaker Block has also formed within that same daily Order Block, you effectively have two independent market signals confirming each other.

Why is This Confluence Significant?

When a Breaker Block forms in confluence with an Order Block, the strength of that price zone is amplified. This means the probability of a strong price reaction at this level is exceptionally high, allowing a trader to enter a position with greater confidence. Simply put, such conditions create a high-probability (or A+) trade setup that not only has a greater chance of success but also provides more peace of mind for the trader executing it.

Conclusion

The Breaker Block is a practical Price Action concept that helps traders better identify potential price reversal zones. This structure, formed from a liquidity grab and the subsequent flipping of a price level, can offer insight into the decisions of major market players.

However, it is crucial to remember that no single pattern or tool is sufficient on its own. The value of a Breaker Block is significantly enhanced when used in conjunction with an analysis of the overall market structure, trend confirmation, and sound risk management principles. Experience and practice play a vital role in mastering the correct application of this tool.

Continue Reading
not-found
calendar 14 October 2025
Rate this article

Leave a Reply

Your email address will not be published. Required fields are marked *

No thanks