


Identifying the price levels where the market reacts has always been a priority for traders. Indicators in TradingView make it possible to detect these levels faster and with greater accuracy, simplifying the decision-making process. Using the best support and resistance indicator TradingView can make a significant difference in trading outcomes and provide a clearer perspective on market trends. If you want to know which tools are the most effective and how they can enhance your trading strategy, stay with us until the end of this article.

- Support and resistance indicators rely on computational algorithms to eliminate much of the human error involved in manually drawing levels.
- Their performance can vary across different timeframes, so parameters must be adjusted according to the specific market.
- The true effectiveness of these indicators becomes evident when the identified levels align with historical market data.
- Support and resistance indicators are complementary tools and should be used alongside the trader’s own analysis for more accurate decision-making.
What is a Support and Resistance Indicator in TradingView?
When traders look for key levels on a chart, one of the most effective tools they can rely on is the support and resistance indicator. These indicators analyze historical data such as pivot points, highs and lows, or trading volume to highlight areas where the price is more likely to react.
Within TradingView, such tools are typically created using Pine Script and display their results as lines or zones directly on the chart. Their main purpose is to help traders quickly identify where the market might stall or reverse direction. Using the best support and resistance indicator TradingView compared to manual drawing not only saves time but also increases the accuracy of analysis, which is why these tools are highly valued by many users.
Best Support and Resistance Indicators in TradingView
Among the various tools traders use for chart analysis, indicators that highlight key price levels are among the most popular. These tools help identify zones where price often pauses or changes direction, making it easier to spot potential trading opportunities. Choosing the right one can significantly improve the quality of analysis. Below are several widely used indicators in TradingView, each with its own unique features and settings. Using a support and resistance indicator in TradingView allows traders to act more quickly and rely less on manual chart drawing.
Auto Support & Resistance Indicator
This tool automatically identifies key levels based on pivots and trading volume. Once added to the chart, it displays lines that have historically acted as strong reaction points. For example, on BTC/USD in the one-hour timeframe, these levels often highlight reversal points clearly. Reducing the sensitivity setting will limit the number of lines plotted, resulting in a cleaner and more readable chart. This is one of the most practical options for those searching for an auto support and resistance indicator TradingView provides.

Support & Resistance Levels Indicator
A favorite among many users, this indicator draws the main horizontal lines on the chart and even signals potential breakouts or touches. It works best when paired with volume analysis, which helps confirm the strength of each level. For instance, in stock trading, combining this indicator with volume data can validate whether a breakout is genuine or likely to fail.

Supply & Demand Zones Indicator
Rather than showing single lines, this tool highlights broader supply and demand areas. Green zones represent demand areas, while red zones indicate supply. In currency pairs such as EUR/USD, these zones often mark strong areas where price is likely to react, providing traders with reliable entry and exit points.

Pivot Points Indicator for Key Levels
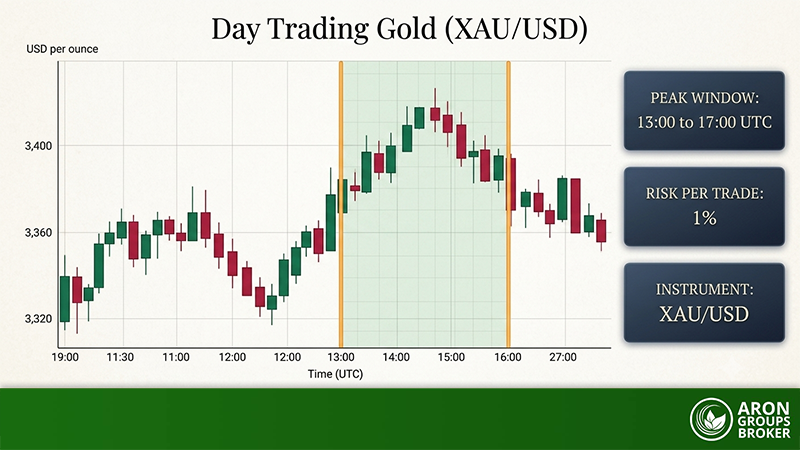
Pivot Points are one of the simplest and oldest tools in technical analysis. By calculating the average of the previous day’s high, low, and close, this indicator generates levels such as PP, S1, and R1. In short-term stock or forex trading, these points often serve as quick entry or exit levels. For daily scalping strategies, pivot levels remain one of the most frequently applied methods.


In the DominionMarkets list of the top five tools, the Pivot Points indicator is highlighted as one that not only identifies the previous day’s support and resistance levels but also provides insight into the market’s likely direction.
Combining Indicators with Other Tools
No single indicator is perfect, and the best results often come from combining multiple tools. For example, when a resistance level aligns with a moving average or a noticeable increase in trading volume, the likelihood of price reacting at that point becomes much higher. Many professional traders believe that the convergence of different signals can greatly strengthen the reliability of an analysis.
Ultimately, the choice between these tools depends on both the trader’s style and the market being traded. Some prefer simplicity and rely on Pivot Points, while others find Supply & Demand Zones more suitable. This shows that the search for the best tool should always consider individual needs. For this reason, many traders prefer to use a combination of indicators to identify support and resistance levels with greater accuracy.
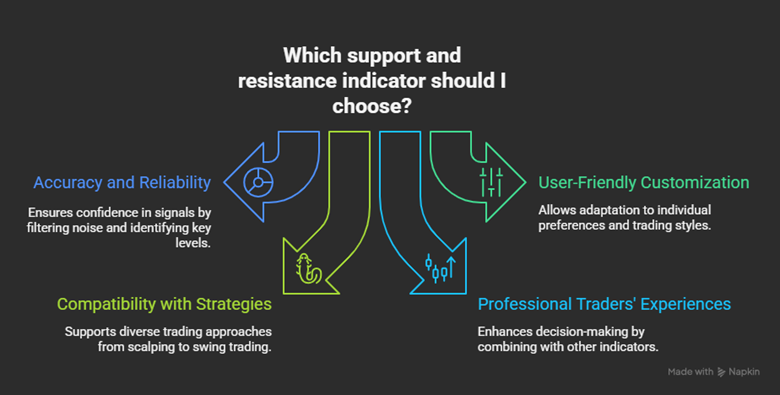
Criteria for Choosing the Best Support and Resistance Indicator
For traders to select the most suitable tool, several important criteria must be considered. These factors determine whether an indicator is appropriate for specific market conditions and individual trading styles. Insights from external sources and trader experiences highlight that accuracy, ease of customization, and compatibility with different strategies are the key elements. Using the best support and resistance indicator TradingView offers optimal results only when these criteria are properly applied.
Accuracy and Reliability of Levels
One of the most critical factors is the accuracy of the levels displayed. Indicators that incorporate trading volume and pivot points usually filter out more noise and identify levels where price is most likely to react. This significantly increases traders’ confidence in the signals provided.
User-Friendly Settings and Customization
An effective tool should have simple, adjustable settings. In TradingView, many indicators allow users to fine-tune sensitivity, the number of levels, and even the visual appearance of lines, enabling traders to adapt the tool to their individual preferences.
Compatibility with Diverse Trading Strategies
A valuable indicator should work well for both short-term strategies such as scalping and longer-term approaches like swing trading. The ability to adjust timeframes and adapt to different market environments makes an indicator far more versatile.
Professional Traders’ Experiences
Experienced traders emphasize that these tools should not be used in isolation. Many recommend combining support and resistance levels with other indicators such as RSI to strengthen the validity of signals. This approach helps reduce risk and ensures more precise decision-making.
Reddit users have repeatedly noted that they prefer an indicator capable of filtering out weak or less significant levels, keeping the chart clean and easy to read. This highlights the importance of removing unnecessary lines to focus only on the most impactful support and resistance zones.
How to Add and Configure a Support and Resistance Indicator in TradingView
Adding price level indicators to a TradingView chart is simple and takes only a few steps. This process allows you to quickly visualize key levels and plan your trades more effectively.
Step 1: Open the chart and find indicators
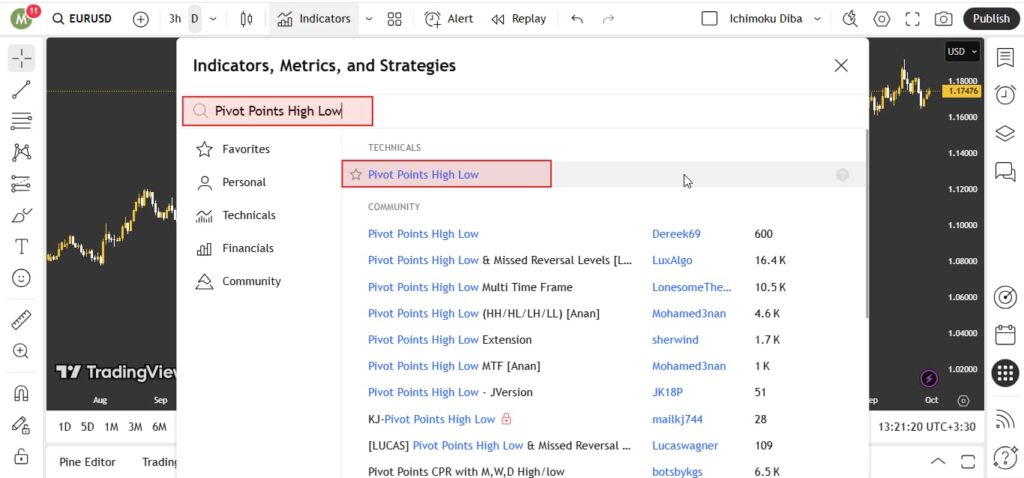
Open your desired chart, such as EUR/USD. At the top of the screen, click on the Indicators button. This section displays thousands of available tools.
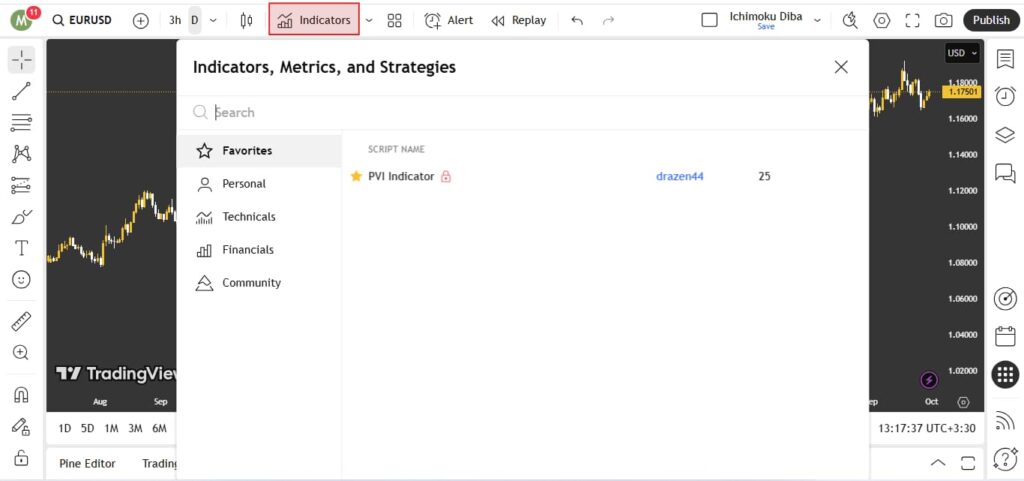
Step 2: Search and add the indicator
In the search bar, type Pivot Points High Low. Select the TradingView-built indicator and click Add to Chart. Support and resistance levels will now appear on your chart.
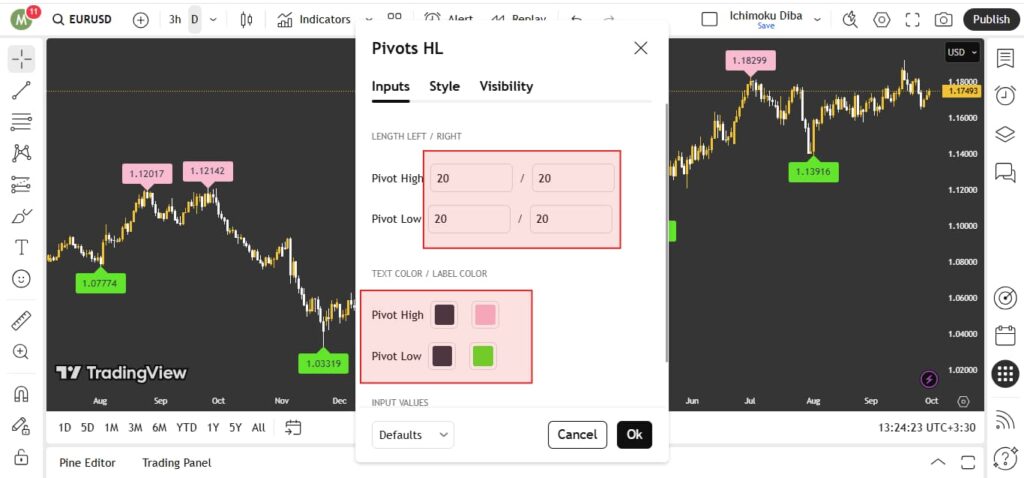
Step 3: Adjust lookback length and options
Click on the indicator’s name and open Settings. For a support and resistance indicator in TradingView, set the lookback length to 20 so that only major levels are displayed and false signals are reduced. You can also customize colors—for example, set support to green and resistance to red.
Step 4: Enable alerts
Within the settings, find the Alerts option and set a condition such as “price reaches support.” Activate email or app notifications so you’ll be informed when price nears key levels. For example, in stocks, this alert can notify you when resistance is broken.
With these steps, your chart will be fully prepared, and you can use the identified levels for your daily trading strategies.
Trading Strategies with Support and Resistance Indicators
Many traders rely on key levels to decide when to enter or exit trades. Using a support and resistance indicator in TradingView makes it possible to identify these levels more accurately and quickly, forming the basis for different trading strategies.
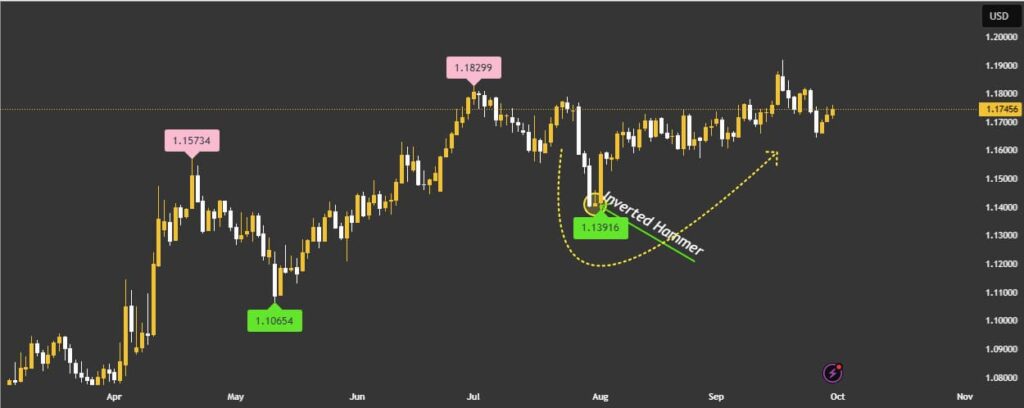
Entering Trades at Reversal Points
When price approaches a support level, wait for a strong candlestick pattern such as a hammer to confirm a potential reversal. After confirmation, a buy trade can be placed with a profit target set at the next resistance level. This method works particularly well in calmer market conditions.
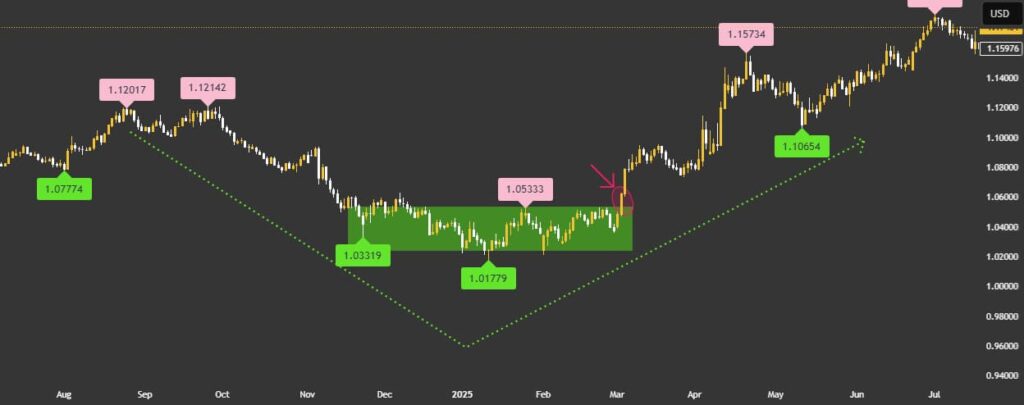
Identifying Valid Breakouts
To confirm whether a breakout is genuine, look for a candlestick close above resistance or below support, accompanied by increased volume. If valid, the broken level often reverses its role—resistance becomes support or support becomes resistance.
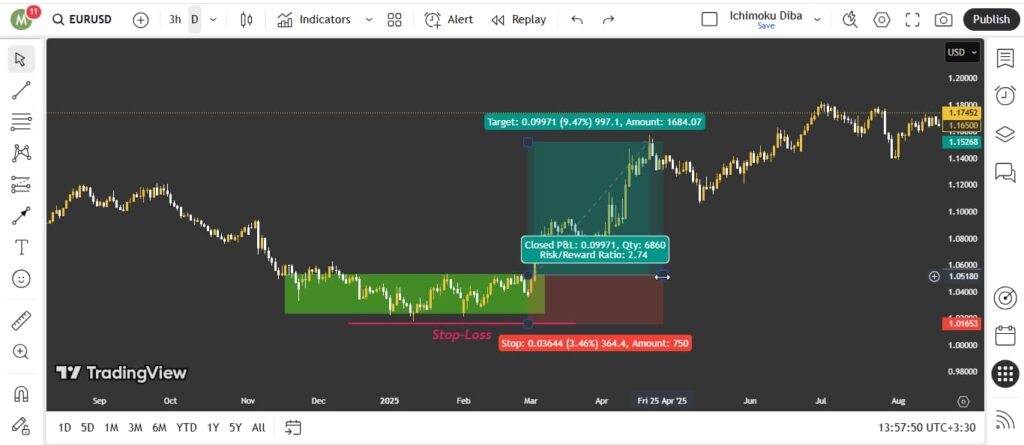
Risk Management and Setting Stop-Loss
Support and resistance levels are critical for managing risk. In a long position, the stop-loss should be set slightly below the support level, while in a short position it should be placed slightly above resistance. Maintaining a favorable risk-to-reward ratio, such as 1:2, ensures trades are more sustainable and disciplined.
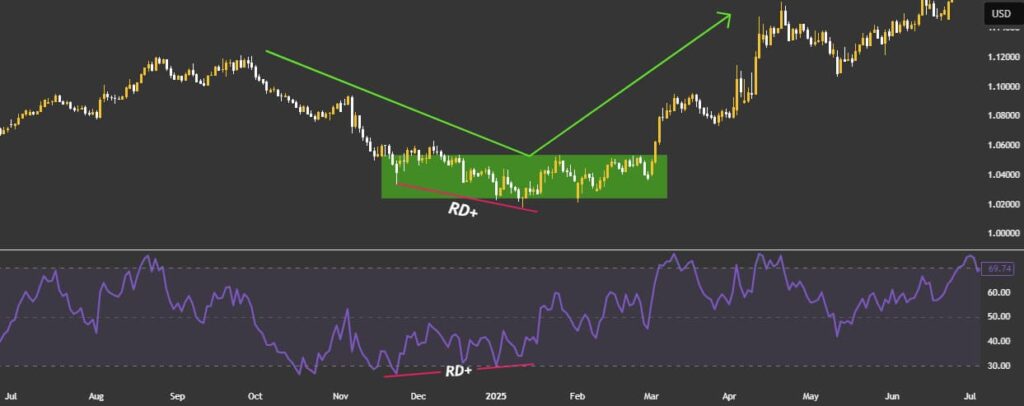
Combining Support and Resistance with RSI
The Relative Strength Index (RSI) measures market momentum. When price tests a support level and a positive divergence with RSI appears, the likelihood of a reversal increases. Combining these tools in TradingView provides a stronger entry signal.
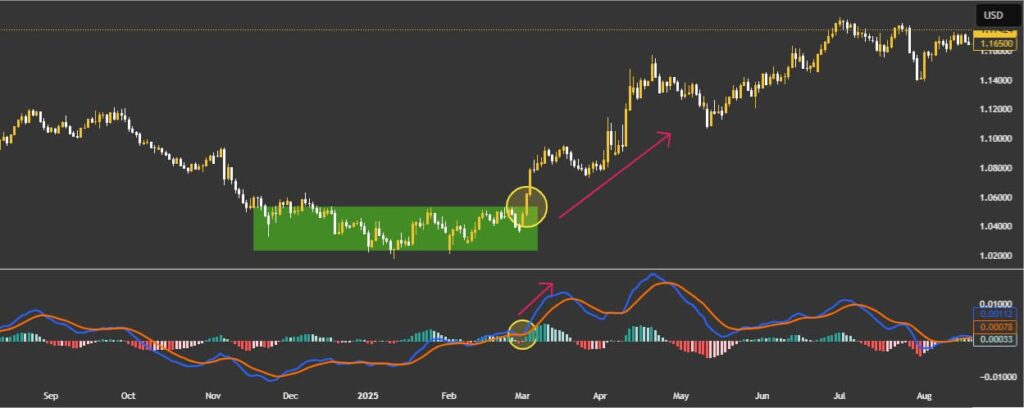
Combining Support and Resistance with MACD
The MACD (Moving Average Convergence Divergence) is widely used to analyze trends and momentum shifts. If price breaks through resistance while MACD indicates bullish momentum, the trend is more likely to continue. Similarly, when price sits at a support level and MACD crosses the signal line upward, it may serve as a strong entry signal. This highlights the importance of using one indicator alongside others to improve the accuracy of market analysis.
Advantages and Disadvantages of Using Support and Resistance Indicators
Using indicators to identify support and resistance levels comes with both strengths and weaknesses. Being aware of them helps traders choose the most suitable tools.
Advantages of Support and Resistance Indicators
The advantages of using support and resistance indicators include:
- Speed in identifying levels: These tools automatically plot levels on the chart, removing the need to manually draw them each time.
- Higher accuracy compared to manual methods: By applying algorithms based on pivots, volume, and price data, indicators can highlight levels that incorporate more criteria.
- Integration with other strategies: The levels identified can be combined with indicators such as RSI, MACD, or moving averages to increase the reliability of signals.
- Customizable for different trading styles: Most tools offer adjustable parameters such as sensitivity, number of levels, or lookback length, making them suitable for scalping, swing trading, or daily setups.
Disadvantages of Support and Resistance Indicators
The disadvantages of using support and resistance indicators include:
- Potential for false signals in volatile markets: In these conditions, even the best support and resistance indicator TradingView provides may generate misleading signals.
- High dependency on parameters: If sensitivity is set too high, charts become noisy; if too low, important levels may be missed.
- Weakness on lower timeframes: Some indicators do not perform as reliably on short timeframes.
- Changing market behavior: Levels that were once valid may lose relevance as market conditions evolve.
By considering both benefits and limitations, traders can make better choices and prioritize the tools that align with their strategy and trading style.
Conclusion
Choosing the best support and resistance indicator TradingView offers ultimately depends on each trader’s strategy. Some prefer simplicity and opt for tools like Pivot Points, while others find supply and demand zones or more advanced indicators better suited to their style. What truly matters is testing these tools in a demo account and adapting them to real market conditions. Combining identified levels with indicators such as RSI or MACD can further strengthen analysis and improve decision-making. Therefore, it is recommended to experiment with different options and, based on personal experience, select the one that fits your trading approach best.