 EN
EN


Technical

-
Balanced Price Range in ICT: From Imbalance to Equilibrium
 15 June 2026
,
Abe Cofnas
15 June 2026
,
Abe Cofnas
A balanced price range (BPR) is an ICT idea that describes a “middle zone” on a chart where price often pauses and evens out after a strong move. Think of it as the market trying to restore balance after a brief stretch of disorder. Even if you are new and wondering what is balanced price […]
- Read more

-
How the weekly high and low form between Monday and Friday, and how to trade them
4 June 2026
,
Abe Cofnas
ICT Weekly Profiles are recurring patterns describing how Forex markets typically form their weekly high and weekly low between Monday and Friday. Rather than offering a guaranteed script, these profiles outline probabilities around specific days—such as when the classic Tuesday low might form or when Wednesday reversals tend to occur. Understanding these patterns helps traders […]
- Read more

-
How to Identify Market Direction Using Liquidity and Order Flow
31 May 2026
,
Abe Cofnas
ICT daily bias is a framework for determining whether the market is more likely to be bullish or bearish for the current trading day. Originating from Michael Huddleston’s Inner Circle Trader (ICT) methodology, it focuses on reading the daily timeframe structure, liquidity levels, and institutional order flow rather than relying on a single indicator. Understanding […]
- Read more

-
A practical ICT framework for the weekly gap, consequent encroachment, and institutional price delivery
23 May 2026
,
Abe Cofnas
The week opening gap reveals how Smart Money re-prices risk after the weekend, creating a short-lived inefficiency in price delivery across Forex, indices, and futures. Understanding the importance of NWOG is crucial, as it helps traders identify key support and resistance levels and provides insight into overall market structure. Many traders observe this gap on […]
- Read more

-
Trading the 07:00-09:00 GMT kill zone with institutional order flow
23 May 2026
,
Abe Cofnas
The ICT London open strategy, developed through the teachings of Michael J. Huddleston, known as the Inner Circle Trader, represents a departure from indicator-based trading towards understanding how institutional order flow actually moves markets. At its core, this approach focuses on the London kill zone, a specific two-hour window between 07:00–09:00 GMT when European banking […]
- Read more

-
A Trader’s Guide to the ICT Friday Liquidity Model
19 May 2026
,
Abe Cofnas
The TGIF setup represents one of the most structured end-of-week trading approaches within ICT methodology. This algorithmic trading model targets reversals after the weekly high or weekly low has been established, offering traders a repeatable framework for Friday sessions across forex pairs, indices, and gold CFDs. This is not a generic Friday strategy. The TGIF […]
- Read more
-
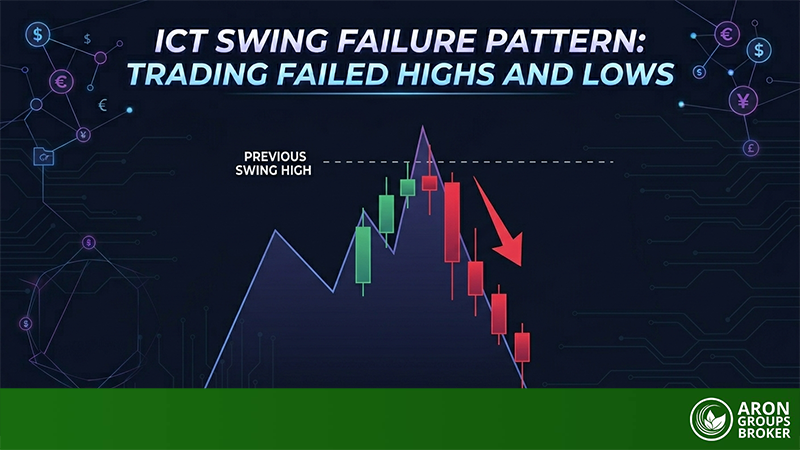
ICT Swing Failure Pattern (SFP): How to Trade Failed Highs and Lows in Forex
18 May 2026
,
Abe Cofnas
In modern Forex trading, price does not move randomly. It moves toward liquidity. The ICT Swing Failure Pattern (SFP) is one of the clearest ways to see this behaviour in action. It shows how price breaks a previous high or low, triggers stop losses, and then reverses sharply. This is not a coincidence—it is a […]
- Read more
-
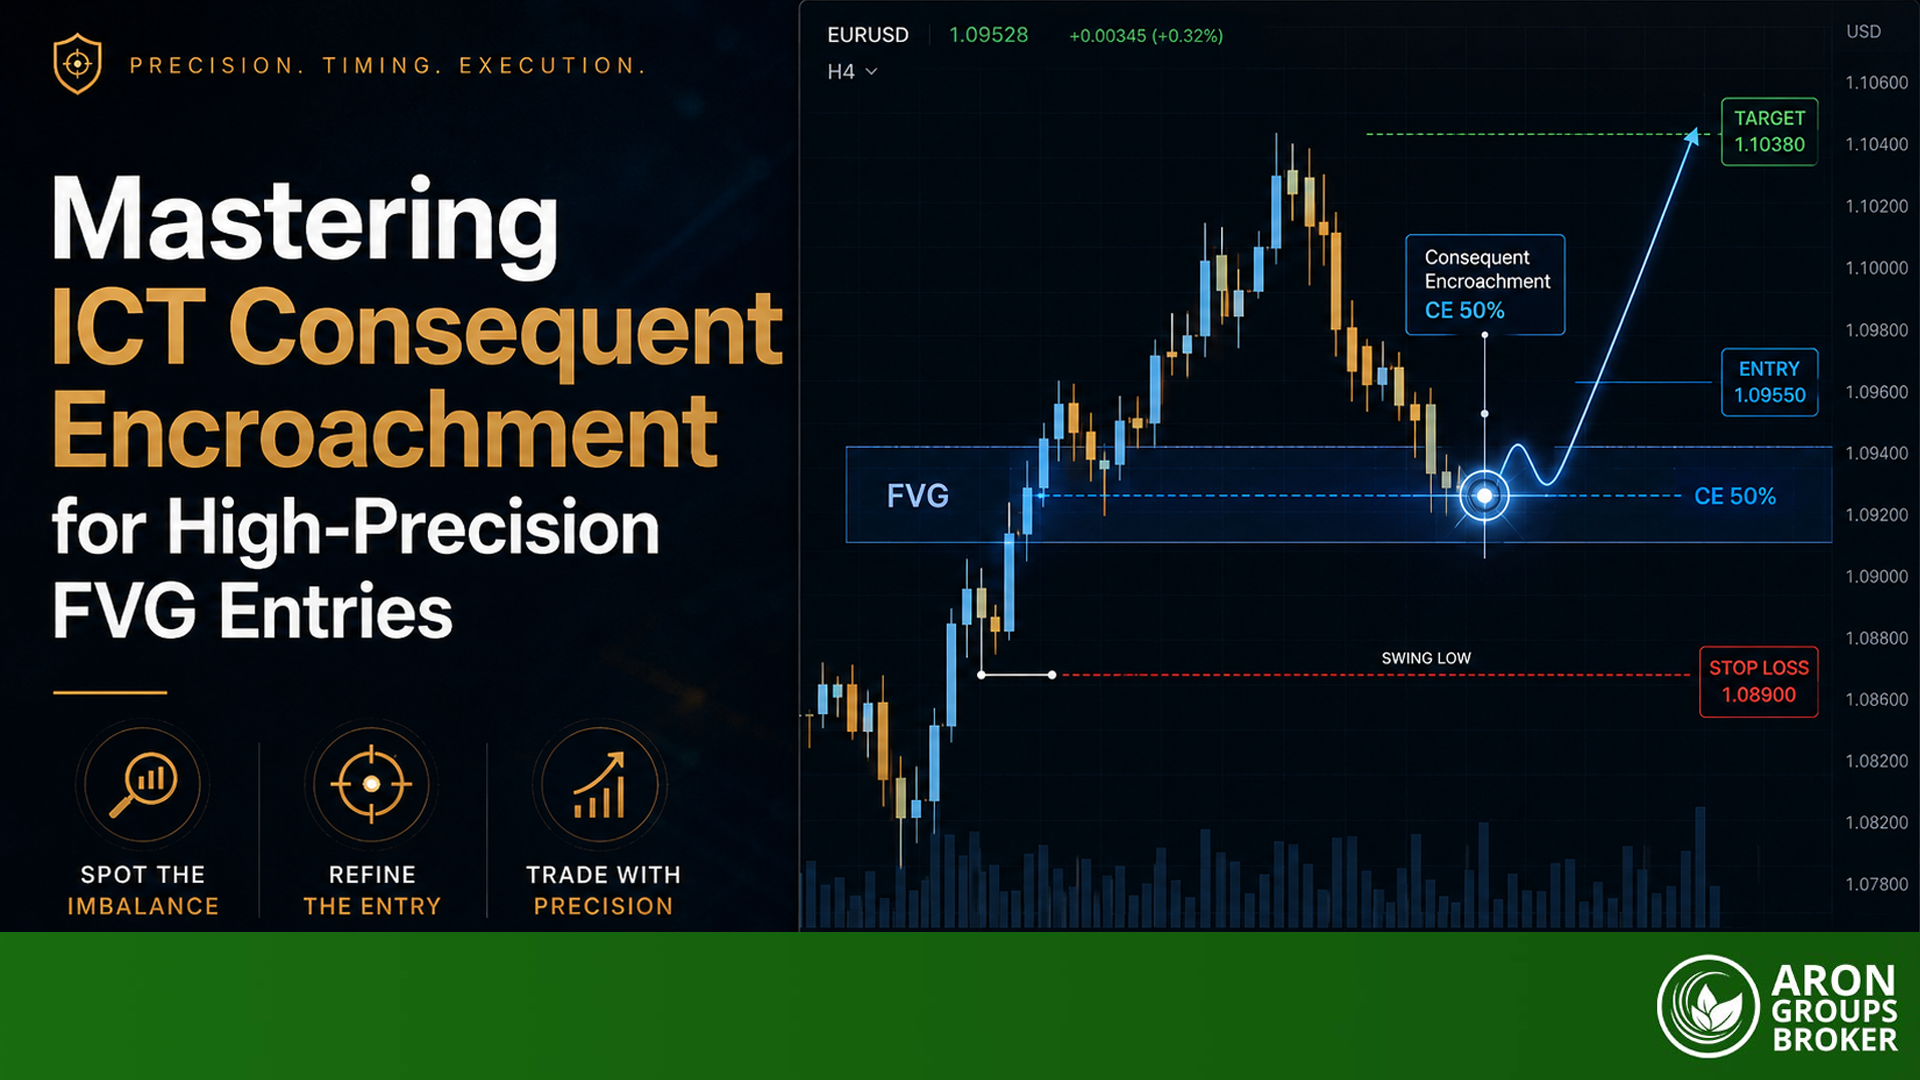
Mastering ICT Consequent Encroachment for High-Precision FVG Entries
13 May 2026
,
Abe Cofnas
Consequent Encroachment (CE) is one of the most useful and most misused ideas in ICT-style trading. Many traders mark the midpoint of a Fair Value Gap (FVG) and assume the price must react there. That is where the problem starts. CE is not a magic support or resistance line. It is a pricing reference inside […]
- Read more
-
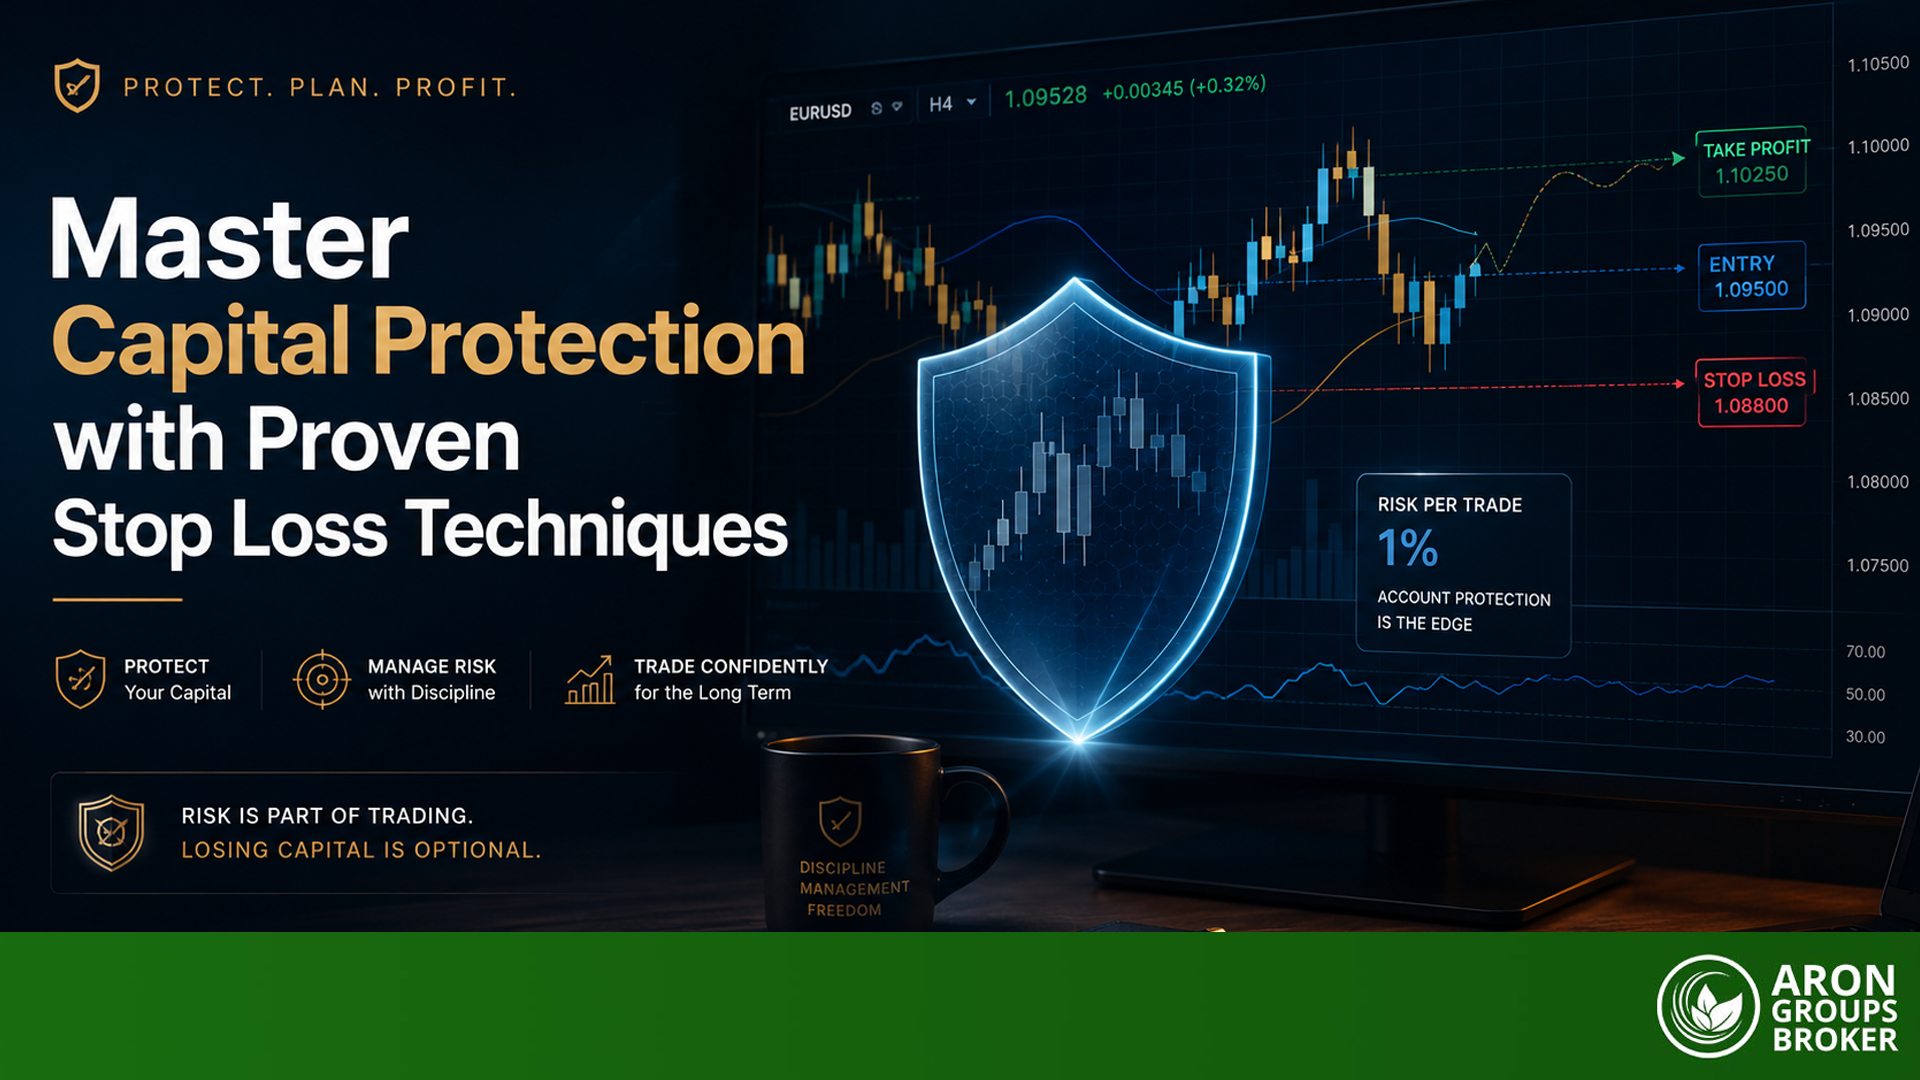
Master Capital Protection with Proven Stop Loss Techniques
13 May 2026
,
Abe Cofnas
Successful trading is not only about good entries but also about strong risk management. A stop loss protects capital by limiting losses when the market moves unexpectedly. The best stop loss strategy relies on tools such as volatility indicators, market structure, and risk-to-reward analysis rather than arbitrary price levels. This guide explains practical stop-loss methods […]
- Read more
-
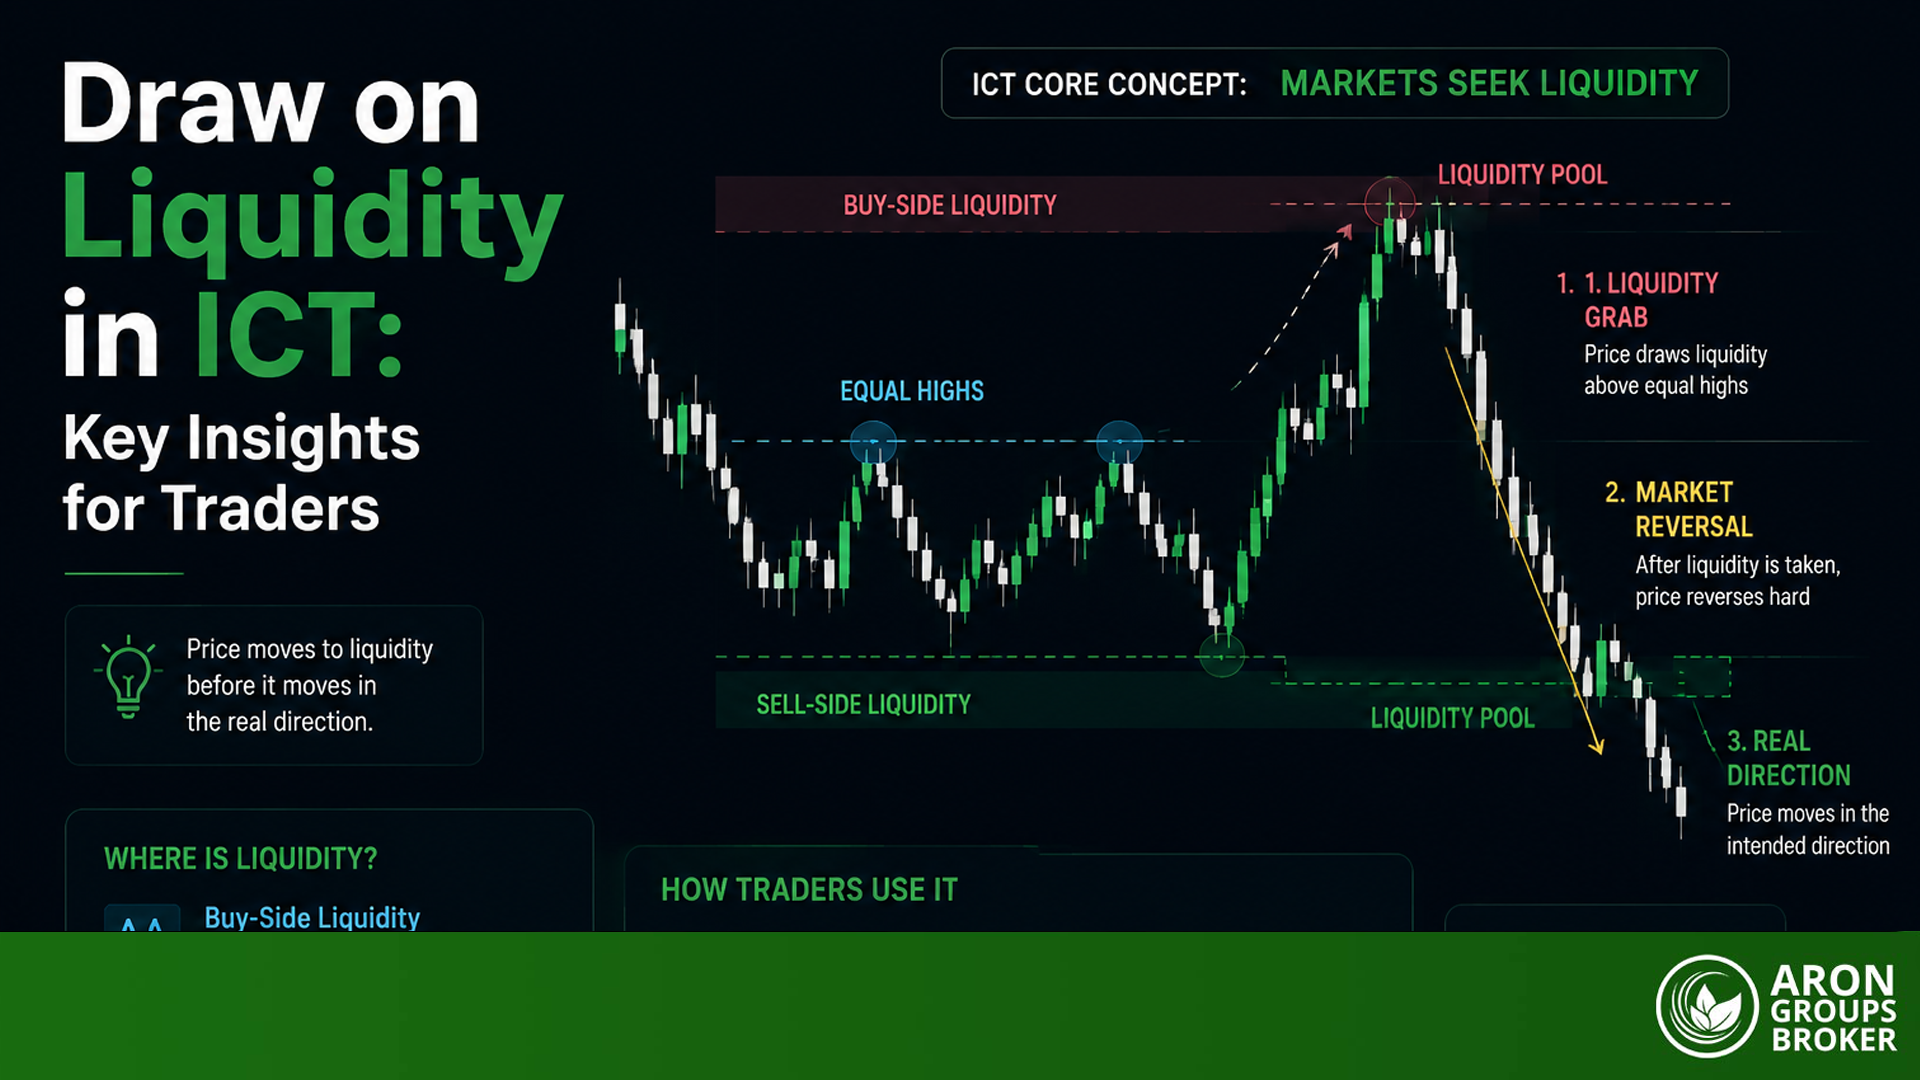
Draw on Liquidity in ICT: Key Insights for Traders
8 May 2026
,
Abe Cofnas
In ICT terms, a draw on liquidity is the idea that price usually has a “common-sense” destination. Markets often travel toward places where orders stack up, equal highs, equal lows, prior day high/low, and other obvious swing points. It’s not a magic prediction trick, and it definitely doesn’t mean the price will reverse once it […]
- Read more
Load more