icon icon Home
icon icon Accounts
icon icon Quick start
icon icon Symbols

How the weekly high and low form between Monday and Friday, and how to trade them

Author
Abe Cofnas
Abe Cofnas
calendar Last update: 4 June 2026
watch Reading time: 9 min

ICT Weekly Profiles are recurring patterns describing how Forex markets typically form their weekly high and weekly low between Monday and Friday. Rather than offering a guaranteed script, these profiles outline probabilities around specific days—such as when the classic Tuesday low might form or when Wednesday reversals tend to occur.

Understanding these patterns helps traders avoid chasing random moves and instead focus on likely liquidity runs during the new york session or London open. This guide covers what ICT weekly profiles are, how they work, the main profile types, a step-by-step workflow, common mistakes, tools on MT5, and essential risk management practices.

bookmark
Key Takeaways
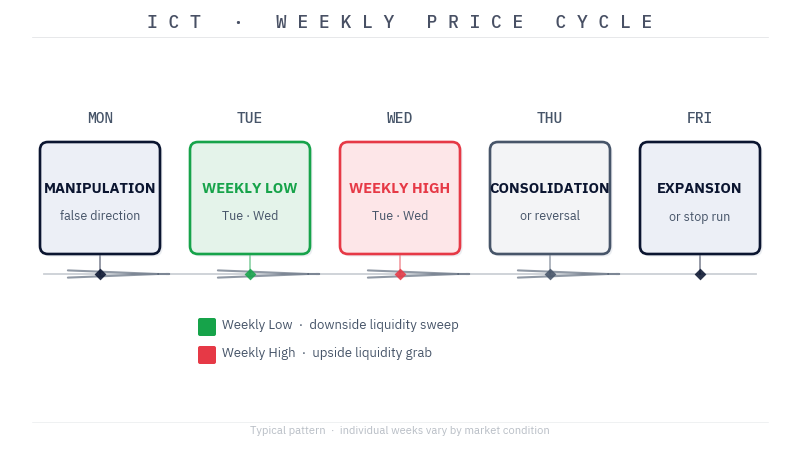
  • ICT Weekly Profiles describe recurring price behaviour patterns observed during a trading week, providing a framework to understand when the weekly high and low of the week typically form across Monday to Friday.
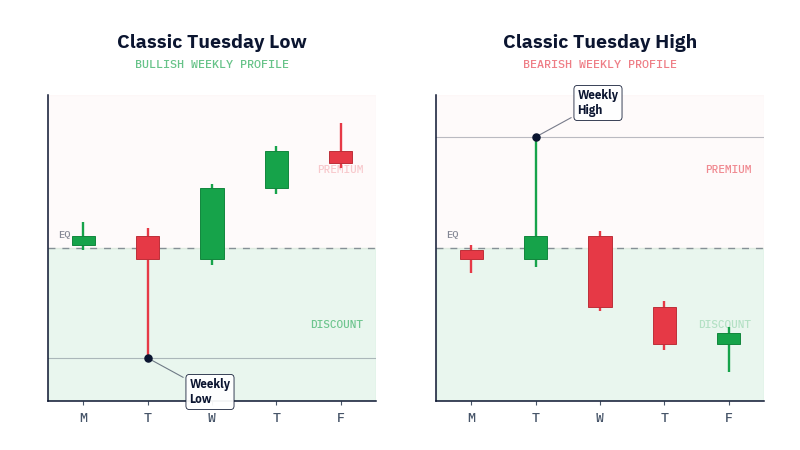
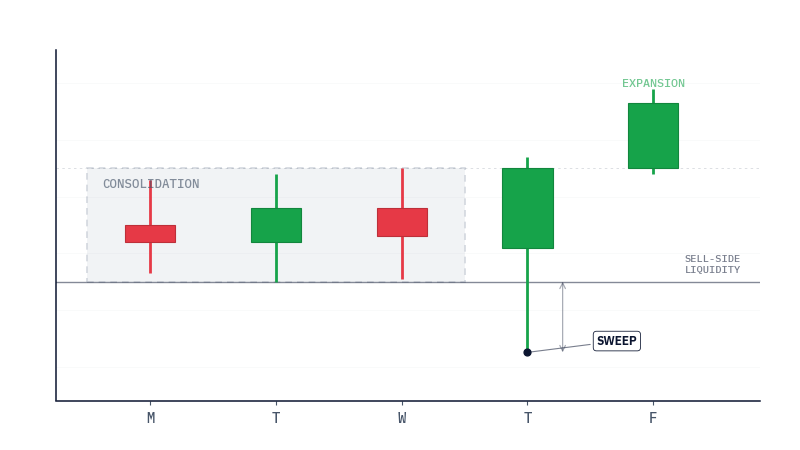
  • Common patterns include the classic Tuesday low, classic Tuesday high, consolidation Thursday bullish reversal, consolidation midweek rally, and seek and destroy bullish Friday setups.
  • These profiles focus on London or New York session timing rather than exact predictions, requiring confirmation from market structure and liquidity concepts.
  • Traders must combine ICT weekly range profiles with proper risk management, including stop losses beyond liquidity pools and careful position sizing.
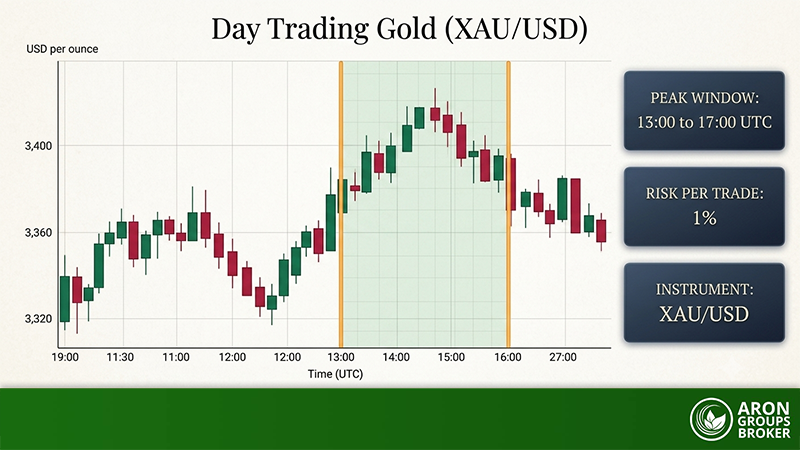
  • Aron Groups Broker offers MT5 access where traders can practise these concepts through demo accounts, copy trading, and prop-style challenges.

What Are ICT Weekly Profiles?

ICT Weekly Profiles are repeatable timing and structure patterns describing where the high of the week and low of the week often form relative to higher timeframe premium array and discount array zones. The weekly opening price is critical for determining price movement direction, and these extremes often form early in the trading week.

These profiles examine Monday to Friday price behaviour, particularly during London and New York sessions, to anticipate where institutional buying or institutional selling may seek liquidity above highs or below lows. A typical profile integrates weekly range, premium/discount equilibrium, liquidity pools, and manipulation before expansion phases.

ICT weekly range profiles function as frameworks—not rules. Traders still require confluence from market structure, fair value gaps, order blocks, and major news events like interest rate announcements. On Aron Groups Broker’s MT5 platform, traders can zoom out to H4 or D1 charts to mark likely weekly extremes before planning intraday entries.

sms-star

Risk Disclosure

CFDs are complex instruments and come with a high risk of losing money rapidly due to leverage. You should consider whether you understand how CFDs work and whether you can afford to take the high risk of losing your money. Past performance is not indicative of future results. This content is provided for educational purposes only and does not constitute investment advice.

sms-star

Key Point:  A weekly profile is a probability map, not a guaranteed script. It tells you where the high and low are likely to form, not that they must.

How ICT Weekly Profiles Work in Practice

A typical trading week unfolds in stages. Monday often sets an early range or creates false direction through manipulation. Tuesday and Wednesday frequently form the actual high of the week or low of the week. Thursday may consolidate or reverse, while Friday either extends moves or runs stops through seek and destroy price action.

Mini Example: A Bullish Week on EURUSD

Consider a bullish week on EURUSD: price engineers liquidity above a prior high on Monday, the classic Tuesday low prints during the London session on Tuesday, and price rallies into premium by Thursday. Similar patterns appear on XAUUSD and indices.

ICT Weekly Price cycle

The role of time-of-day matters significantly. The London open (2-5 AM EST), new york session open (8:30 AM EST), and late new york session close mark windows where weekly turning points appear. Consolidation Thursday bullish reversal or consolidation Thursday bearish reversal patterns often align with major scheduled data like US CPI or FOMC meetings.

These profiles work best when combined with directional bias from the higher timeframe trend and macro narrative rather than traded in isolation.

Key ICT Weekly Profiles and Concepts

This section breaks down the main ICT weekly profiles. Each describes typical structure, conditions for bullish and bearish trends, and what traders should watch. Examples include the classic tuesday low, classic tuesday high, Wednesday weekly bullish reversal, Wednesday weekly bearish reversal, consolidation midweek rally, consolidation midweek decline, Thursday reversals, and the seek and destroy bullish friday pattern.

Classic Tuesday Low of the Week

In a bullish environment, the market often sets the weekly low on Tuesday. The Classic Tuesday Low of the Week pattern indicates that in bullish trends, prices may drop on Tuesday to form the weekly low after manipulation on Monday.

In bullish conditions, the Classic Tuesday Low of the Week often forms when price drops into a higher timeframe discount array on Tuesday, following manipulation on Monday. Traders can mark higher-timeframe discount areas over the weekend, then look for Tuesday to tag or overshoot that zone.

Confirmation comes from bullish order blocks, fair value gaps filling, and a market structure shift on M15-H1. This profile commonly appears after a corrective pullback inside an established uptrend when pair institutional buying becomes active.

How the weekly high and low form between Monday and Friday, and how to trade them

Classic Tuesday High of the Week

The bearish mirror occurs when the weekly high forms on Tuesday during downtrends. Monday provides false hope of a sustained rally, then Tuesday runs higher into a premium array, sweeps pending buy side liquidity above swing highs, and fails.

Traders can draw weekly premium areas using Fibonacci equilibrium on their Aron Groups MT5 charts. Once a classic tuesday high appears likely, bearish structure shifts confirm short setups aligned with wider bearish trends. Early-week PMI releases often provide narrative for this engineered push into premium.

Wednesday Low and Wednesday High of the Week

When Tuesday fails to establish the extreme, the market often delays to Wednesday. Midweek reversals often occur on Wednesday, potentially followed by price expansions into Thursday and Friday.

The Wednesday low profile shows Monday and Tuesday hovering above discount without tapping liquidity; the wednesday low finally forms during London or york session before reversing higher. Conversely, The Wednesday High of the Week is typically established in bearish conditions when price rises into a higher timeframe premium array on Wednesday, after fluctuating below it on Monday and Tuesday.

Traders should exercise caution adding positions before Wednesday events like CPI or interest rate release data.

Consolidation Thursday Bullish Reversal

The consolidation thursday bullish reversal occurs when markets range from Monday to Wednesday, then form a sharp upward movement on Thursday from discount levels. In bullish trends, prices may consolidate from Monday to Wednesday, then run the intra week low and reject it, forming a market reversal on Thursday.

This pattern shows tight price consolidation early Thursday followed by a stop run below the range and fast bullish reversal price action near New York open. Look for confluence: weekly low forming, discount array levels reached, and clear market structure shift before entering.

Consolidation Thursday Bearish Reversal

The opposite scenario—consolidation thursday bearish reversal—occurs when markets grind higher Monday to Wednesday, then reverse from premium levels Thursday. In bearish trends, prices may consolidate from Monday to Wednesday, then run the intra week high and reject it, forming a market reversal.

Price fails to continue higher after triggering buy stops and late breakout entries. Traders on MT5 should look for rejection wicks on H1-H4, bearish order blocks, and structure breaks before shorts. Pair institutional selling often appears at these levels.

Consolidation Reversal Bullish

Consolidation Midweek Rally

In bullish weeks, price may spend Monday to Wednesday consolidating near mid-range before breakout. When price consolidates from Monday to Wednesday in a bullish market, it may breach the weekly high and continue to expand higher into Friday.

This consolidation midweek rally starts after a quiet Tuesday or Wednesday low forms within a tight range. Once price clears consolidation, momentum buyers and sell stops fuel continuation toward premium. Avoid chasing after price has travelled most of the weekly average range.

Consolidation Midweek Decline

The bearish analogue—consolidation midweek decline—shows tight Monday to Wednesday ranges before price breaks lower. In bearish markets, if prices consolidate from Monday to Wednesday and then run into the intra-week low, they are likely to expand lower into Friday.

This occurs when a Tuesday or Wednesday high is already in place but market consolidates before decisive selling. News surprises during new york local time sessions can accelerate this price drop. Monitor spreads on Aron Groups Broker as sharp declines may increase slippage risk.

Seek and Destroy Bullish Friday

The seek and destroy bullish friday profile shows sideways trading Monday to Thursday, then aggressive stop hunting above the weekly high on Friday. Price consolidates just under the intra week high Thursday, luring short sellers, then breaks higher Friday—destroying bearish positions.

This pattern frequently appears around Non-Farm Payrolls data, especially during summer months with thinner liquidity. Conservative traders might wait for the following week rather than forcing late Friday entries. The pattern highlights how markets induce sell stops before continuing higher.

sms-star

Did You Know?  Seek and destroy Friday moves cluster around Non-Farm Payrolls and thin summer liquidity, when fewer resting orders make stop runs easier to engineer.

Neutral / Low-Probability Weekly Profile

Some weeks show neutral low probability profile behaviour—tight ranges with no clear premium or discount test. These often occur awaiting interest rate announcements or major macro events when the market fails to provide directional clarity.

In these periods, avoid trading aggressively. Over-trading small ranges leads to heavy costs without meaningful opportunity. Reduce position size, focus on capital preservation, and use time for backtesting instead. Standing aside is valid when weekly narrative conflicts across timeframes.

Wednesday Weekly Bullish and Bearish Reversals

Both wednesday weekly bullish reversal and wednesday weekly bearish reversal demonstrate institutional logic behind midweek fake-outs.

The Wednesday Weekly Bullish Reversal occurs when price consolidates from Monday to Tuesday, drops into the higher-timeframe discount array on Wednesday to induce sell stops, and then reverses strongly. Large players buy aggressively after sweeping discount, causing fast reversals.

The Wednesday Weekly Bearish Reversal pattern occurs when prices consolidate from Monday to Tuesday, then rise to activate buy stops on Wednesday before reversing sharply. Heavy selling appears at premium, driving prices lower Thursday and Friday.

These midweek reversals occur near significant support or resistance on weekly charts. Combine with liquidity concepts—equal highs/lows and pending sell side liquidity clusters—before counter-trend entries.

Q: How do I know which weekly profile is unfolding before the week is over?

A: You confirm it in stages rather than predicting it. Mark premium and discount zones at the weekend, watch which session sweeps liquidity, then wait for a market structure shift on M15 to H1 to validate the bias. If the expected extreme is taken out without a reaction, the profile is invalid and you stand aside.

How to Use ICT Weekly Profiles Step by Step

The workflow below turns the profiles into a repeatable weekly routine, from weekend preparation to late-week management.

five step weekly workflow

Step 1: Weekend Analysis

Mark prior week’s high of the week and low of the week. Identify higher timeframe trend and premium/discount zones. Note market driver news events like FOMC, NFP, or CPI.

Step 2: Early-Week Bias

On Monday and early Tuesday, observe how price behaves relative to weekly open and premium/discount. Form expectations about classic tuesday low or classic tuesday high possibilities.

Step 3: Midweek Confirmation

By Wednesday, evaluate whether the weekly extreme is likely in place by studying structure shifts, liquidity sweeps, and whether discount or premium has been reached. Watch for bearish reversal price action or bullish signals.

Step 4: Setup Execution

Once a likely weekly profile is identified, align intraday entries on M15-H1 with that narrative using clear entry, stop loss, and target logic.

Step 5: Late-Week Management

On Thursday and Friday, manage positions, avoid emotional trades after large moves, and document how actual price path matched anticipated profiles.

sms-star

Rule: Trade the profile you can confirm, not the one you hope for.

Best Conditions for Applying ICT Weekly Profiles

Profiles work best when:

  • A higher timeframe trend is established (bullish or bearish)
  • Markets move from discount to premium (or vice versa)
  • Active macro calendars provide clear direction
  • Instruments respect London and york local time session flows

Higher timeframe context can be utilized to determine market bias by analyzing premium and discount levels on daily or weekly charts. The ICT Weekly Profiles framework includes specific patterns for identifying potential weekly highs and lows based on price behavior during the trading week.

Months with central bank meetings (March, June, September, December) often produce stronger weekly ranges. Major Forex pairs and gold exhibit ICT weekly behaviour more cleanly than exotic markets. Choppy, low-volatility weeks, holiday periods, and economic news conflicts reduce edge.

Common Mistakes and Risks When Trading ICT Weekly Profiles

Common errors include:

  • Assuming patterns must repeat every week
  • Entering without confirmation from market structure
  • Overconfidence in single setups
  • Forcing trades daily based purely on calendar
  • Neglecting risk management on high-impact news

When price fails to form expected lows or highs, traders who recently rallied into positions without stops face significant losses. Copying profiles from social media without understanding concepts leads to blind risk-taking with leverage. Despite increased AI adoption across industries, there is continual demand for skilled professionals in trading analysis and risk management.

sms-star

Risk Warning:  Trading a weekly profile without a predefined invalidation level exposes the whole account to a single failed read. Define the stop before the trade, not after.

Tools, Indicators, and Platforms That Help With ICT Weekly Profiles

ICT concepts are price-action based, but tools assist visualisation. On Aron Groups Broker’s MT5 platform, use weekly and daily timeframes to mark previous highs, lows, and equilibrium. Session separators show London and new york session windows clearly.

Indicators marking weekly open prices and measuring weekly ATR help gauge how far price has recently declined or expanded relative to typical ranges. Economic calendars align expectations with scheduled events.

Organizations are increasingly adopting AI-native infrastructures to manage tasks, and trading platforms evolve similarly. Successful organizations focus on redesigning workflows instead of merely automating processes—apply this principle to your trading routine. Copy trading and prop accounts at Aron Groups allow observing experienced traders, though independent learning remains essential.

Q: Do I need a special indicator to trade weekly profiles?

A: No. The profiles are read directly from price using weekly and daily timeframes to mark prior highs, lows, and equilibrium. A weekly open marker, a weekly ATR reading, and an economic calendar are enough; extra indicators tend to clutter the chart rather than sharpen the read.

Risk Management and Best Practices With ICT Weekly Profiles

Practical risk management guidelines:

  • Define clear invalidation: if a supposed classic tuesday low is taken out Wednesday without bullish reaction, the profile is invalid. Adjust for high-impact data days, accepting slippage possibility.
  • Keep a detailed journal logging expected patterns, actual formations, entry/exit decisions, and emotional state. Refine performance over months, not days.
sms-star

Key Notes:

  • Invalidation comes first: a swept level with no reaction kills the profile.
  • Size for the high-impact day, not the quiet one.
  • Judge performance over months of journal entries, not single weeks.

ICT Weekly Profiles FAQs

TopicWhat You Need to Know
Timeframe SelectionUse weekly profiles to establish directional bias on higher timeframes, then look for execution opportunities on intraday charts. Very low timeframes tend to produce less reliable signals when used alone.
Suitability for Busy TradersTraders with limited screen time can still benefit by concentrating on a few predefined trading sessions and preparing their analysis ahead of the trading week.
Backtesting ApproachBuild a database of historical examples, categorize weekly price behavior, and measure outcomes using realistic trading conditions to evaluate consistency.
Combining With Other MethodsWeekly profiles can serve as a market framework that enhances existing trading strategies by helping identify when specific setups may have a higher probability of success.
Application Across MarketsThe concepts may transfer to instruments beyond forex, but each market has unique characteristics that require separate testing and validation before live trading.

Conclusion

ICT Weekly Profiles offer a structured approach for anticipating when and where the weekly high and weekly low may form. By understanding patterns like the classic tuesday low, consolidation thursday bullish reversal, consolidation midweek rally, and seek and destroy bullish friday, traders gain timing frameworks rather than certainties.

Combining these concepts with solid risk management and institutional order flow analysis helps traders make informed decisions. Test these ideas on demo or small live accounts with Aron Groups Broker in 2026, integrating them into a complete trading plan rather than using them as standalone signals.

Nothing in this article constitutes financial advice. Forex and CFD trading involves substantial risk, making education and discipline essential for long-term success.

Continue Reading
not-found
calendar 4 June 2026
Rate this article

Leave a Reply

Your email address will not be published. Required fields are marked *

No thanks