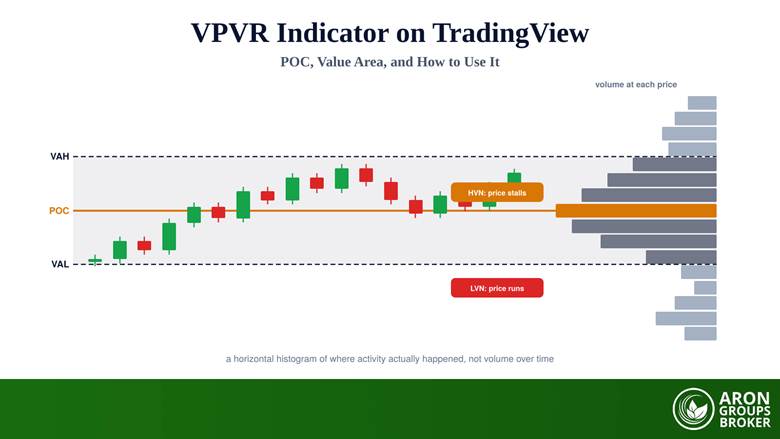

The VPVR indicator, short for Volume Profile Visible Range, plots how much volume traded at each price level for the candles currently visible on your chart. It draws that data as a horizontal histogram down the side of the price pane, so instead of asking how much volume happened at ten o’clock, you are asking where volume happened, and which prices the market cared about most.
That change of question is the whole point. A conventional volume histogram sits under the chart and measures activity over time; a volume profile rotates the same data ninety degrees and measures activity over price. The result is a picture of agreement and indifference: thick bars where buyers and sellers transacted heavily, thin bars where price barely paused. Used carefully, that picture is a genuine input to a trading edge, and used carelessly it is a wall of colour that confirms whatever you already believed.
This guide settles the VPVR and VRVP naming confusion, walks through the five terms that carry the indicator, shows how to configure it on TradingView, separates the visible-range profile from its fixed-range and session cousins, covers acceptance and rejection strategies, and states the tool’s limits honestly.
- VPVR shows volume traded at each price level for the candles currently on screen, drawn as a horizontal histogram rather than a bar chart over time.
- Five terms carry it: the POC is the price with the most volume, the value area holds roughly 70% of volume between VAH and VAL, and HVN and LVN describe thick and thin nodes.
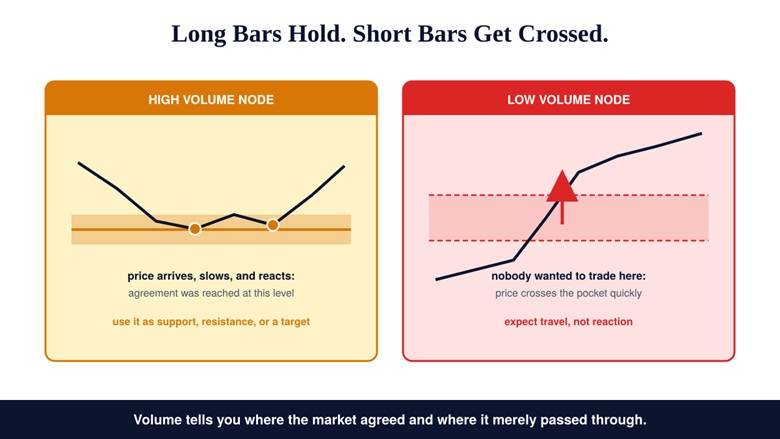
- Long bars mark congestion that tends to act as support or resistance; short bars mark pockets price travels through quickly.
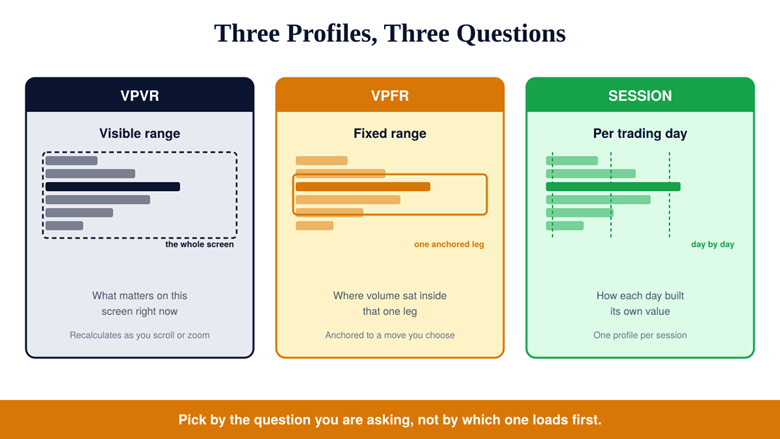
- VPVR recalculates as you scroll or zoom, VPFR stays anchored to a range you choose, and session profiles rebuild each trading day.
- It is reactive, not predictive, most reliable where real volume exists, and best used as a confluence filter rather than a standalone signal.
What Is the VPVR Indicator?
VPVR is a volume profile calculated over the visible range: whatever candles are on your screen at this moment. For each horizontal price row it totals the volume that changed hands there and draws a bar proportional to that total. Scroll the chart or zoom out and the profile recalculates, because the visible range has changed and so has the question. That dynamic behaviour is the indicator’s defining feature, and it is also the first thing that confuses new users, who expect a fixed drawing and instead watch the histogram redraw itself as they navigate.
Risk Disclosure
CFDs are complex instruments and come with a high risk of losing money rapidly due to leverage. You should consider whether you understand how CFDs work and whether you can afford to take the high risk of losing your money. Past performance is not indicative of future results. This content is provided for educational purposes only and does not constitute investment advice.
VPVR or VRVP: Which Name Is Correct?
Both, and they mean the same thing. Traders and educators commonly write VPVR for Volume Profile Visible Range, while TradingView’s own indicator is listed as Visible Range Volume Profile, which shortens to VRVP. If you search either abbreviation you will land on the same tool. Nothing technical separates the two labels; only habit does.
The Five Terms You Must Know
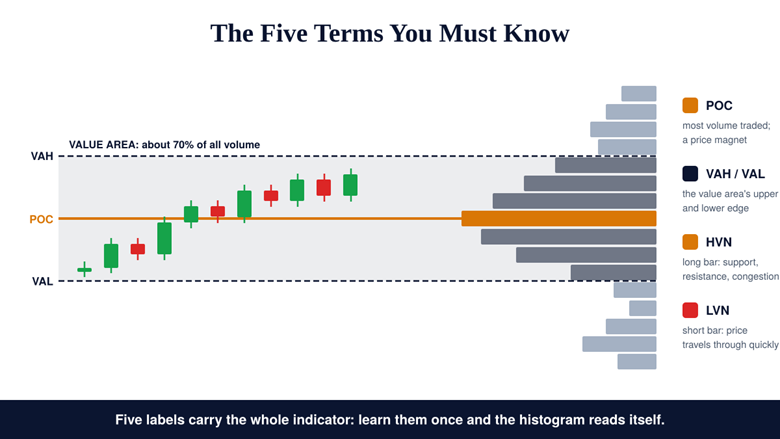
Almost everything written about volume profile rests on five labels, and once they are familiar the histogram becomes readable at a glance. The Point of Control, or POC, is the single price row with the most traded volume, the level the market spent most of its effort agreeing on. The value area is the band containing roughly 70% of all volume in the range, and its boundaries are the Value Area High and Value Area Low, written VAH and VAL. Within and outside that band, a High Volume Node is any thick bar and a Low Volume Node is any conspicuously thin one.
Five labels, one histogram: POC, the value area between VAH and VAL, and the thick and thin nodes on either side.
| Term | What it is | How traders use it |
|---|---|---|
| POC | The price row with the highest traded volume | A magnet and a mean-reversion target; often retested |
| Value area | The band holding roughly 70% of range volume | Defines fair value; edges frame acceptance and rejection |
| VAH and VAL | The upper and lower edge of the value area | Reaction levels for fade or breakout decisions |
| HVN | A thick bar: heavy volume at that price | Support, resistance, and likely congestion on return |
| LVN | A thin bar: little volume at that price | Expect fast travel rather than reaction; useful as a gap |
The whole indicator in five rows; every strategy below is built from these levels.
Developing POC and Developing Value Area
Some settings expose a developing POC and a developing value area, plotting how those levels moved as the range built rather than only where they finished. They answer one useful question: was fair value migrating through the session, or did it stall and drift back? A POC that climbs steadily tells a different story from one parked at the same price for three days.
How to Read the Profile
Reading a profile is mostly reading bar length. Long bars mean the market transacted heavily at that price, which implies genuine two-sided interest, and prices like that tend to slow arriving traffic: they behave as support from below, resistance from above, and congestion once price is inside them. Short bars mean almost nobody wanted to deal there, so when price re-enters that pocket it usually crosses quickly rather than reacting. The POC, being the thickest bar of all, earns its nickname as a magnet, and repeated retests of a POC are among the most common patterns on any profile chart.
Thick nodes slow price down and thin nodes let it run: the practical consequence of where volume sat.
Q: Does a high volume node guarantee that price will bounce?
A: No. It raises the odds of a reaction, which is not the same as a reversal. Price frequently pauses at an HVN, chops inside it, and then continues in the original direction. The node tells you where a decision is likely to be made, not which way the decision will go.
Adding and Configuring VPVR on TradingView
Adding the indicator takes under a minute, and the settings that matter are few. Work through the sequence once, then save it as your default so every new chart opens with the same profile you have learned to read.
Step 1: Open the Indicators Search
Click Indicators at the top of any chart and type volume profile visible range, or simply VPVR. The built-in tool appears in the technicals list alongside the other profile types.
Step 2: Add It to the Chart
Select it once. The histogram appears against one edge of the price pane, scaled to the candles currently visible.
Step 3: Open Settings and Set the Row Size
Right-click the profile and open its settings. Row size controls how finely the price range is sliced: coarser rows give a cleaner shape, finer rows reveal precise nodes but look noisier. Adjust until the structure you care about is visible without clutter.
Step 4: Confirm the Value Area Percentage
The value area defaults to about 70% of volume, the convention this article uses throughout. You can change it, but changing it also changes what VAH and VAL mean, so most traders leave it alone.
Step 5: Choose Placement and Developing Lines
Set whether the histogram draws on the left or right edge, and switch developing POC and developing value area on if you want the migration story rather than only the final levels. Then save the template as your default.
Did You Know?: An honest note before you plan around it: full volume profile tools on TradingView sit behind a paid plan. If you are on the free tier you will see the indicator listed but not be able to run it, so budget for the subscription or use a profile tool on your broker platform instead. |
VPVR vs VPFR vs Session Volume Profile
Three profile types answer three different questions, and choosing the wrong one is the most common reason a profile looks unhelpful. VPVR covers the visible range and recalculates as you scroll, so it answers what matters on this screen right now. Volume Profile Fixed Range, or VPFR, stays anchored between a start and end point you select, so it answers where volume sat inside one specific consolidation or one specific impulsive leg. Session volume profile builds a fresh profile for each trading day, so it answers how each session constructed its own value.
Same maths, three frames: the screen, an anchored leg, or one day at a time.
Mini Example: Choosing the Right Frame
A trader wants the levels that matter for today’s gold session. VPVR on a zoomed-in intraday chart gives a profile of the last few hours, which shifts every time the chart is scrolled, so it is useful for orientation but awkward for planning fixed levels.
Switching to VPFR and anchoring the range to yesterday’s four-hour consolidation produces a profile that will not move: a POC and a value area that can be marked, alerted on, and traded against for days. Same indicator family, very different usefulness, decided entirely by which frame matched the question.
Simple Strategies at the POC and Value Area
Two straightforward approaches cover most profile trading, and both hinge on the difference between acceptance and rejection. Rejection is price reaching VAH or VAL, failing to trade meaningfully beyond it, and turning back toward the POC, which suits a mean-reversion entry with the stop just past the edge and the POC as the target. Acceptance is price trading through the edge and holding there, building fresh volume outside the old value area, which suits a continuation entry instead. The distinction is not cosmetic: the same level produces opposite trades depending on whether business is being done beyond it, so the trigger must be written down before the level is reached, and a defined risk-to-reward ratio must be met before entry.
The second approach uses thin structure. An LVN between two thick nodes is a pocket price tends to cross rather than defend, making it a poor place to expect support and a reasonable path toward the next HVN as a target. The discipline in both cases is to mark the levels first, then write one trigger and one target per idea, validate it through out-of-sample backtesting rather than a folder of screenshots, and size it by fixed position sizing rather than conviction.
The Confluence Angle: Volume Meets Structure
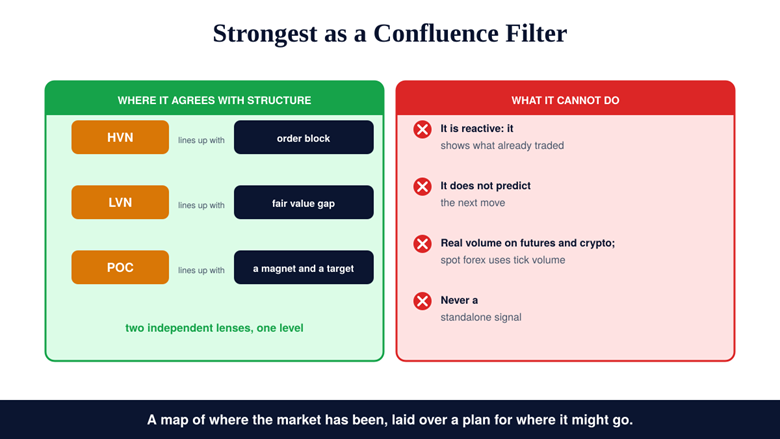
Volume profile is at its most convincing when it agrees with something you were already watching. Traders who work with Smart Money Concepts notice the overlap quickly: high volume nodes frequently sit where institutional order blocks were identified, because both describe prices where size was genuinely transacted, and low volume nodes frequently coincide with fair value gaps, because both describe prices the market crossed too fast to fill properly. Neither correspondence is a law, but when a profile node and a structural level land on the same price you have two independent lenses pointing at one number, which is a better reason to act than either lens alone. Volatility tools such as Keltner Bands can add a third, entirely different kind of confirmation.
Honest Limits and Script Caution
The most important limitation is structural: volume profile is reactive. It shows where trading has already happened, with precision and no opinion about the future, so it maps terrain rather than forecasting weather. Treating a POC as a prediction is a category error. The second limitation is the data. Profiles are most reliable on futures and major crypto, where a centralised tape counts every contract, whereas spot forex is a decentralised over-the-counter market, the structure the BIS triennial survey documents, so platforms substitute tick volume, a count of price changes rather than true size. Tick-volume profiles are usable in active sessions and progressively less meaningful as liquidity thins.
There is also a market in exaggeration. Prefer TradingView’s built-in profile or reputable open-source scripts whose code you can inspect, and be sceptical of invite-only volume indicators sold on promises of institutional footprints. European regulators found the large majority of retail accounts lose money on leveraged products, and investor-education guidance on leveraged strategies makes the plainer point that amplified exposure amplifies every misread level. No histogram changes that arithmetic.
Where Aron Groups Fits
A clean division of labour works best: chart the profile where the tooling is strongest and execute where your account lives. Mark POC, VAH, VAL, and your nearest nodes on TradingView, then trade those levels through the MetaTrader 5 platform at Aron Groups, using alerts and hard stops so the plan survives contact with the market. MT5 reports tick volume on forex symbols, the same proxy discussed above, which is a reason to let centralised-market profiles inform bias while execution stays mechanical.
If profiles are new to you, rehearse the whole routine on a demo account before any capital is involved, then move to a small account where micro volumes keep early lessons affordable. Judge the method the way a professional trader judges any method, by a smoother equity curve across many trades rather than one memorable reversal at a POC.
Conclusion
VPVR answers a question ordinary volume cannot: not when the market was busy, but where. Learn the five labels, set the row size so the shape is legible, and the histogram will show you the prices the market agreed on and the pockets it merely crossed. Choose the visible range for orientation, a fixed range for levels you intend to keep, and session profiles when the day is the unit that matters.
Then hold it to its proper role. It is a reactive map, weakened by tick-volume proxies and useless as a standalone signal, but genuinely valuable as a confluence filter over structure you already trust. Combine it with a systematic process, keep capital preservation ahead of any single level, and the profile stops being decoration and starts being information, the way a professional trader uses any tool.
Frequently Asked Questions
Quick answers to the questions traders ask most about the VPVR indicator and volume profile on TradingView.
What does the VPVR indicator show?
It shows how much volume traded at each price level across the candles currently visible on your chart, drawn as a horizontal histogram. Thick bars mark prices where heavy trading occurred and thin bars mark prices the market barely used.
What is the POC in volume profile?
The Point of Control is the single price row with the most traded volume in the range. Traders treat it as a magnet and a mean-reversion target, because price frequently returns to retest the level where the most business was done.
What is the difference between VPVR and VPFR?
VPVR profiles the visible range and recalculates whenever you scroll or zoom, while VPFR stays anchored between a start and end point you choose. Use VPVR for orientation on the current screen and VPFR when you need fixed levels from one specific move.
Is volume profile free on TradingView?
The full volume profile tools, including the visible-range version, require a paid TradingView plan. The free tier lists them but will not run them, so either subscribe or use a comparable profile or market-depth tool on your broker platform, and learn the underlying mechanics from a general trading guide first.