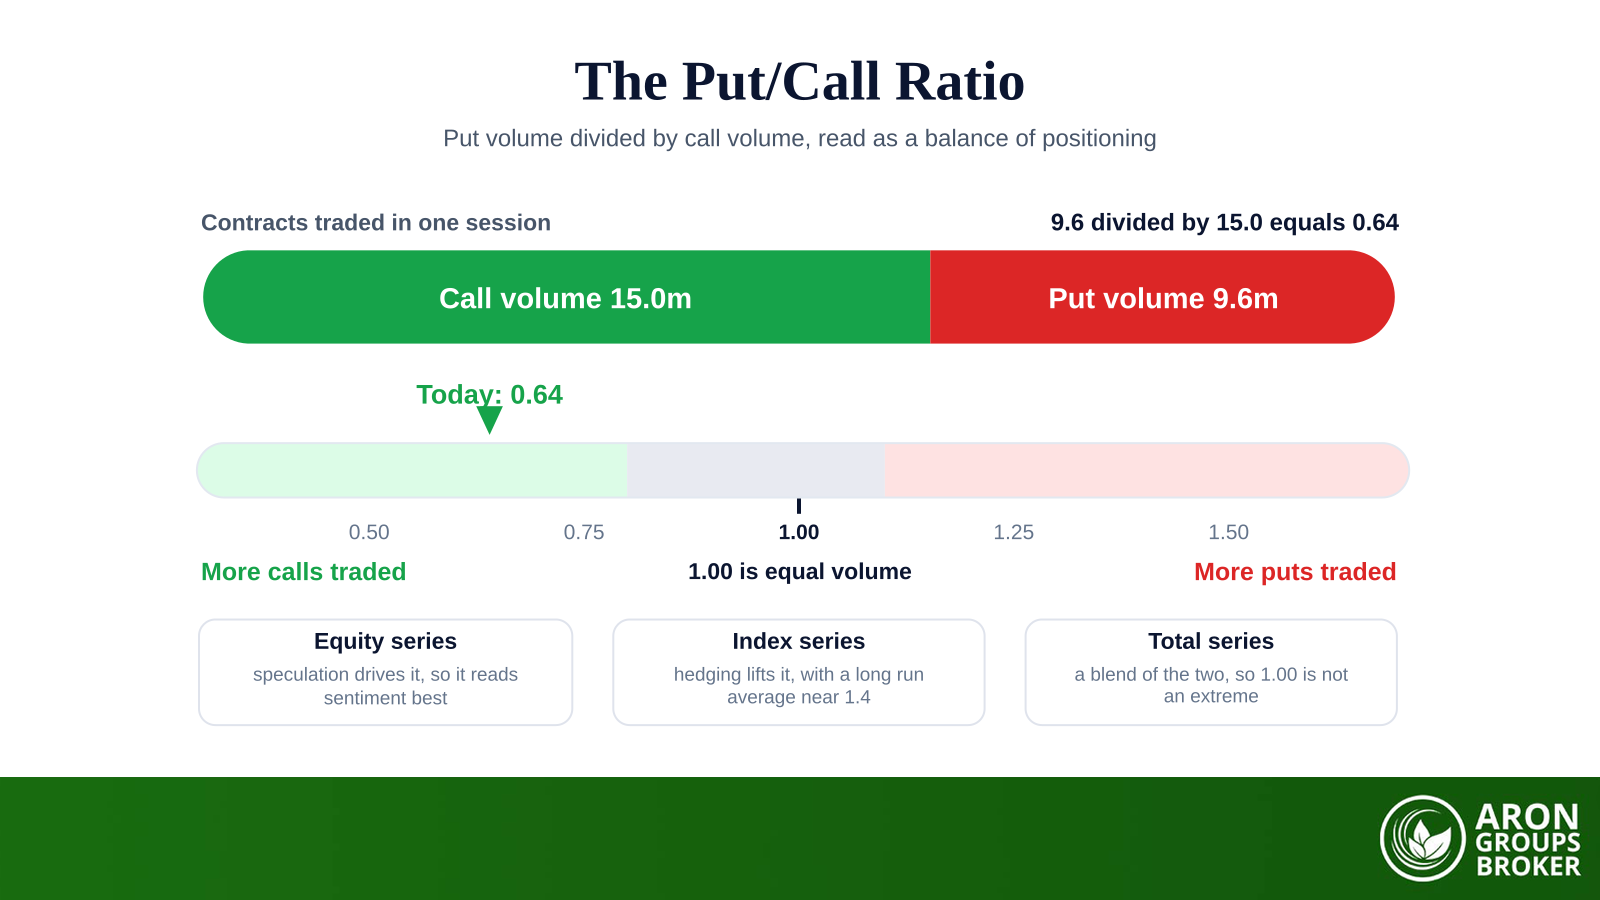

The put/call ratio divides the number of put contracts traded by the number of call contracts traded over the same period. A reading above one means puts traded more heavily than calls, and a reading below one means calls led. Traders use it as a gauge of options market sentiment, and they read it against the crowd rather than with it.
The arithmetic is trivial. Interpretation is where the errors live, because the same figure means different things across the published series. Treating one number as a market wide mood reading is the most common mistake. Sentiment data is context for a plan rather than a substitute for one, and the difference shows up first in position sizing.
This guide covers the formula, its two inputs, and what high and low readings actually mean. It explains why the equity, index and total series are not interchangeable. It also sets out the honest limits, because a gauge of crowded positioning is neither a timing signal nor a trading edge.
- The put/call ratio divides put volume by call volume, so above one simply means more puts traded than calls.
- The fear and greed readings are an interpretation of that arithmetic, used conventionally as a contrarian gauge.
- The equity series reads sentiment best; the index series sits structurally higher because funds buy puts as insurance.
- Roughly 0.7 is a widely repeated heuristic, not an official threshold, and it sits above the published equity average.
- Volume readings capture the day's mood, open interest readings show accumulated positioning, and smoothing cuts noise.
What the put/call ratio actually is
The put/call ratio is a single number that compares put activity with call activity over a defined period. Divide put contracts by call contracts and you have it. The period is usually one trading session, and the universe is usually one exchange group’s listed options. Everything after that division is interpretation.
Risk Disclosure
Trading forex and CFDs carries a high level of risk and can result in the loss of all your capital. This content is educational and is not investment advice. Never risk money you cannot afford to lose.
The two numbers it compares
The numerator counts puts and the denominator counts calls, both drawn from the same venue and the same window. A put carries the right to sell, so put buying is loosely associated with defensive intent, and a call carries the right to buy. Both associations are rough, because every contract has a buyer and a seller and the tape does not record which side initiated.
Where the published readings come from
Cboe publishes the most widely followed readings in its US options daily market statistics. The set includes a total put/call ratio, an index ratio and an equity ratio. It also carries an exchange traded products ratio, a VIX ratio and an SPX plus SPXW ratio. Historical series can be downloaded, which matters more than the daily headline figure, because no reading is extreme except against its own distribution.
How the ratio is calculated
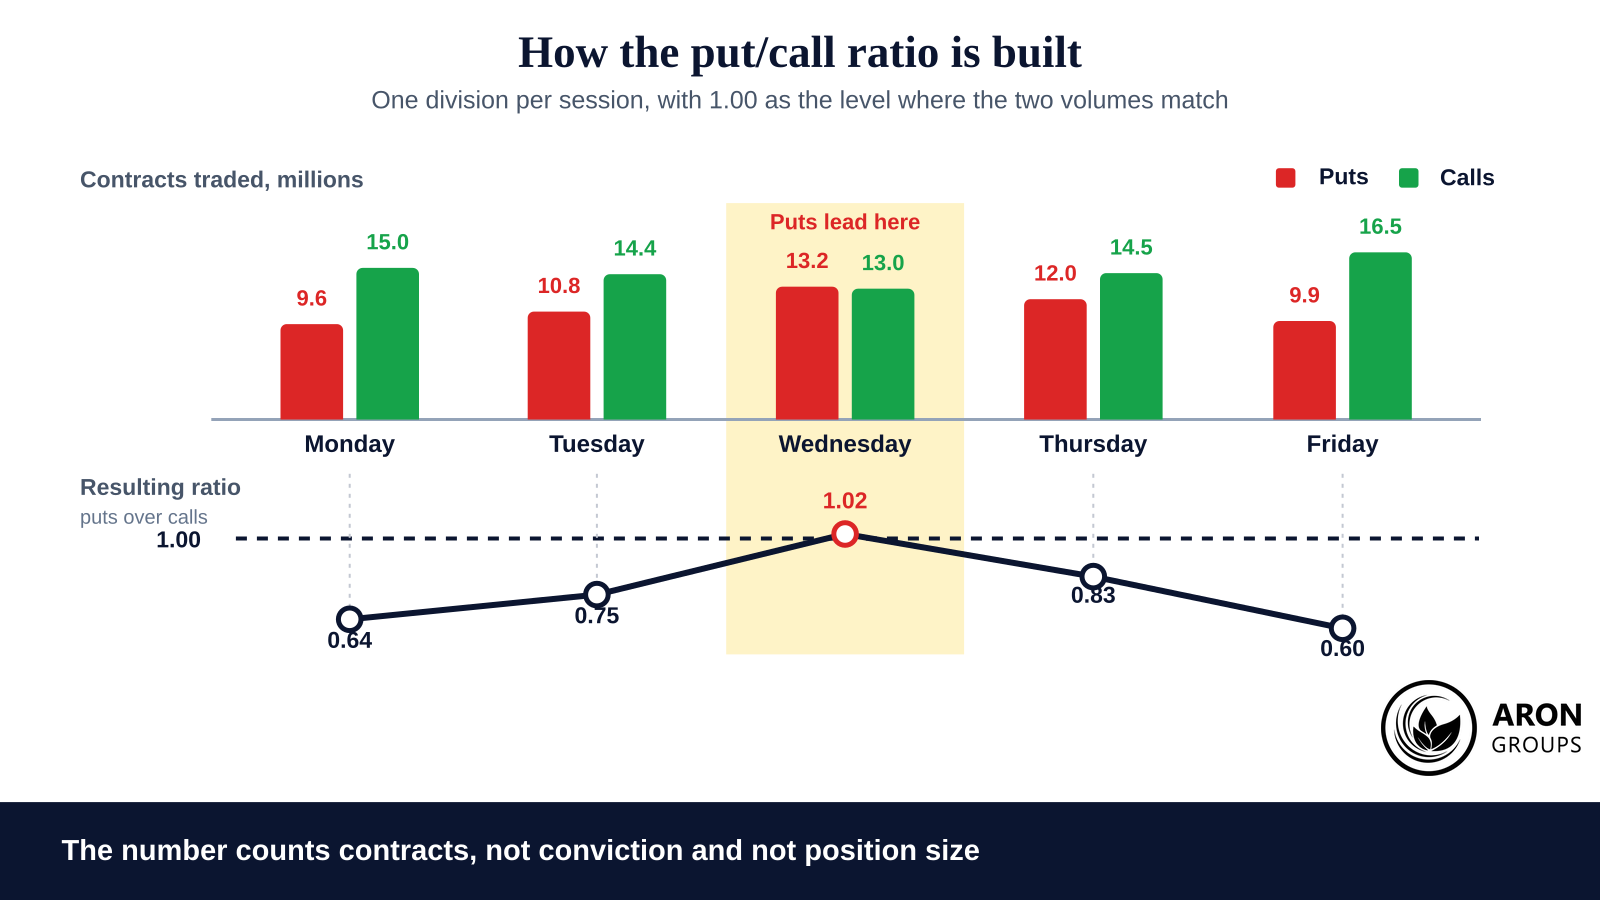
The calculation is one division, repeated on a fixed schedule. Take every put contract traded in the period, take every call contract traded in the same period, and divide the first by the second. The result carries no units, which is exactly what lets you compare one session with another.
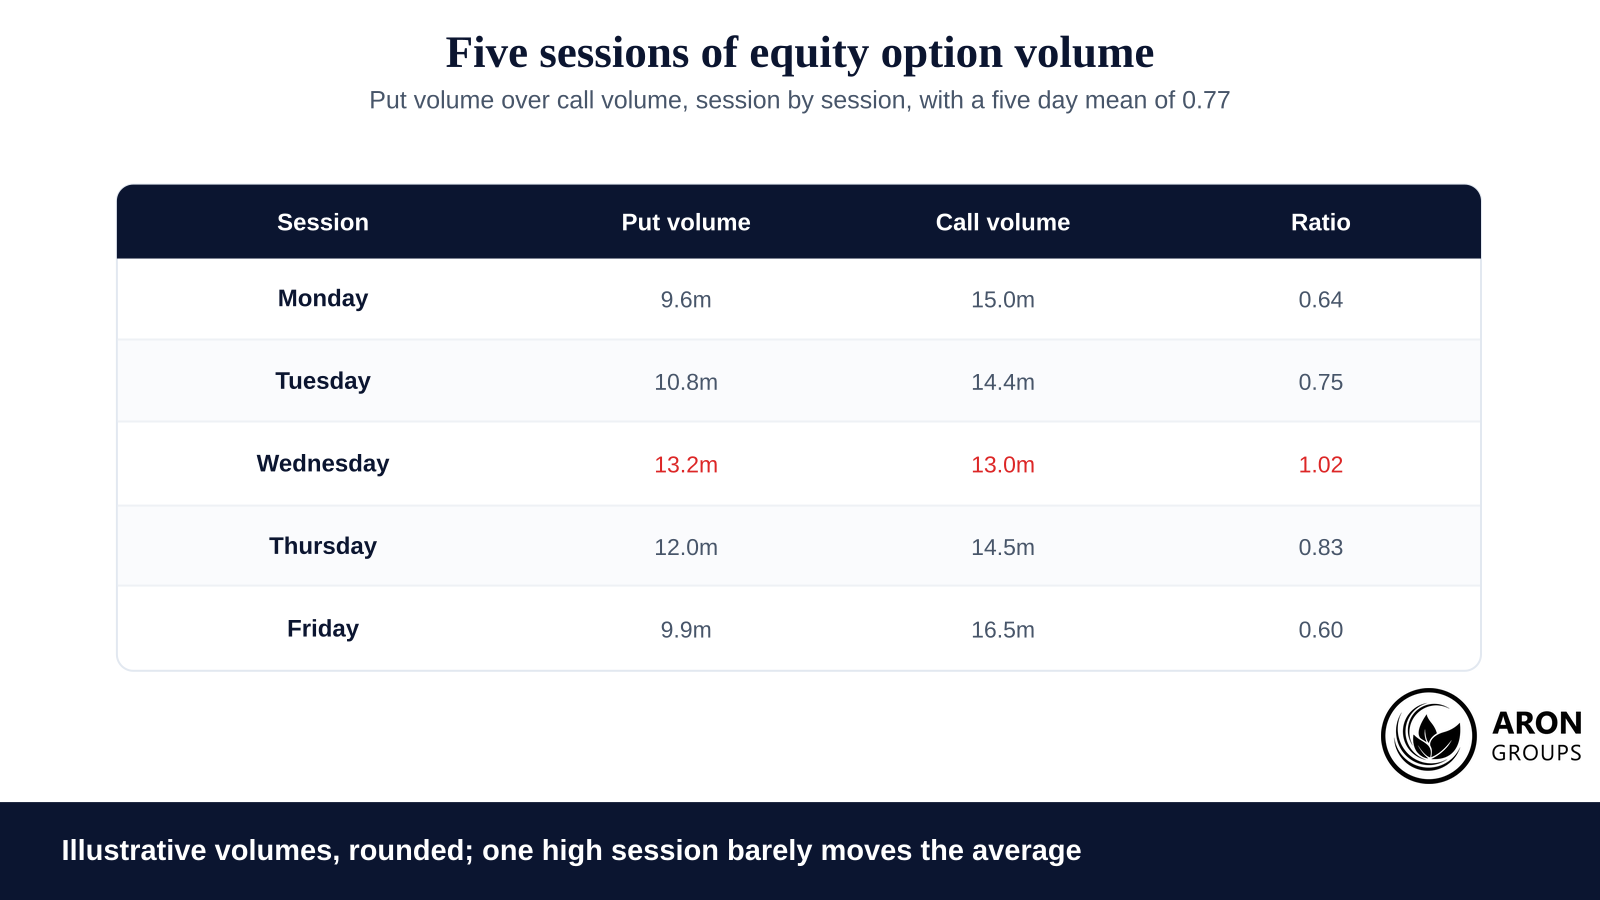
A worked figure makes the scale obvious. If 9.6 million puts trade against 15.0 million calls, the ratio is 0.64. Running the same division on open interest rather than on volume produces a different indicator with the same name. That is the first place readers get confused.
Key Point
The ratio carries no information about the size of the positions behind the contracts or which side initiated them. It counts contracts, and a put bought to hedge a portfolio looks identical to a put bought to speculate.
What a high or low reading actually means
A reading above one means put volume exceeded call volume in the period. That is the entire factual content of the number. Calling it fear is an interpretation, and it is the interpretation the market has settled on, conventionally read against the crowd rather than with it.
The contrarian logic is straightforward. When put buying dominates, much of the defensive positioning has already been established, so the marginal buyer of protection is harder to find. When call buying dominates, the same argument runs in reverse, and the marginal buyer of upside becomes the scarce one.
The 0.7 heuristic, and what it is not
A level of roughly 0.7 is quoted constantly as the typical reading for the equity series. It is a widely repeated rule of thumb rather than a published benchmark, and no exchange issues it as an official threshold. It also sits somewhat high against the actual series, whose long run average has run in the low to mid 0.6s. Treat it as folklore with a grain of truth, not as a line in the data.
Why fixed thresholds age badly
The equity baseline has drifted with market structure. The growth of very short dated options and of retail call buying changed the mix of what trades, and the series moved with it. Regulators have studied the hazards of rapid short term trading for decades, and the shortest dated contracts concentrate exactly that activity.
Practitioners therefore compare today’s figure with a moving average of the same series, or with its own distribution over the past year. A fixed line drawn a decade ago describes a market that no longer exists.
Equity, index and total: the distinction that decides the reading
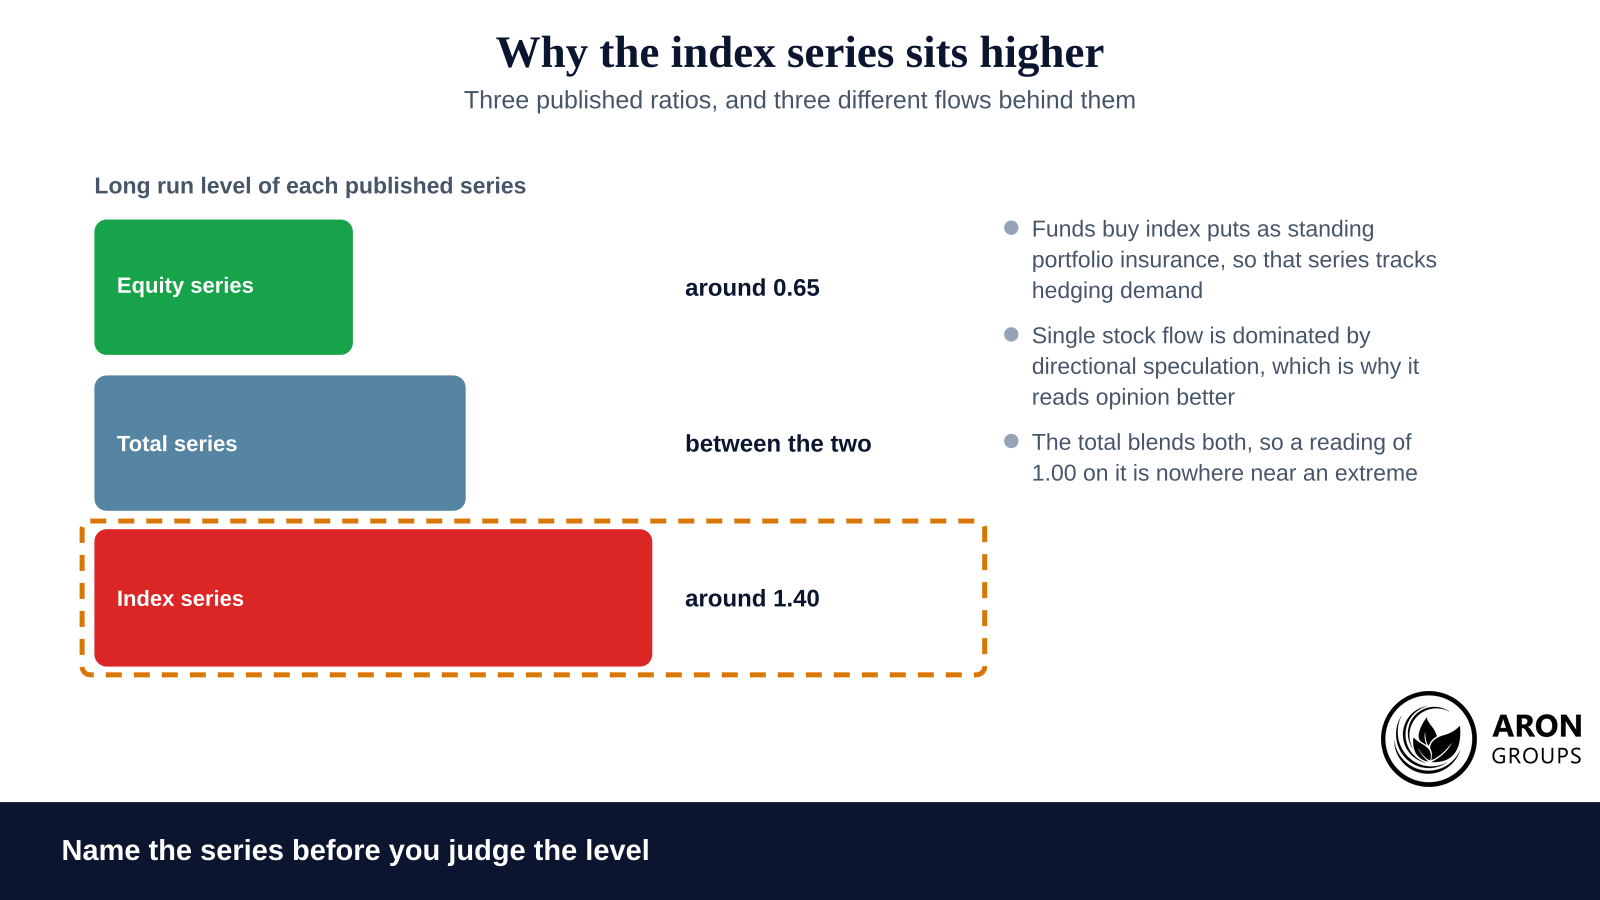
The three published series are not interchangeable, and the index series is the one that misleads people. It runs structurally higher than the equity series, with a long run average well above one, in the region of 1.4. That is not permanent pessimism. It is portfolio insurance.
Institutions buy index puts continuously as protection for portfolios they intend to keep. The purchase expresses a risk limit rather than a view on direction. So the index ratio measures the demand for insurance, and it reads sentiment only indirectly.
The equity series is the better sentiment gauge for precisely that reason. Single stock options are dominated by directional speculation, so the balance between puts and calls reflects opinion rather than a mandated hedge. The total series blends both, which has a consequence traders routinely miss. A total reading of 1.0 is not an extreme, because the index component drags the blend upwards.
| Series | What dominates the flow | Long run level | Sentiment value |
|---|---|---|---|
| Equity | Directional speculation in single stock options | Average in the low to mid 0.6s | Highest, because opinion drives it |
| Index | Portfolio hedging in index products | Average well above 1 | Lowest, because insurance drives it |
| Total | A blend of both flows | Between the equity and index levels | Mixed, and 1.0 is not an extreme |
The same number carries a different meaning in each row, which is why the series has to be named before the level is judged.
Practical filter
Read the series name before you read the figure. A reading of 1.1 on the equity series and a reading of 1.1 on the index series describe completely different markets.
Volume, open interest and smoothing
Two inputs produce two different indicators. A volume based ratio counts contracts traded during the period, so it reacts immediately and captures the day’s mood. An open interest based ratio counts contracts still outstanding, so it moves slowly and describes accumulated positioning.
Choose by timeframe rather than by preference. An intraday or multi day horizon wants the reactive series, and a quarterly assessment of positioning wants the standing one. Neither is more correct, because they answer different questions.
Smoothing is the standard treatment for the volume series. A five day or ten day moving average removes most of the noise created by one heavy expiry or one large hedging day. Anyone folding the smoothed series into a systematic process should test the window out of sample rather than pick it by eye.
Q: Which series and input should I watch if I only follow one?
A: The smoothed equity volume ratio is the usual answer, because it isolates speculative flow and filters single session noise. Compare it with its own range over the past year rather than with a fixed level. Add the open interest series only if your horizon is long enough for slow shifts in positioning to matter.
The put/call ratio against the VIX and the wider toolkit
The put/call ratio and the VIX measure different things. The ratio measures positioning, the balance of contracts traded between puts and calls. The VIX measures the price of implied volatility on S&P 500 options, which is what protection costs rather than how much of it changed hands.
The two often move together, and the exceptions are the interesting part. Heavy put volume with flat implied volatility suggests mechanical hedging. Rising implied volatility on an unremarkable ratio suggests repricing without a change in positioning. Traders who work from volatility bands are reading the same underlying quantity through a different lens.
Spot foreign exchange generates no options tape of its own, because it trades over the counter through dealers working to their own regulatory rulebooks. Forex and CFD traders therefore borrow equity and index readings, which is legitimate as long as the borrowing is acknowledged. A sentiment extreme in US equity options is a statement about that market first.
The crypto put/call ratio
Crypto options venues publish the same ratio for Bitcoin and Ether, and the Deribit readings are the ones most often quoted. Traders watch them alongside open interest and max pain into large quarterly expiries, because positioning concentrates there. The same caution applies with more force, since the crypto series is younger, thinner and more easily distorted by one large hedging trade.
Mini Example: reading a crowded put position into a quarterly expiry
A quarterly expiry approaches and the crypto put/call ratio has climbed for a fortnight, with open interest building at strikes below the market. The reading says protection has been bought in size. It does not say the market will fall, and it does not say it will hold.
The practical use is in sizing and in expectation. A spot or CFD trader already long treats the reading as a reason to check exposure, not as a reason to reverse. If the crowd is hedged, the marginal buyer of protection is scarcer, and a relief move becomes more plausible than the raw level suggests.
The honest limits of the put/call ratio
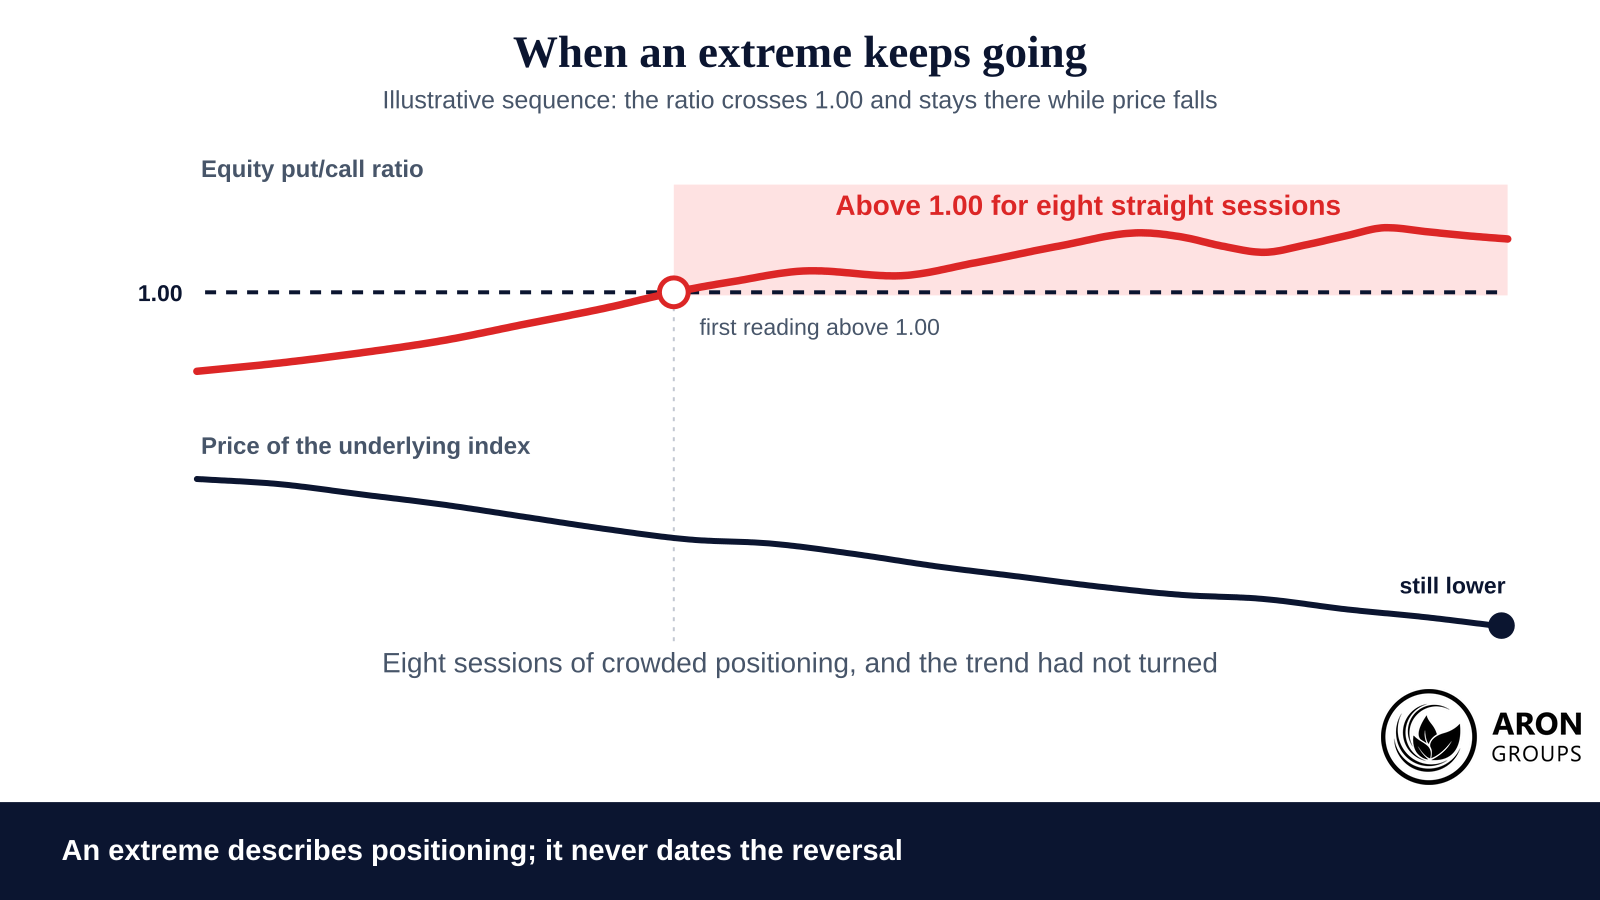
The put/call ratio is a contrarian context gauge, not a timing signal, and the distinction is not pedantic. An extreme tells you the crowd is leaning hard one way. It does not tell you the lean is about to end, and crowded positioning can become more crowded for weeks.
Four specific weaknesses deserve stating plainly, because each one changes how much weight the reading can carry.
· Extremes persist. A reading at the top of its own range can stay there for weeks while price continues.
· Thresholds drift. Any fixed level you adopt describes today’s market structure, and that structure keeps changing.
· Index readings are distorted by hedging, so the series quoted most often in headlines is the least suited to sentiment.
· Every contract has two sides, so the ratio cannot separate an opening speculative buy from a closing trade or a hedge.
There is also a population problem. Options markets are a small and relatively sophisticated slice of participation, and those accounts are not the accounts moving spot currencies. Regulators have documented how consistently retail accounts lose money on leveraged products, and a sentiment reading offers no protection against that.
Risk Warning
A sentiment extreme is not a stop loss. If the only reason for a position is a crowded ratio, the position has no defined invalidation, and that is a sizing problem before it is an analytical one.

Where Aron Groups fits
Aron Groups offers spot and CFD instruments rather than options, so the put/call ratio belongs here as context rather than as something you trade. What it buys you is a read on positioning in the related equity, index or crypto market before you commit to a direction. Execution runs on MetaTrader 5, where orders fill at the next available price with no requotes and spreads float with the market.
If you want to test whether a sentiment overlay improves anything, do it at a size where being wrong costs nothing you will remember. The Nano account is commission free, with the cost carried in the spread, and it supports micro volumes from 0.0001 lots. Size every position from a defined risk plan rather than from confidence in a reading, and keep capital preservation ahead of conviction.
Conclusion
The put/call ratio is a division, and the division is the easy part. Put volume over call volume gives a number with no units and no opinion attached. Everything that makes it useful, and everything that makes it dangerous, comes from the series, the input and the range you compared it against.
Read as context it is genuinely valuable, because crowded positioning changes the balance of who is left to act. Read as a trigger it will disappoint, since extremes persist and the thresholds keep moving. Build it into a process with real risk management, and hold the interpretation loosely enough to change your mind when the series does.
Frequently asked questions
Four questions come up repeatedly once traders start watching the published series.
What is a good put/call ratio?
There is no universally good level, and the question usually means what counts as extreme. Judge a reading against the recent range of the same series rather than a fixed number. On the equity series, sustained readings near the top of the past year’s range are the ones worth noting.
Does a put/call ratio above 1 always mean fear?
No. Above one means put volume exceeded call volume, and nothing more. On the index series that happens in ordinary conditions because of hedging. A reading near one on the total series is unremarkable for the same reason.
Should I use volume or open interest?
Use volume for short horizons and open interest for slower assessments of accumulated positioning. Most traders start with a smoothed volume series, because it updates daily and is published without charge. Running both is useful mainly on the days when they disagree.
Can I trade the put/call ratio at Aron Groups?
Not directly, because the platform offers spot and CFD instruments rather than options. The ratio is used here as sentiment context for a directional position. Any rule built on it should be stress tested before it carries meaningful size.