
icon icon Home
icon icon Accounts
icon icon Quick start
icon icon Symbols

The Schaff Trend Cycle (STC): A Faster MACD, Its Settings, Signals, and Limits

Author
Abe Cofnas
Abe Cofnas
calendar Last update: 18 September 2026
watch Reading time: 8 min

The Schaff Trend Cycle (STC) is a momentum oscillator developed by currency trader Doug Schaff that combines the MACD with a stochastic calculation. It oscillates between 0 and 100 and is designed to identify trend direction and turning points faster than the MACD alone. In practice it behaves like a quicker, cycle-aware upgrade of a classic tool.

Speed is the whole argument. The MACD is trusted but late, while the stochastic is early but noisy, and most traders end up choosing one weakness or the other. Schaff’s design refuses that choice, which is why the indicator keeps appearing on systematic trading watchlists.

This guide explains how the STC indicator is calculated, how to read the 25 and 75 signals, and which settings suit which timeframe. It compares the tool with the MACD directly, then closes with the honest limits that its fans rarely mention.

bookmark
Key Takeaways
  • The STC is a double-smoothed stochastic applied to the MACD, bounded between 0 and 100.
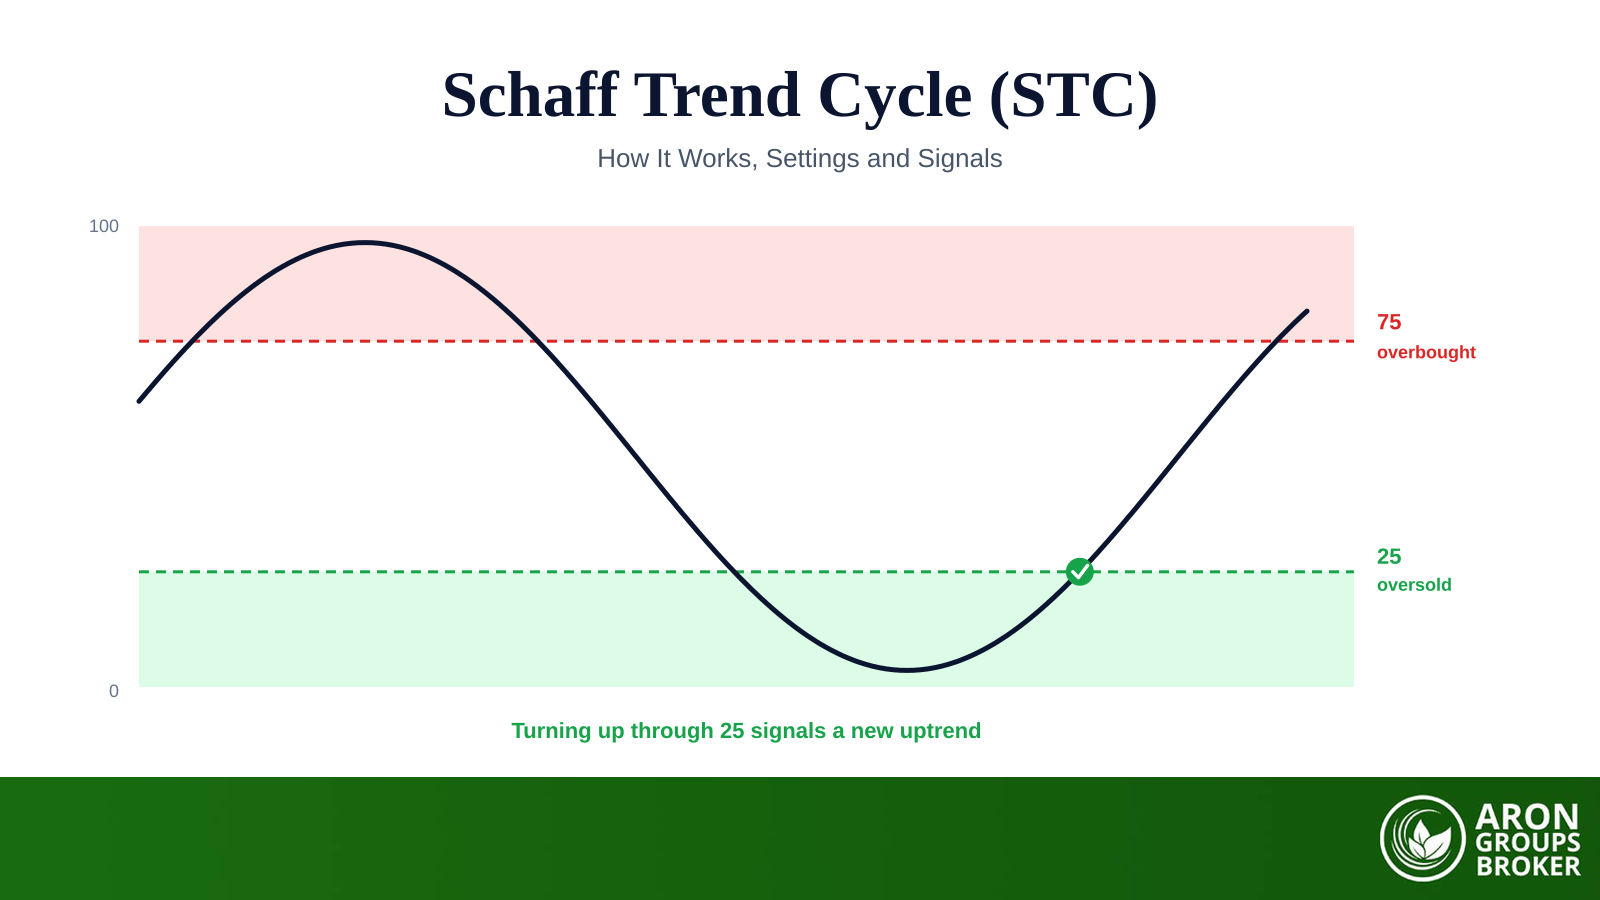
  • Readings above 75 are overbought and readings below 25 are oversold.
  • The classic signals are a rise back above 25 and a fall back below 75.
  • Default settings, especially in forex, are EMAs of 23 and 50 with a cycle length of 10.
  • Extra speed brings extra whipsaws, so confirmation and risk control stay mandatory.

What Is the Schaff Trend Cycle?

The Schaff Trend Cycle is a momentum oscillator that reads cycles inside the MACD rather than on raw price. Its line swings between 0 and 100, with 75 and 25 marking the overbought and oversold extremes. The design goal is early awareness of a turn, before the trend change is obvious on the chart.

sms-star

Risk Disclosure
Trading forex and CFDs carries a high level of risk and can result in the loss of all your capital. This content is educational and is not investment advice. Never risk money you cannot afford to lose.
Who Built It, and Why

Doug Schaff developed the indicator in the 1990s out of a currency trader’s frustration. The MACD confirmed trends reliably but surrendered too much ground before signalling, while faster oscillators fired constantly in both directions. His answer kept the MACD’s engine and wrapped a cycle detector around it.

The premise is that currency trends tend to accelerate and exhaust in repeating cycles. An indicator that measures where the MACD sits inside its own recent cycle can flag exhaustion earlier than the MACD’s signal line manages. That one design decision explains almost everything about how the STC behaves.

A Leading Lens on a Lagging Engine

Purists note that nothing built from moving averages is truly leading, and they are right. The honest description is a lagging engine read through a leading lens: the MACD supplies direction late, and the cycle wrapper reports its exhaustion early. Traders get earlier awareness, not a view of the future.

How the STC Indicator Is Calculated

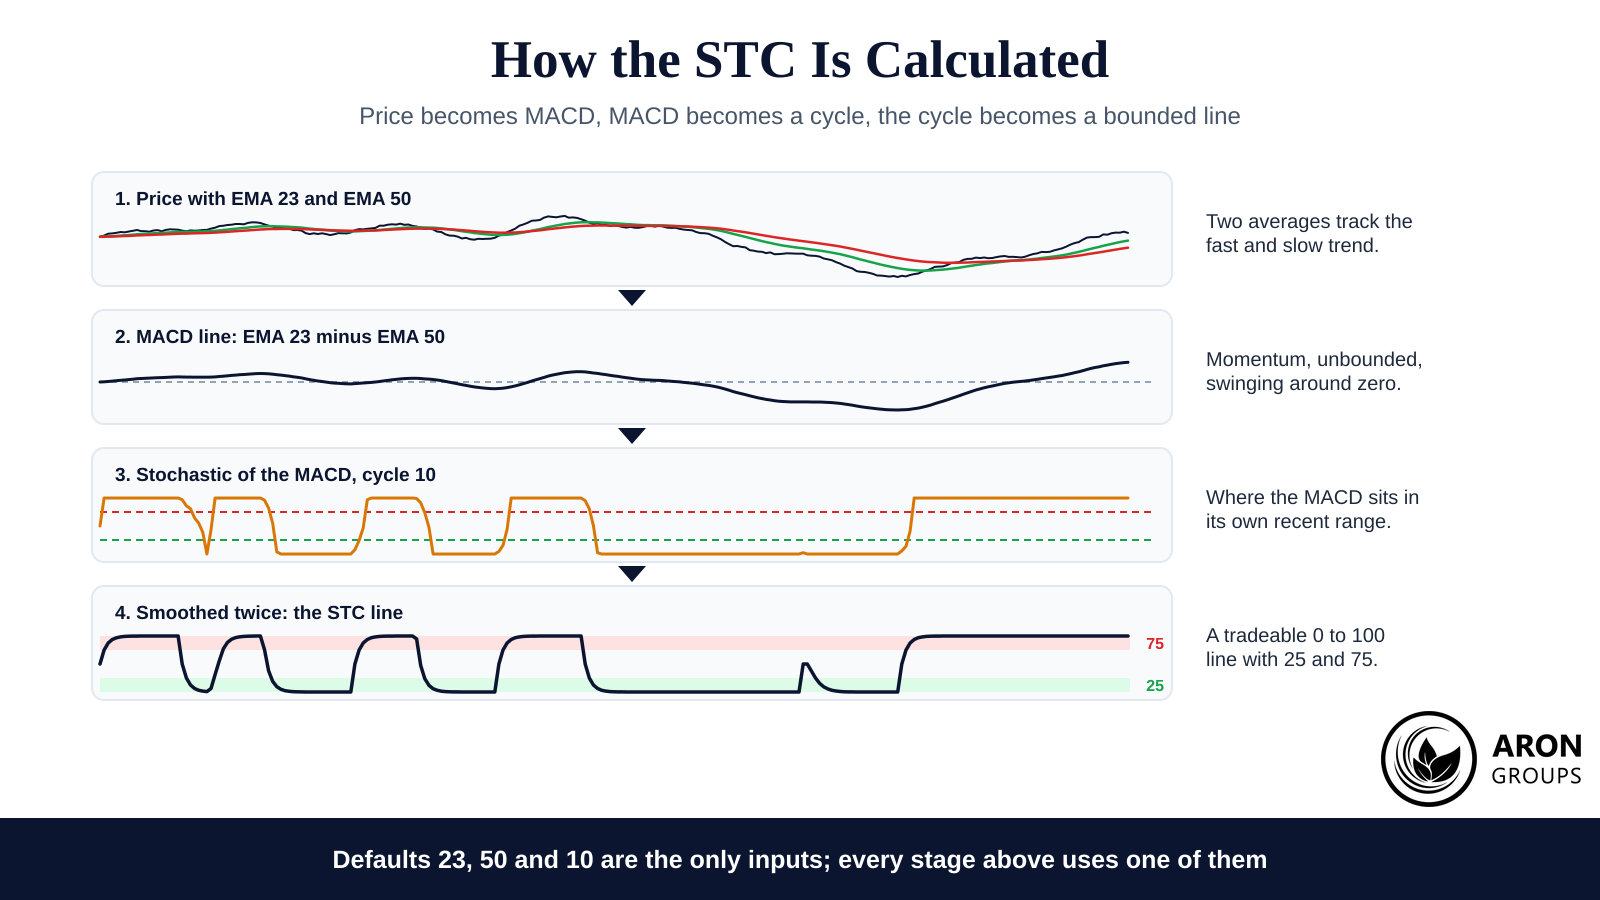
The STC is calculated as a double-smoothed stochastic of the MACD. The platform first builds a standard MACD line from two exponential moving averages, then measures where that line sits inside its recent range, twice, with smoothing applied at each pass.

Each panel is the previous one transformed: two averages, their difference, its position inside a cycle, then the smoothed bounded line.

The double pass is the clever part. The first stochastic converts momentum into a cycle position, and the second pass smooths that reading into a stable, tradeable line. The result keeps the MACD’s directional information but reaches its extremes far sooner.

Bounded output is the practical gift. Because the line cannot leave the 0 to 100 range, overbought and oversold always mean the same thing on every chart, which makes rules easy to write and easy to run through backtesting.

The three numbers in the settings box map straight onto the stages. The 23 and 50 feed the two EMAs behind the MACD line, and the 10 sets the lookback the stochastic passes use to define each cycle. Nothing else is hidden, which is rare praise for a compound indicator.

Reading the STC Signals

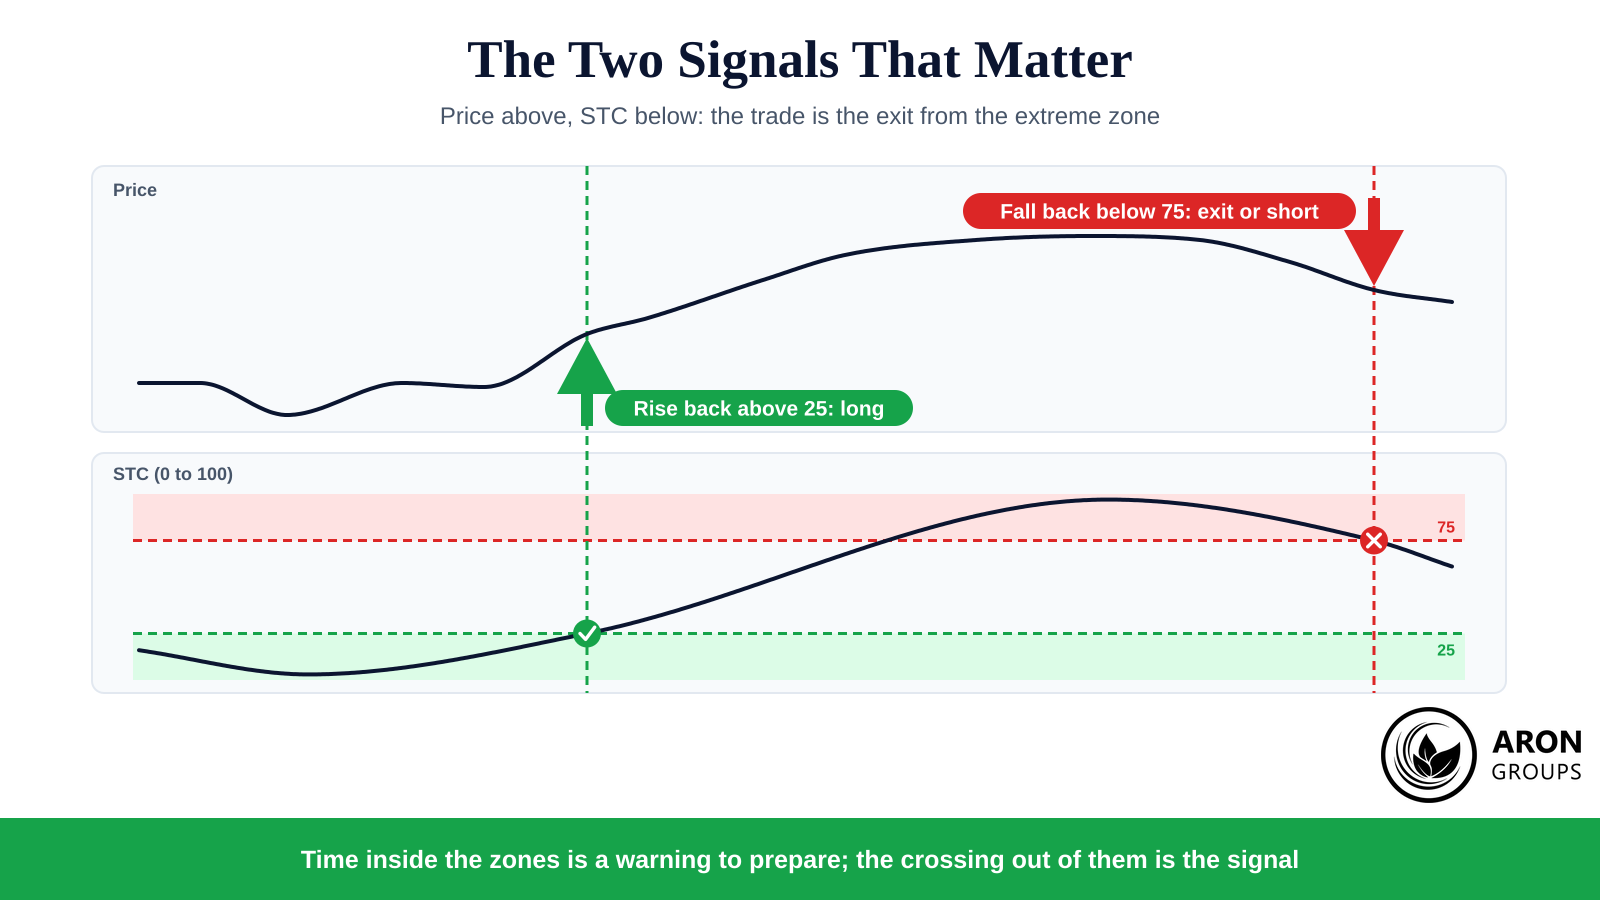
The trigger is the exit from an extreme zone, not the arrival in it. A rise back above 25 suggests a new uptrend is beginning, and a fall back below 75 suggests a new downtrend. Time spent inside the zones simply marks stretched momentum.

Both signals fire at the boundary crossing, and the price panel shows why: the crosses line up with the turn, not with the extreme.

Traders add two refinements. Divergence between the STC and price warns that the current move is thinning out, and many wait for the line’s slope to flatten before trusting a cross. Both filters trade a little speed for fewer false starts.

Alerts do the watching better than eyes do. Most platforms can notify you when the line crosses 25 or 75, which removes the temptation to reinterpret the chart every few minutes. The signal set is small and mechanical, so let the software carry it.

Q: Should I sell simply because the STC reads above 75?
A: No. Strong trends can pin the line near 100 for long stretches while price keeps running. Wait for the fall back below 75, and check market structure before acting on it.

The Best STC Settings

The standard settings, and the ones most forex charts ship with, are a 23-period fast EMA, a 50-period slow EMA and a cycle length of 10. Those defaults were tuned with daily charts in mind, and they remain the sensible starting point on 4-hour charts as well.

Settings profileBehaviourBest suited to
Default 23, 50, 10Balanced speed and noiseDaily and 4-hour trend trading
Shorter inputsEarlier signals, more whipsawsExperienced intraday traders with strict stops
Longer inputsFewer, later, cleaner signalsSwing traders confirming larger trends

Settings move the trade-off rather than removing it: every extra unit of speed is paid for in false signals.

Timeframe should drive any departure from the defaults. Intraday traders sometimes shorten the inputs to catch quicker rotations, accepting the extra noise that follows, while weekly chart users lengthen them to mute it. The instrument matters too, because a calm major and a fast crypto pair cycle at very different speeds.

Whatever you change, validate it. A combination that dazzles on three months of EURUSD can collapse on the next three, so run any variation through an out-of-sample test or a Monte Carlo simulation before risking money on it. Settings are a hypothesis, not a preference.

sms-star

Trading Tip
Change one input at a time and log the effect on signal count and average result. Ten minutes of notes beats a month of vague impressions.
The Cycle Idea Behind the Indicator

The STC treats trends as cyclical events rather than lines that simply continue. Markets accumulate, advance, distribute and decline, and the indicator tries to flag the point where one phase is exhausting into the next. That framing echoes the market cycle Richard Wyckoff described a century ago, though it remains a viewpoint rather than settled fact.

This is why the tool aims to signal before a reversal rather than after it. A cycle lens assumes every advance carries the seed of its own fade, so stretched momentum is treated as information instead of noise. Traders who reject the cycle premise should temper their expectations of the indicator built upon it.

The framing also sets the right expectations for trending regimes. When a market refuses to cycle and simply runs, the STC will call the top early and repeatedly, and each call will look wrong for a while. That is not a malfunction; it is the cost of the lens, and trend filters exist to pay it down.

STC vs MACD

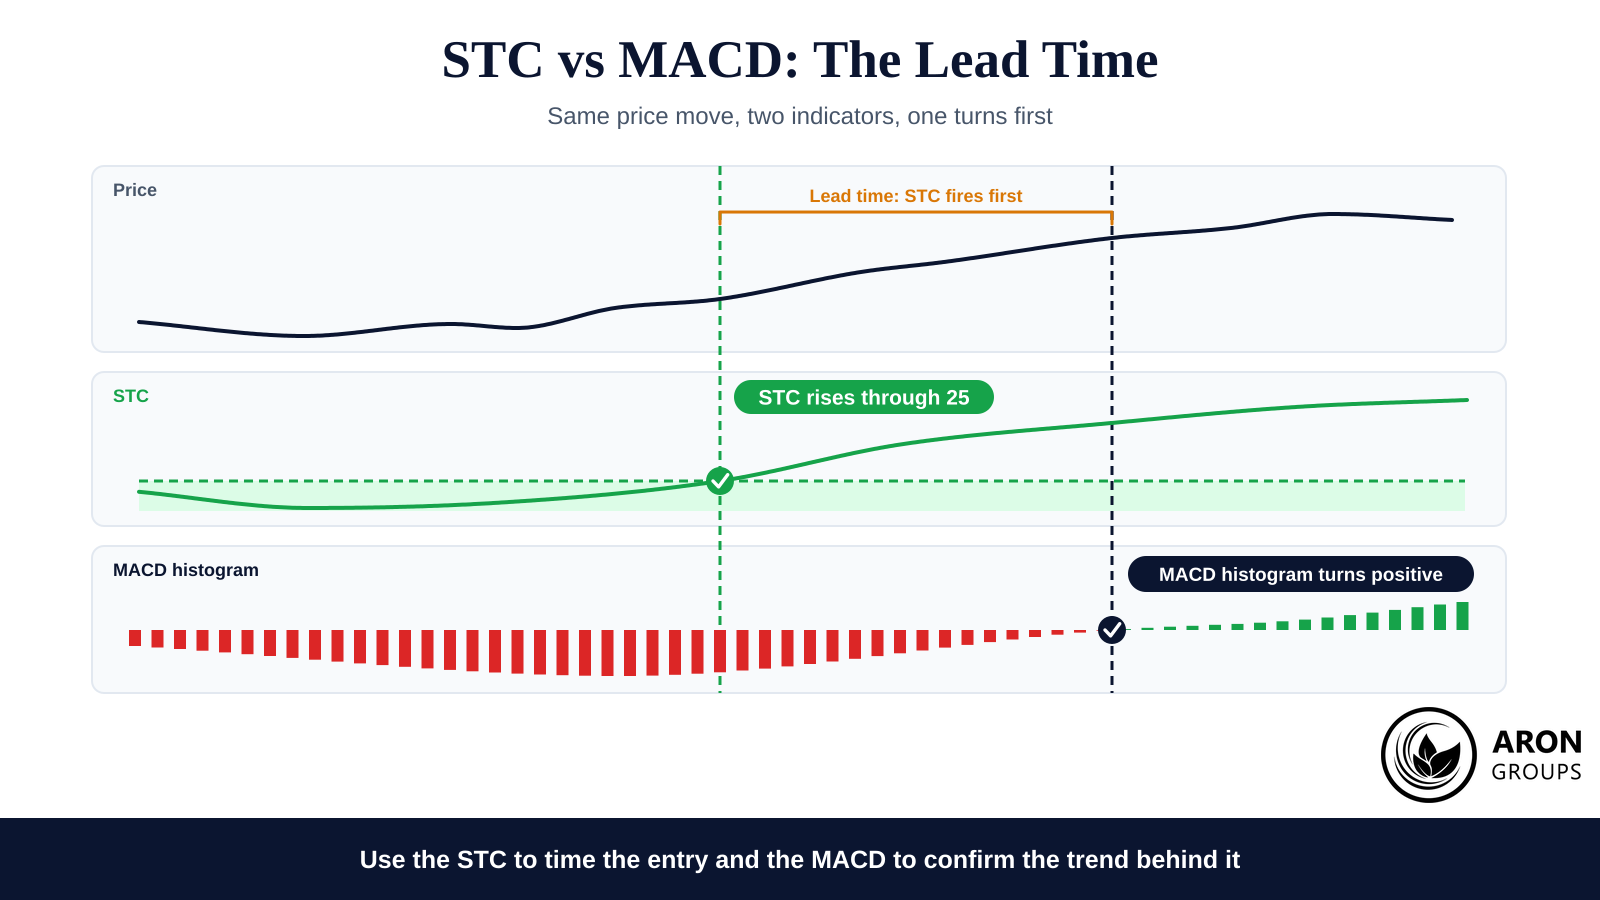
The practical difference is a division of labour. The STC gives earlier reversal signals and reacts quickly when momentum fades, while the MACD, with its zero line and histogram, is the stronger tool for confirming an established trend.

The same price move read twice: the STC turns first, the MACD histogram confirms later, and the gap between them is the lead time.

Running both resolves most arguments. A long entry backed by an STC rise through 25 and a MACD histogram turning positive carries more evidence than either signal alone. When the two conflict, the disagreement itself says something about how young or tired the move is.

Mini Example: One Chart, Two Opinions

On a 4-hour EURUSD chart, the STC rises through 25 while the MACD histogram is still negative. A patient trader treats that as an early warning rather than a completed signal, takes a half-size long above the last swing low, and plans the addition in advance.

When the histogram later turns positive, the second half goes on. The STC provided the timing, the MACD provided the permission, and the staged sizing carried the uncertainty in between.

The Honest Limits

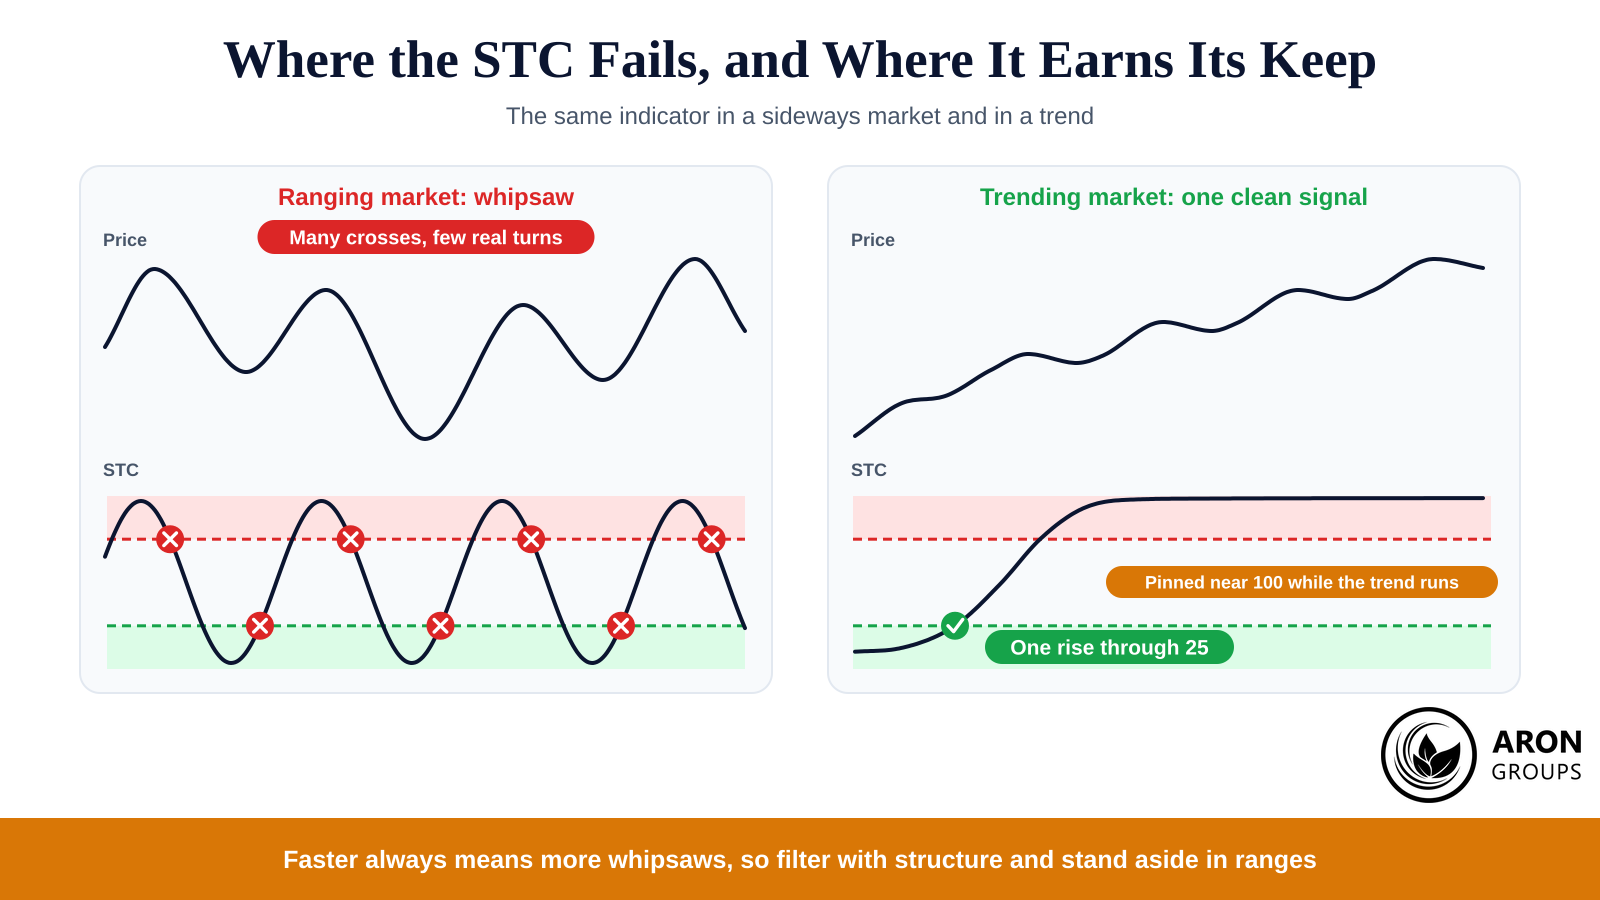
The STC is still an oscillator, and ranging markets remain its natural enemy. In choppy conditions the line sprints between extremes and fires false signals, and being faster by design means whipsawing more, not less. Anyone promising otherwise is selling something.

The failure mode is predictable: in a range the line crosses constantly, in a trend it crosses once and then pins near the top.

Regulators publish blunt reminders of how leveraged CFD trading ends for most retail accounts, and the SEC’s study of day traders reached similar conclusions decades ago. A faster indicator shortens reaction time; it does not change those base rates.

The defence is procedural. Confirm each signal against RSI, structure or a Keltner channel, keep position sizing fixed so a run of whipsaws stays survivable, and accept that standing aside is a position too.

Optimisation is the quieter danger. Because the STC responds strongly to its inputs, it is easy to curve-fit a settings trio that memorised the past instead of learning it. Treat suspiciously perfect backtests as evidence of overfitting first and brilliance second.

Getting the STC on Your Platform

The indicator is not built into every platform. TradingView hosts well-used open-source versions, and community builds exist for MetaTrader, where custom indicators install alongside any expert advisor. Availability is rarely the problem; provenance is.

Indicator files are executable code, so treat downloads with the caution you would give any software. Prefer your platform’s official marketplace or a reputable open-source listing, and avoid random archives promising a free STC with bonus features. The bonus features are rarely the kind you want.

Installation itself is routine. On MetaTrader the file goes into the indicators folder and appears after a refresh, while TradingView versions attach from the public script library in one click. If a build behaves oddly, delete it and start again from a trusted source rather than debugging a stranger’s code.

sms-star

Key Point
Before trading an unfamiliar STC build, compare its line against a known-good version on the same chart. Two minutes of comparison catches most broken or repainting implementations.


Where Aron Groups Fits

Aron Groups clients can run the Schaff Trend Cycle on MetaTrader 5, where it drops onto any chart beside the platform’s standard oscillators. The MetaTrader 5 toolbox tutorial shows how to keep custom indicators organised without cluttering the workspace.

New users can trial STC rules on a Nano account, where micro sizing keeps the cost of a whipsaw educational rather than painful. Pairing that experiment with a written trading edge definition turns indicator testing into a real strategy process.

Conclusion

The Schaff Trend Cycle earns its reputation as a faster MACD. It converts momentum into a bounded cycle reading, signals at the 25 and 75 boundaries, and hands disciplined traders earlier entries than the tool it was built from. For a design from the 1990s, it has aged with unusual grace.

Speed, though, is a loan the market always collects on. The indicator whipsaws in ranges, demands validation of its settings and punishes anyone trading it alone. Used with confirmation, sensible sizing and the humility to stand aside, it is a valuable lens on trend behaviour, and the equity curve of a patient user will show it.

Frequently Asked Questions

Four quick answers for traders meeting the Schaff Trend Cycle for the first time.

Is the STC indicator better than the MACD?

It is faster, not better. The STC signals turns earlier, while the MACD confirms trends more reliably. They answer different questions, which is why experienced traders often run the pair together on one chart and let each veto the other.

What are the best STC settings for forex?

Start with the defaults: EMAs of 23 and 50 with a cycle length of 10. Shorten the inputs only if your timeframe truly demands it, and test any change out of sample before trading it with money.

Can I use the Schaff Trend Cycle on its own?

You can, but you should not. The indicator produces false signals in ranging markets, so pair it with RSI, market structure or a trend filter, and always define the risk before entry. One added filter removes a surprising share of the bad trades.

Does the STC work on crypto and gold?

Yes. The calculation is market-neutral and it is popular on both. Faster markets simply reach the extremes more often, so expect more signals, apply stricter confirmation, and consider longer inputs where the noise becomes unmanageable.

Continue Reading
not-found
calendar 18 September 2026
Rate this article

Leave a Reply

Your email address will not be published. Required fields are marked *

No thanks