
icon icon Home
icon icon Accounts
icon icon Quick start
icon icon Symbols

The Financial Conditions Index: How One Gauge Measures Tight or Loose Markets, and Why It Moves Gold and the Dollar

Author
Abe Cofnas
Abe Cofnas
calendar Last update: 13 October 2026
watch Reading time: 9 min

A financial conditions index (FCI) is a single number that sums up how easy or hard it is to borrow, invest and take risk in an economy. It combines interest rates, credit spreads, stock prices, the exchange rate and volatility into one gauge of the financial weather. When conditions tighten, they act as a headwind for growth and risk assets; when they loosen, they act as a tailwind.

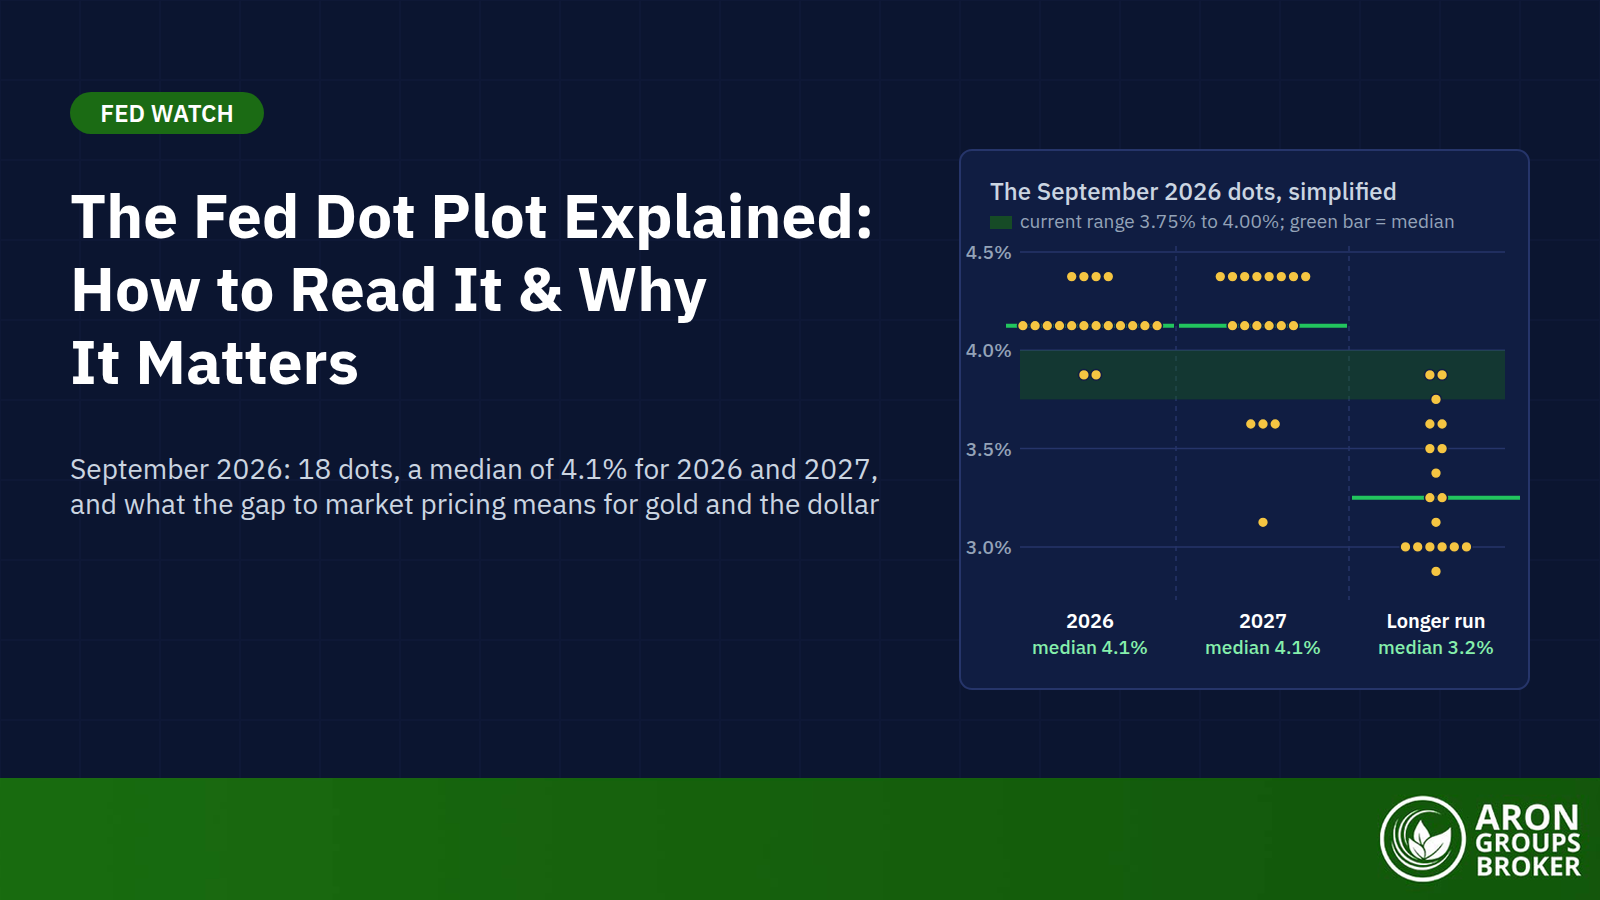
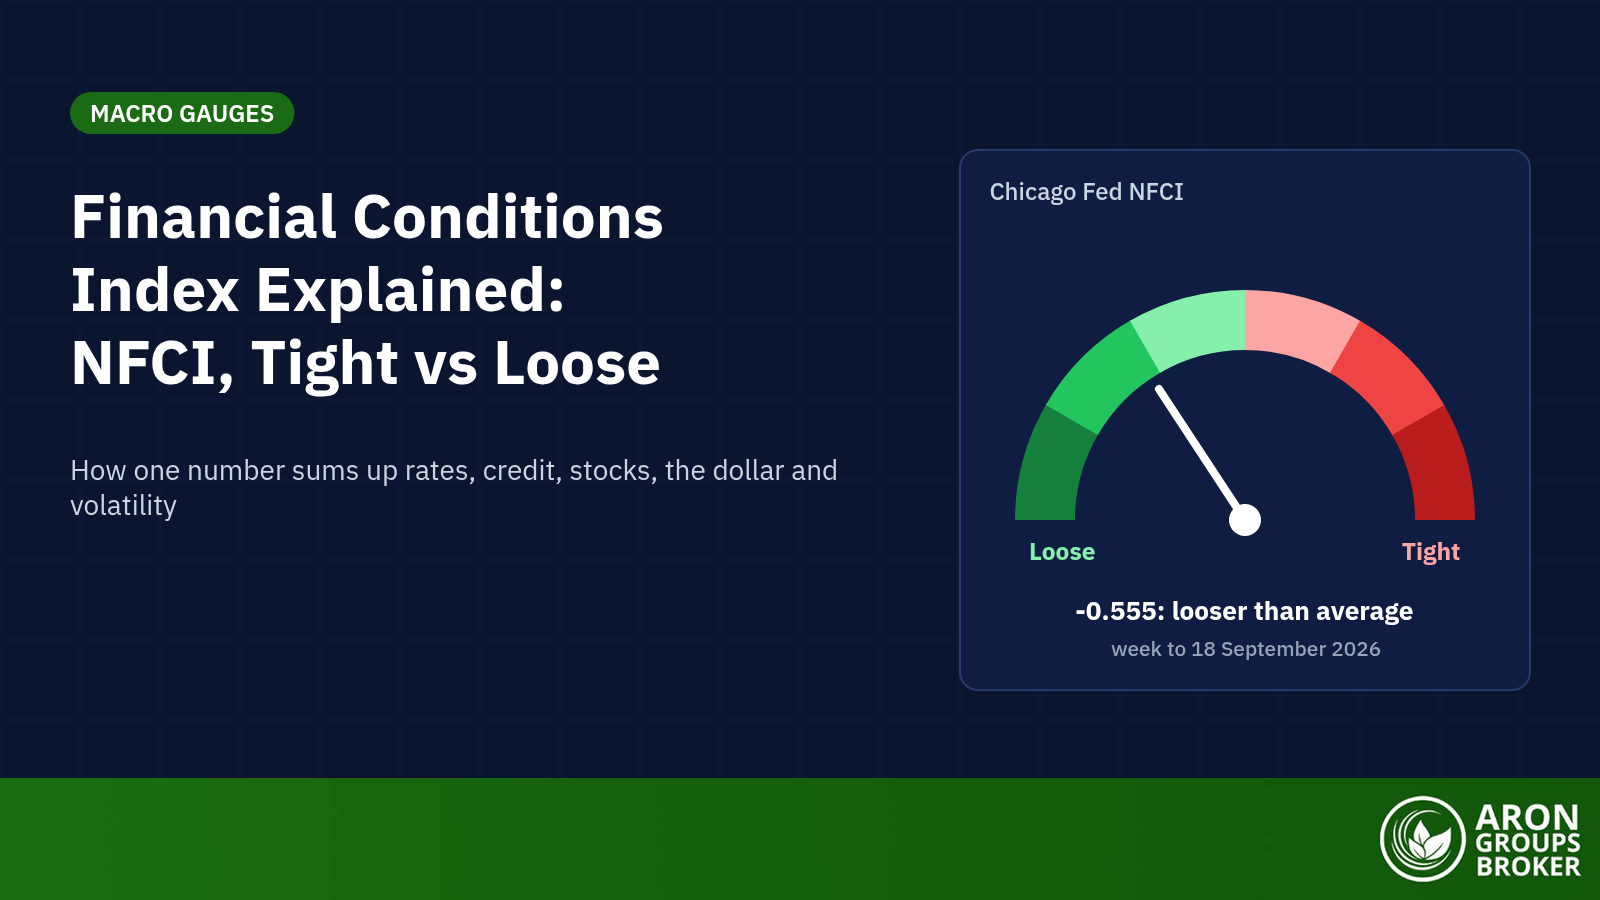
The idea matters more than usual in 2026. On 16 September the Federal Reserve raised rates to 3.75% to 4.00%, its first hike since 2023, and the 10-year Treasury yield closed at 5.18% on 24 September, the highest since 2007. Yet the Chicago Fed’s National Financial Conditions Index (NFCI) stood at -0.555 in the week to 18 September, looser than its long-run average.

This guide explains what goes into an FCI, how to read the NFCI and its rivals, and what tight or loose conditions have meant for gold, the dollar and risk assets.

bookmark
Key Takeaways
  • A financial conditions index combines interest rates, credit spreads, stock prices, the dollar and volatility into one reading of how easy it is to borrow and take risk.
  • The Chicago Fed's NFCI is updated weekly from 105 measures; zero is the average since 1971, positive means tighter than average and negative means looser.
  • On 18 September 2026 the NFCI stood at -0.555, looser than average, even after the Fed's 16 September hike to 3.75% to 4.00%.
  • Indices differ in inputs, weights and sign: Goldman Sachs sets 100 as its average, the Fed Board's FCI-G is measured in growth impact and Bloomberg treats positive as easy.
  • An FCI is a backdrop for gold, the dollar and risk assets, not a timing signal: composites move slowly, and fast gauges such as the VIX usually react first.

What Is a Financial Conditions Index?

A financial conditions index is a weighted average of market prices and, in some cases, credit and leverage data. Much like a stock index averages many share prices, an FCI averages many financial variables into one reading, usually expressed relative to a historical average. Central banks, investment banks and the IMF all publish versions.

sms-star

Risk Disclosure
Trading forex and CFDs carries a high level of risk and can result in the loss of all your capital. This content is educational and is not investment advice. Never risk money you cannot afford to lose.
Tight Versus Loose

Tight financial conditions mean borrowing is expensive, lenders demand wide spreads, stock prices are low relative to earnings, the dollar is strong and volatility is high. Businesses and households find it harder to raise money, so tight conditions work much like contractionary monetary policy, slowing spending and hiring.

Loose conditions are the opposite: cheap credit, narrow spreads, rising asset prices and calm markets. They support growth and risk-taking, but when they last too long they can also fuel excessive borrowing and asset bubbles.

Why It Is More Useful Than the Policy Rate Alone

A central bank controls one short-term rate: the federal funds rate in the United States. Households and companies, however, borrow at mortgage rates, corporate bond yields and bank loan rates. They also feel richer or poorer as stock and house prices move. An FCI captures that whole chain in one number.

What Goes Into a Financial Conditions Index

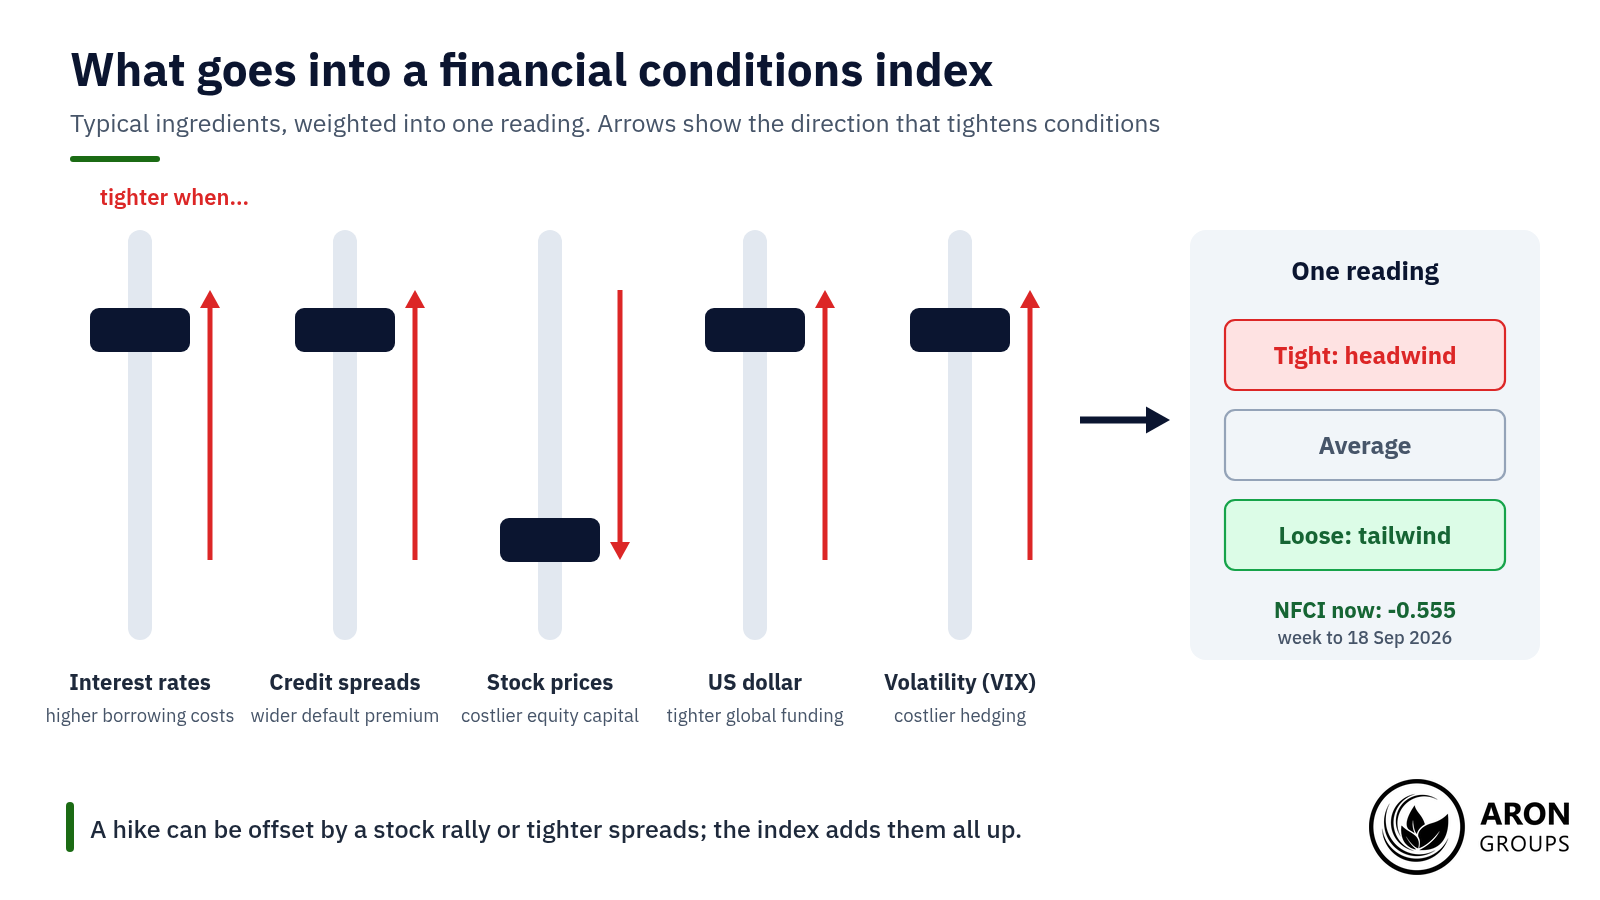
Most indices draw on five families of market prices, and each can push conditions tighter:

  • Interest rates: higher short-term and long-term yields raise borrowing costs across the economy.
  • Credit spreads: wider gaps between corporate and government bond yields show that lenders want more pay for default risk.
  • Stock prices: falling equity valuations make it costlier for firms to raise capital and reduce household wealth.
  • The US dollar: a stronger dollar tightens conditions at home through trade and abroad through dollar debt.
  • Volatility: a higher VIX raises the cost of hedging and pushes investors to cut risk.

Some indices add mortgage rates, house prices or bank lending data. Each input is standardised and weighted, and the weights are where the indices differ most.

The index nets out its inputs, so a rate hike can be offset by rallying stocks or narrowing spreads.

Prices Versus Quantities

Most FCIs are built from prices, not quantities. The Goldman Sachs, Bloomberg, IMF and Fed Board indices use rates, spreads, valuations and exchange rates. The Chicago Fed’s NFCI is the exception: its 105 measures include credit and leverage data from the banking and shadow banking systems, which is one reason it can disagree with its peers.

The Main Financial Conditions Indices Compared

Several institutions publish a financial conditions index, and they are not interchangeable. The table sets out who publishes each one, what it contains and, crucially, how to read its sign.

IndexPublisher and frequencyInputs and weightsHow to read itLatest reading
Chicago Fed NFCIChicago Fed, weekly (Wednesdays)105 measures of risk, credit and leverage0 = average since 1971; positive = tighter-0.555 (week to 18 Sep 2026)
Chicago Fed ANFCIChicago Fed, weeklyNFCI inputs with the effects of growth and inflation removedPositive = tighter than the economy would normally imply-0.573 (week to 18 Sep 2026)
Fed Board FCI-GFederal Reserve Board, monthlySeven inputs, from the fed funds rate to house prices, weighted by modelled growth effectsPercentage points of GDP growth over the next year; positive = headwind-0.89, a tailwind (Aug 2026)
Goldman Sachs FCIGoldman Sachs, daily (proprietary)Policy rate, 10-year yield, credit spread, equity valuations, trade-weighted dollar100 = average since 2000; higher = tighterSubscription only
Bloomberg US FCIBloomberg, dailyTen money, bond and equity market variables, equally weightedStandard deviations from the 1994 to mid-2008 average; positive = easierTerminal only
IMF FCIsIMF, Global Financial Stability ReportPrice-based inputs for 43 economiesPositive = tighterGlobal conditions still accommodative (Apr 2026)

The main financial conditions indices compared. Sources: Chicago Fed, Federal Reserve Board, Goldman Sachs research (2017), the IMF and a BIS comparison of index methods.

The sign conventions trip people up. A rising NFCI, IMF or Goldman Sachs reading means tightening, but a rising Bloomberg reading means easing. The FCI-G is measured in growth terms, so its August 2026 reading of -0.89 meant conditions were adding about 0.9 points to growth over the following year. A BIS comparison of index methods shows how much the inputs and weights vary.

The Goldman Sachs Financial Conditions Index

The Goldman Sachs FCI is one of the indices market commentators quote most often. Set out in its current form in a 2017 research paper, it weights five variables by their estimated effect on growth over a year. By Goldman’s rule of thumb, a 100 basis point tightening in the index lowers US GDP growth by about 0.9 percentage points over the following year. The exact weights are proprietary, so be wary of any source that quotes precise percentages.

How to Read the Chicago Fed NFCI

The NFCI is the most transparent index and the one traders can check for free. The Chicago Fed publishes it every Wednesday at 8:30 a.m. Eastern Time, covering the week to the previous Friday, and FRED carries the full history under the code NFCI. Treat each reading as provisional, because the whole history is revised every week as new data arrive.

Zero Is the Average Since 1971

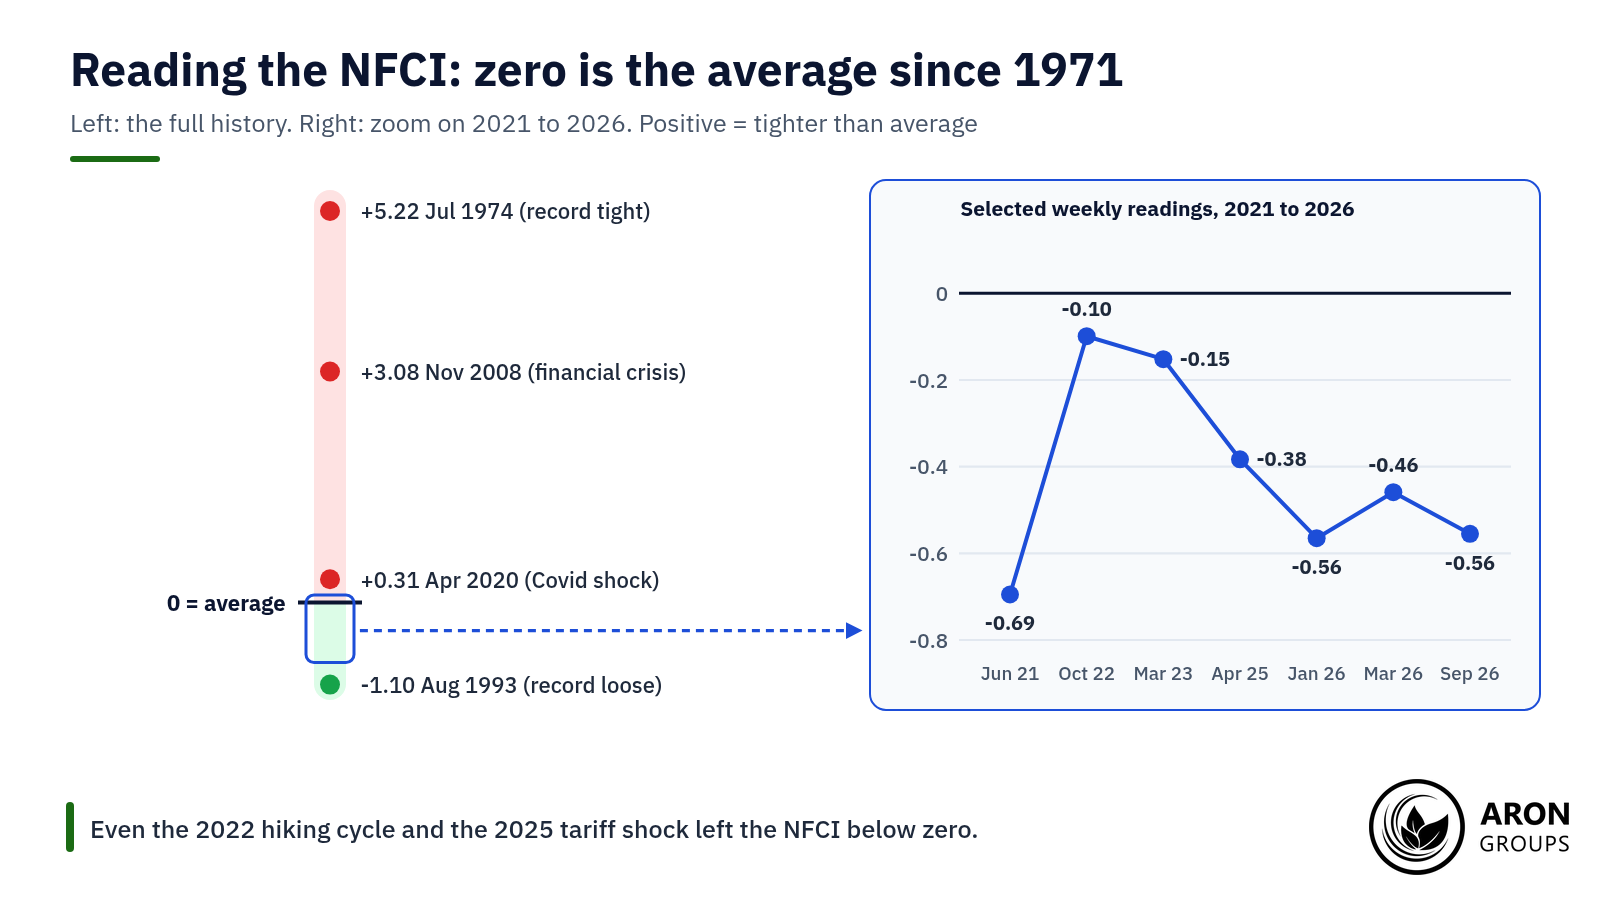
The NFCI is scaled so that zero equals the average since 1971 and each unit is one standard deviation. Positive readings mean conditions are tighter than average, and negative readings mean they are looser.

For scale, the index hit a record +5.22 in July 1974, +3.08 during the global financial crisis in November 2008 and +0.31 at the Covid peak in April 2020. Its loosest reading, -1.10, came in August 1993.

Zero is the long-run average. Even the 2022 hiking cycle and the 2025 tariff shock left the NFCI looser than normal.

The Three Subindexes

The NFCI splits into risk, credit and leverage subindexes, each scaled to its own average since 1973. Risk covers volatility and funding stress, credit covers lending conditions, and leverage covers debt and equity measures. Rising risk, tighter credit and falling leverage all push the headline index up.

In the week to 18 September 2026, risk stood at -0.625 and credit at -0.070, while leverage was +0.059, up from -0.441 in January 2025 and the only subindex above zero. Most of the looseness is coming from the risk side, which fits a low VIX and narrow credit spreads.

NFCI Versus ANFCI

The adjusted index, the ANFCI, strips out the part of each indicator that is explained by economic activity and inflation. A positive ANFCI means conditions are tighter than current growth and inflation would normally imply. On 18 September 2026 it stood at -0.573, so conditions were loose even after that adjustment.

Mini Example: Reading the September 2026 NFCI

Suppose you open FRED on Wednesday 23 September 2026 and see an NFCI of -0.555 for the week to 18 September, against a revised -0.557 a week earlier. The change of +0.002 is noise, not a trend. The level says conditions are about 0.56 standard deviations looser than the 1971 to 2026 average.

Next, check the subindexes to see where the looseness comes from and the ANFCI to see whether it survives the macro adjustment. Then note the date, because next week’s release may revise both figures.

Why the Fed Watches Financial Conditions

Monetary policy reaches the economy through financial conditions. When the Fed raises rates, it expects bond yields to rise, credit to cost more, stocks to cool and the dollar to firm, which in turn slows spending and inflation. If markets do not cooperate, a hike does less work.

Fed officials say this openly. On 1 November 2023, then Chair Jerome Powell said: “Financial conditions have tightened significantly in recent months, driven by higher longer-term bond yields.”

Research backs this up. A BIS study of the 2022 to 2023 cycle found that financial conditions moved closely with policy rates, especially early on. It also found that the tightening was stronger than in past cycles, but that its effect on real activity took longer to appear.

The Financial Conditions Paradox

Sometimes the Fed tightens and markets loosen anyway. A San Francisco Fed study of four indices found that conditions tightened before the first hike in March 2022. From late 2022, however, they became considerably looser, even though the Fed went on to add more than 2 percentage points of further hikes.

A second version came in late 2023, with the Fed on hold at 5.25% to 5.50%. The 10-year yield fell from 4.98% on 19 October to 3.79% on 27 December as markets priced cuts for 2024, and the NFCI eased from -0.290 to -0.366. At the December press conference, a reporter asked whether markets were easing policy on the Fed’s behalf.

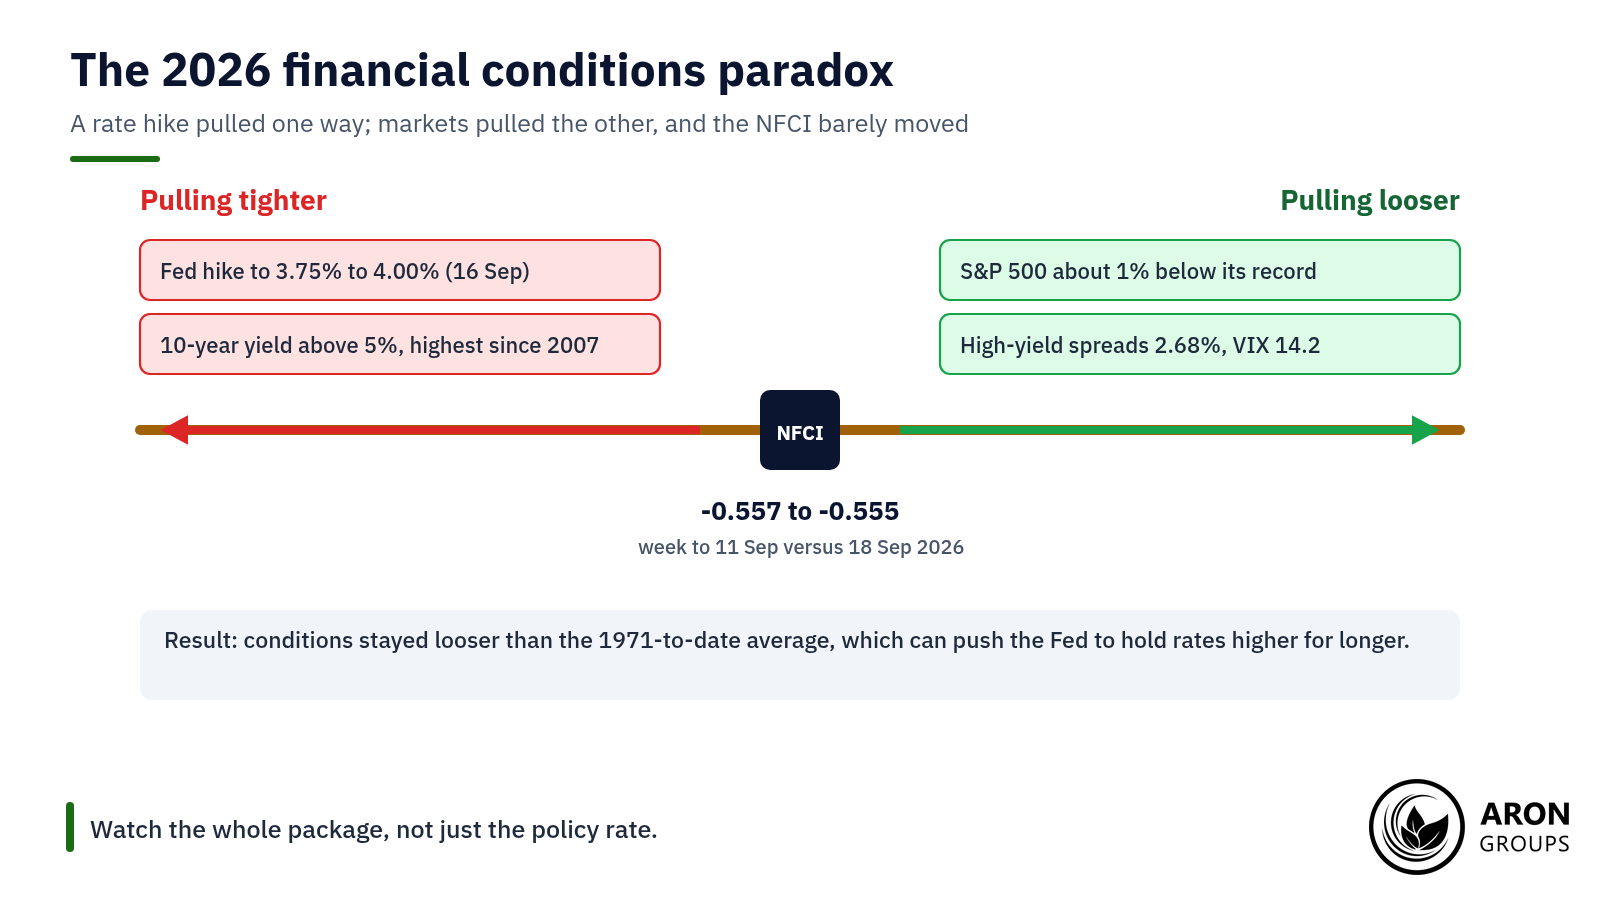
September 2026 is the latest example. The Fed hiked on 16 September and the 10-year yield rose above 5%, yet the NFCI barely moved, from -0.557 to -0.555. The S&P 500 sat about 1% below its August record, high-yield spreads were just 2.68% and the VIX was near 14. When markets offset a hike, the Fed may need to stay hawkish for longer to get the same effect.

In September 2026 a rate hike and 5% bond yields pulled conditions tighter, but rallying stocks, narrow spreads and a low VIX pulled them back.

Q: Does a loose FCI mean the Fed will hike again?
A: Not automatically. Officials weigh inflation and jobs first. But persistently loose conditions weaken the case for cuts, because they suggest policy is not restraining demand as much as intended.

Financial Conditions Versus Dollar Liquidity

Financial conditions and liquidity are related but not the same. Liquidity is about quantities, such as the size of the Fed’s balance sheet, bank reserves or the money supply. Financial conditions are about prices: what it costs to borrow and how much investors charge for taking risk. Quantitative easing adds liquidity and usually loosens conditions, but the link is far from fixed.

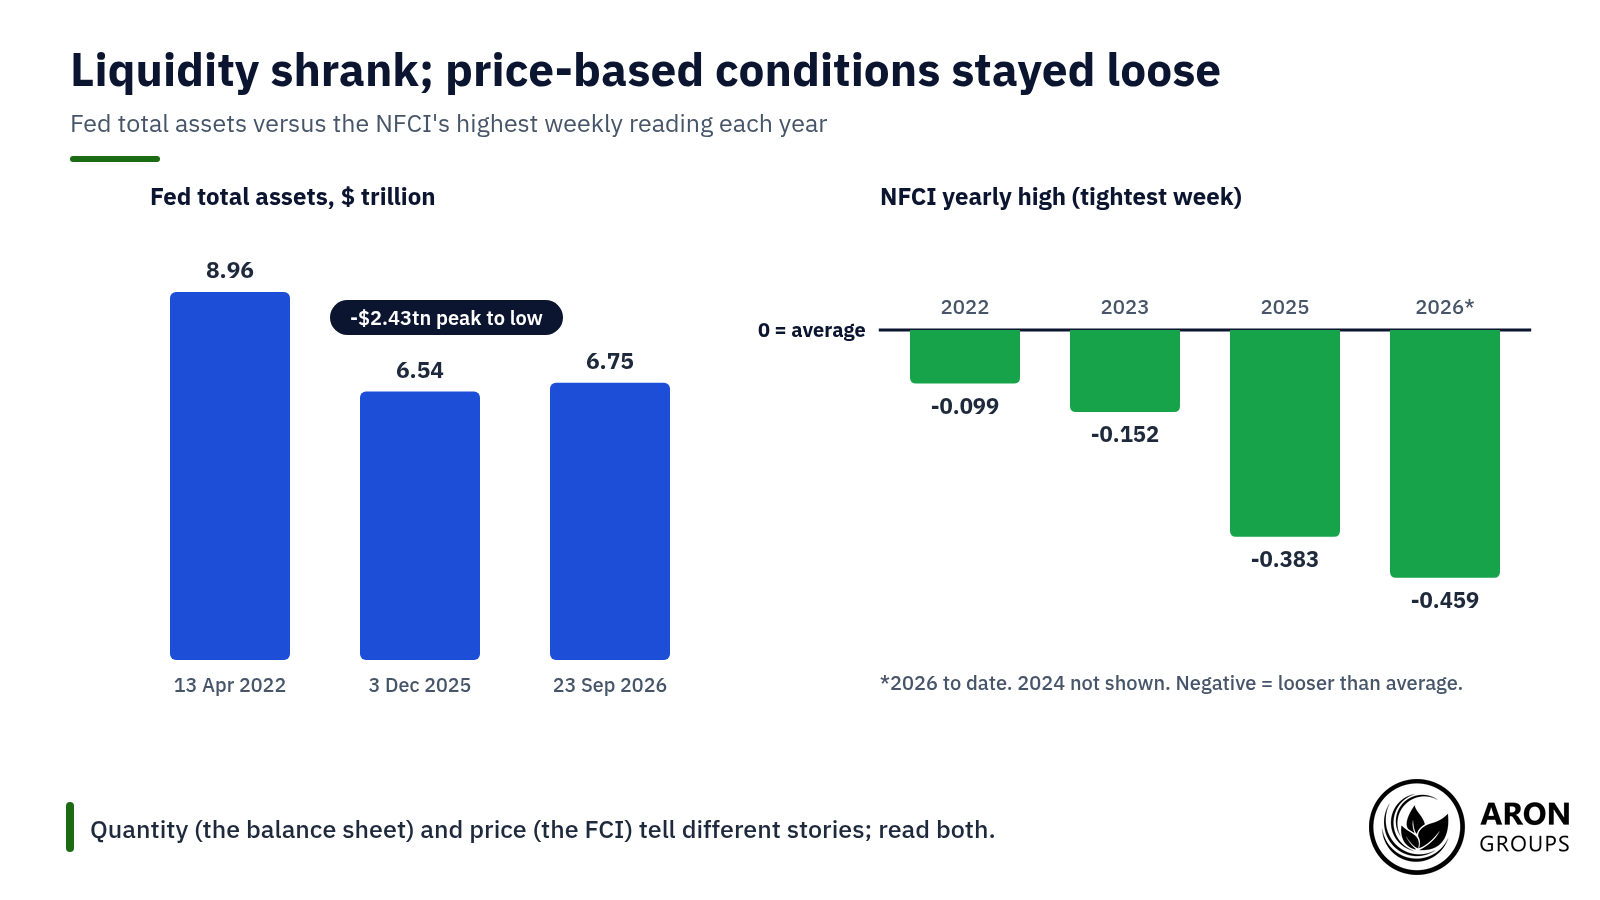
The past four years show the gap. The Fed’s total assets fell by $2.43 trillion, from $8.965 trillion in April 2022 to $6.536 trillion in December 2025, as quantitative tightening ran. Yet the NFCI’s tightest weekly reading was only -0.099 in 2022, -0.152 in 2023 and -0.383 in 2025, all looser than average.

The lesson is to read both. Liquidity tells you how much fuel is in the system, while the FCI tells you how that fuel is being priced.

Quantitative tightening shrank the Fed's balance sheet by $2.43 trillion, yet the NFCI's yearly highs stayed below zero.

What Financial Conditions Mean for Gold, the Dollar and Risk Assets

Loose conditions tend to support stocks, credit, emerging markets and other risk assets, because money is cheap and investors are willing to take risk. Tight conditions pressure them, and the US dollar often benefits, both as a safe haven and because a stronger dollar is itself part of the tightening.

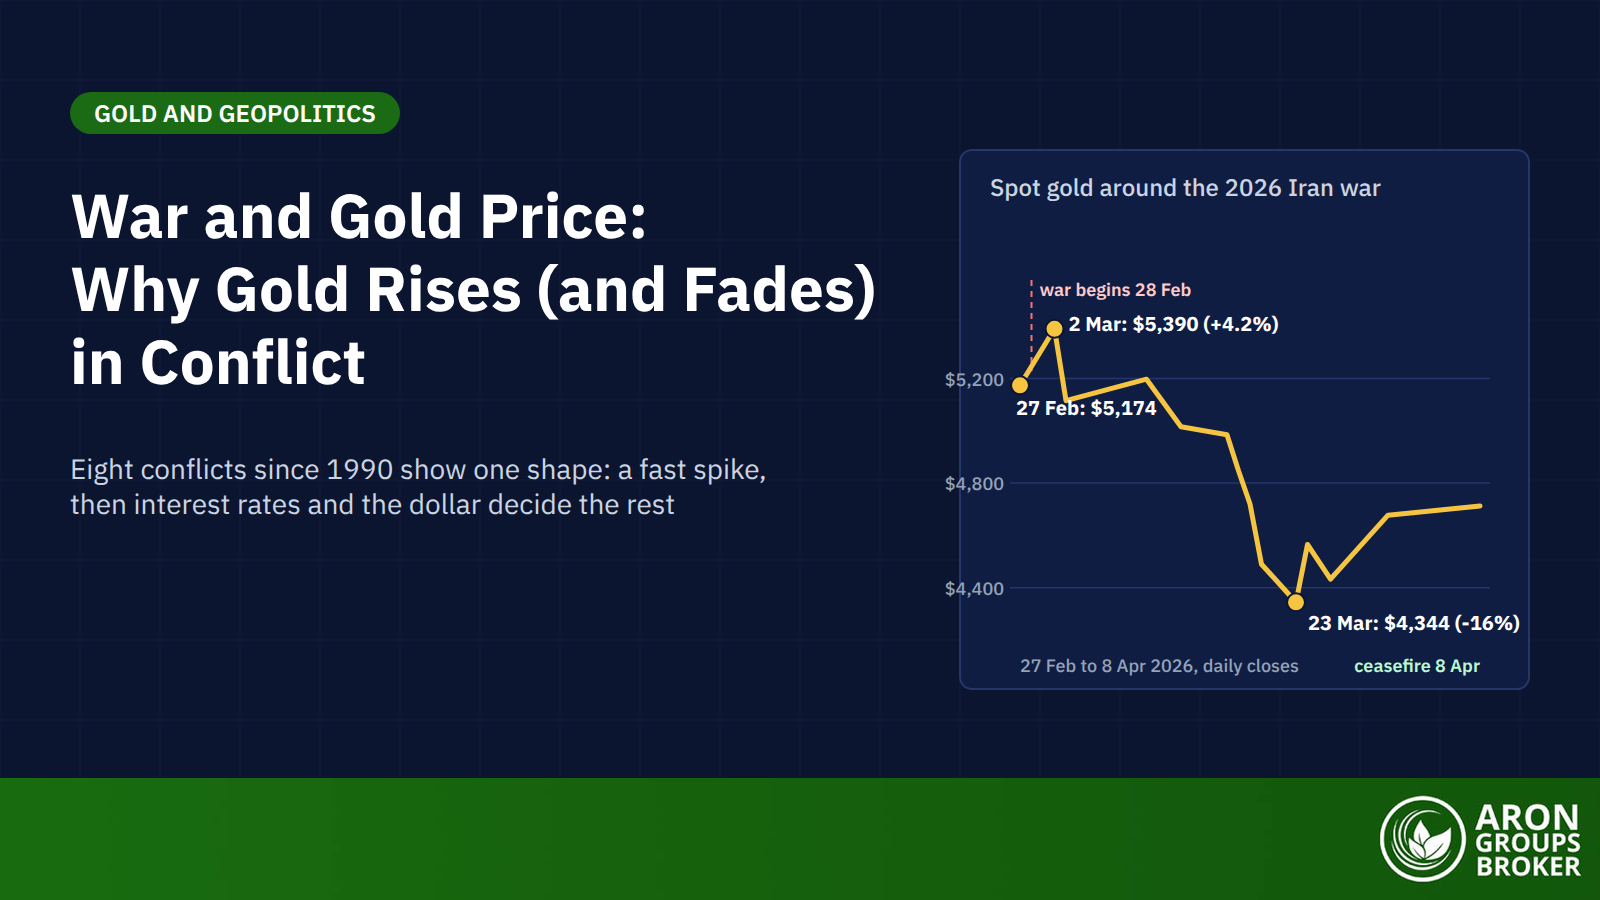
Gold is more complicated. Its main drivers include real yields, the dollar and demand for safety, and a sudden tightening can hit all three at once. In March 2026, as the NFCI tightened to -0.459 during the oil shock that followed the Iran war, gold fell 11.8% over the month while the dollar strengthened. In a scramble for cash, even havens get sold.

Fast Gauges and Slow Composites

Because a composite blends many inputs, it can lag the market badly. In the April 2025 tariff shock the VIX closed at 52.33 on 8 April, high-yield spreads reached 4.61% and the S&P 500 was 18.9% below its February record. The NFCI rose only from -0.507 at the end of January to -0.383, still looser than average.

For short-term timing, fast gauges such as the VIX, credit spreads and sentiment measures like the fear and greed index react first. The FCI is better for judging the backdrop over weeks and months.

How Traders Use It

Used well, an FCI is a filter for how much risk to take rather than a signal to buy or sell:

  • Check the level: readings well below zero describe a risk-friendly backdrop, while readings rising towards or above zero argue for smaller positions.
  • Watch the direction: a fast rise over a few weeks has marked stress episodes such as late 2008, March 2020 and March 2023.

Pair the FCI with growth data, such as the Citi Economic Surprise Index. Loose conditions alongside upside data surprises make rate cuts less likely, while tightening conditions alongside downside surprises raise the risk of a sharper slowdown.

The Honest Limits of Financial Conditions Indices

An FCI describes the present; it does not forecast. Composite indices are revised, they lag fast-moving markets and they often disagree. In 2022 the NFCI never rose above -0.099, while the Fed Board’s one-year FCI-G signalled a drag of about 1.4 percentage points on growth.

Price-based indices can also miss the slow build-up of debt that precedes many downturns. BIS research found that financial-cycle measures, such as the share of income spent servicing debt, have predicted recessions better than the yield curve. That is a reason to watch leverage data too, not to ignore FCIs.

Where Aron Groups Fits

Aron Groups gives traders access to the markets that move most when financial conditions shift, including major currency pairs and gold on XAU/USD, through MetaTrader 5. Shifts in conditions tend to show up quickly in the dollar and in gold, so knowing the backdrop helps before you pick an entry.

The NFCI updates on Wednesdays, and the Fed meetings, inflation data and jobs reports that move it are listed on the economic calendar. A demo account lets you practise reading conditions and sizing positions before you risk real money.

Conclusion

A financial conditions index turns dozens of market prices into one reading of how easy it is to borrow, invest and take risk. The Chicago Fed’s NFCI is the most accessible version, with zero as the long-run average and positive readings meaning tighter than normal.

The September 2026 reading of -0.555 shows why the concept matters: the Fed hiked and bond yields topped 5%, yet markets stayed loose. Use the FCI as the backdrop for gold, the dollar and risk assets, and cross-check it with fast gauges, because markets can turn faster than any weekly index.

Frequently Asked Questions

Quick answers to the most common questions about financial conditions indices.

What is the NFCI?

It is the Chicago Fed’s National Financial Conditions Index, a weekly measure of US financial conditions built from 105 indicators. Zero is the average since 1971, positive readings are tighter than average and negative readings are looser.

Is a negative NFCI good or bad?

A negative NFCI means conditions are looser than average, which supports growth and risk assets in the short run. If it persists while inflation is high, it can keep the Fed tighter for longer.

What is the Goldman Sachs Financial Conditions Index?

It is a daily index from Goldman Sachs that combines the policy rate, the 10-year yield, credit spreads, equity valuations and the trade-weighted dollar. It is set to 100 at its average since 2000, and higher readings mean tighter conditions.

How often is the NFCI updated?

Every week. The Chicago Fed releases it on Wednesdays at 8:30 a.m. Eastern Time, covering the week to the previous Friday, and revises past values as new data arrive.

Continue Reading
not-found
calendar 13 October 2026
Rate this article

Leave a Reply

Your email address will not be published. Required fields are marked *

No thanks