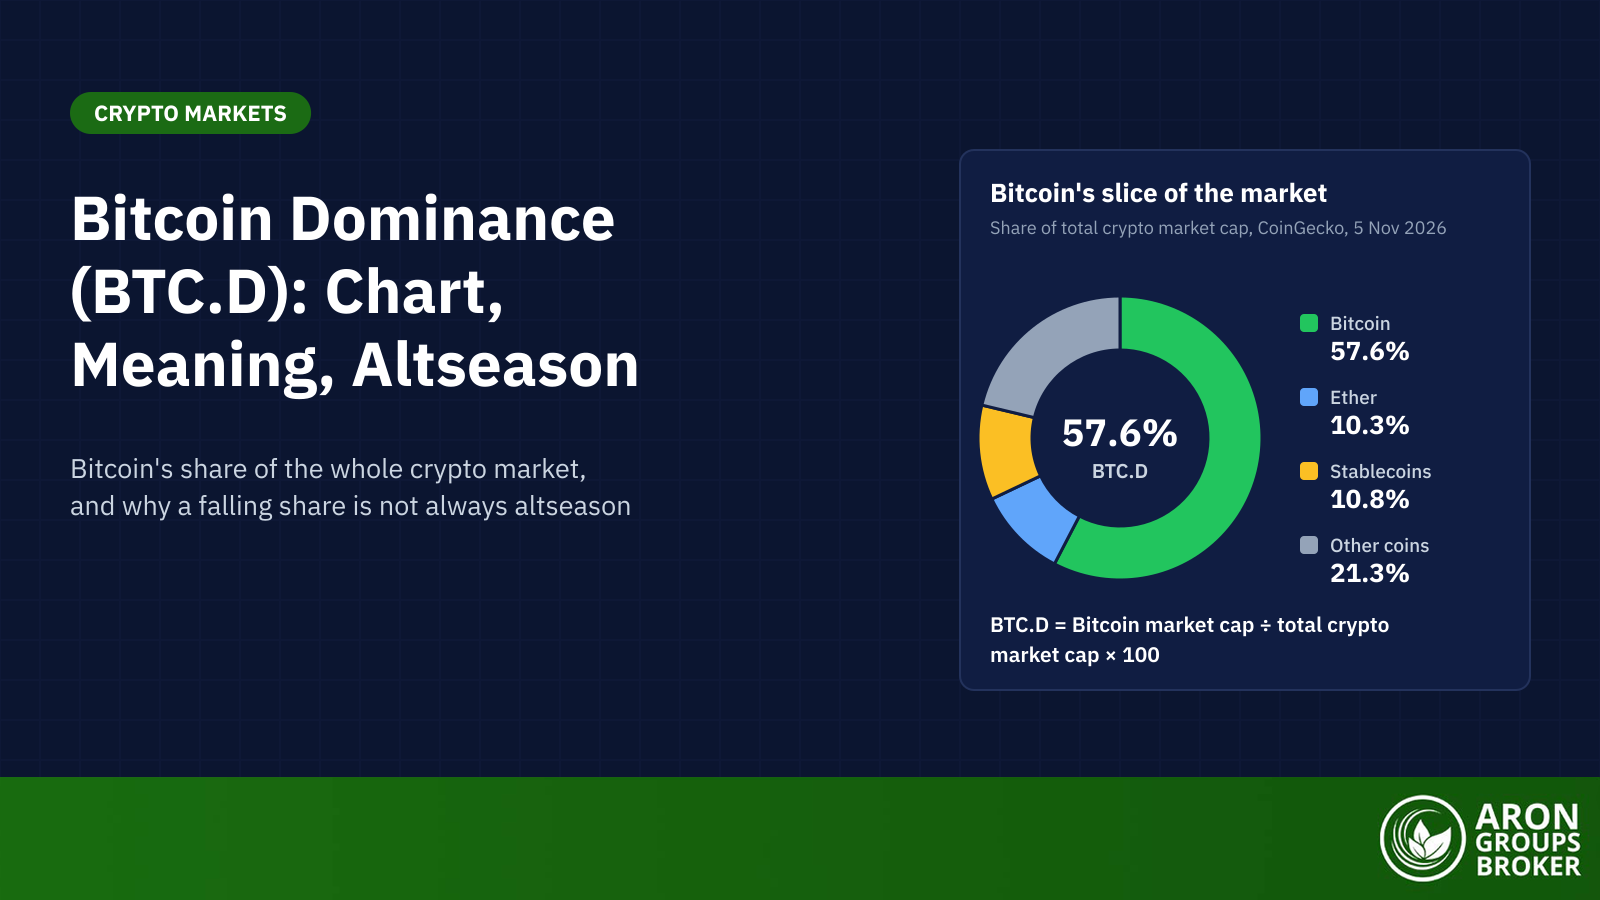

Bitcoin dominance, shown on charts as BTC.D, is Bitcoin’s share of the total crypto market cap. It equals Bitcoin’s market cap divided by the combined market cap of all cryptocurrencies, times 100. A rising reading means Bitcoin is outgrowing the rest of the market, stablecoins included; a falling one means it is lagging.
It matters now because altcoin traders are still waiting for a rotation. On 5 November 2026, CoinGecko put current bitcoin dominance at 57.64%, against 58.69% a year earlier. Blockchaincenter’s altcoin season index read 43, well short of the 75 that marks altseason. On CoinGecko, Bitcoin closed at $77,385 on 3 November 2026, after a volatile first half left it 33.1% below its 2025 close.
This guide explains the BTC.D formula, why CoinGecko, CoinMarketCap and TradingView disagree, and how to read the bitcoin dominance chart across cycles. It then covers the four price and dominance scenarios, the altcoin season index, and the stablecoin effect that can fake an altseason signal.
- Bitcoin dominance (BTC.D) is Bitcoin's market cap divided by total crypto market cap, times 100. It shows relative performance, not Bitcoin's price direction.
- Providers divide by different totals. On 5 November 2026, CoinGecko read 57.64% and CoinMarketCap 59.97%, while TradingView counts only the 125 largest coins.
- Falling dominance signals altseason when total market cap rises. In the second quarter of 2026 both fell, leaving CoinGecko's reading at 55.4% on 30 June.
- Stablecoins inflate the total and depress BTC.D without any rotation. Their CoinGecko share rose from 8.19% to 10.79% in the year to 5 November 2026.
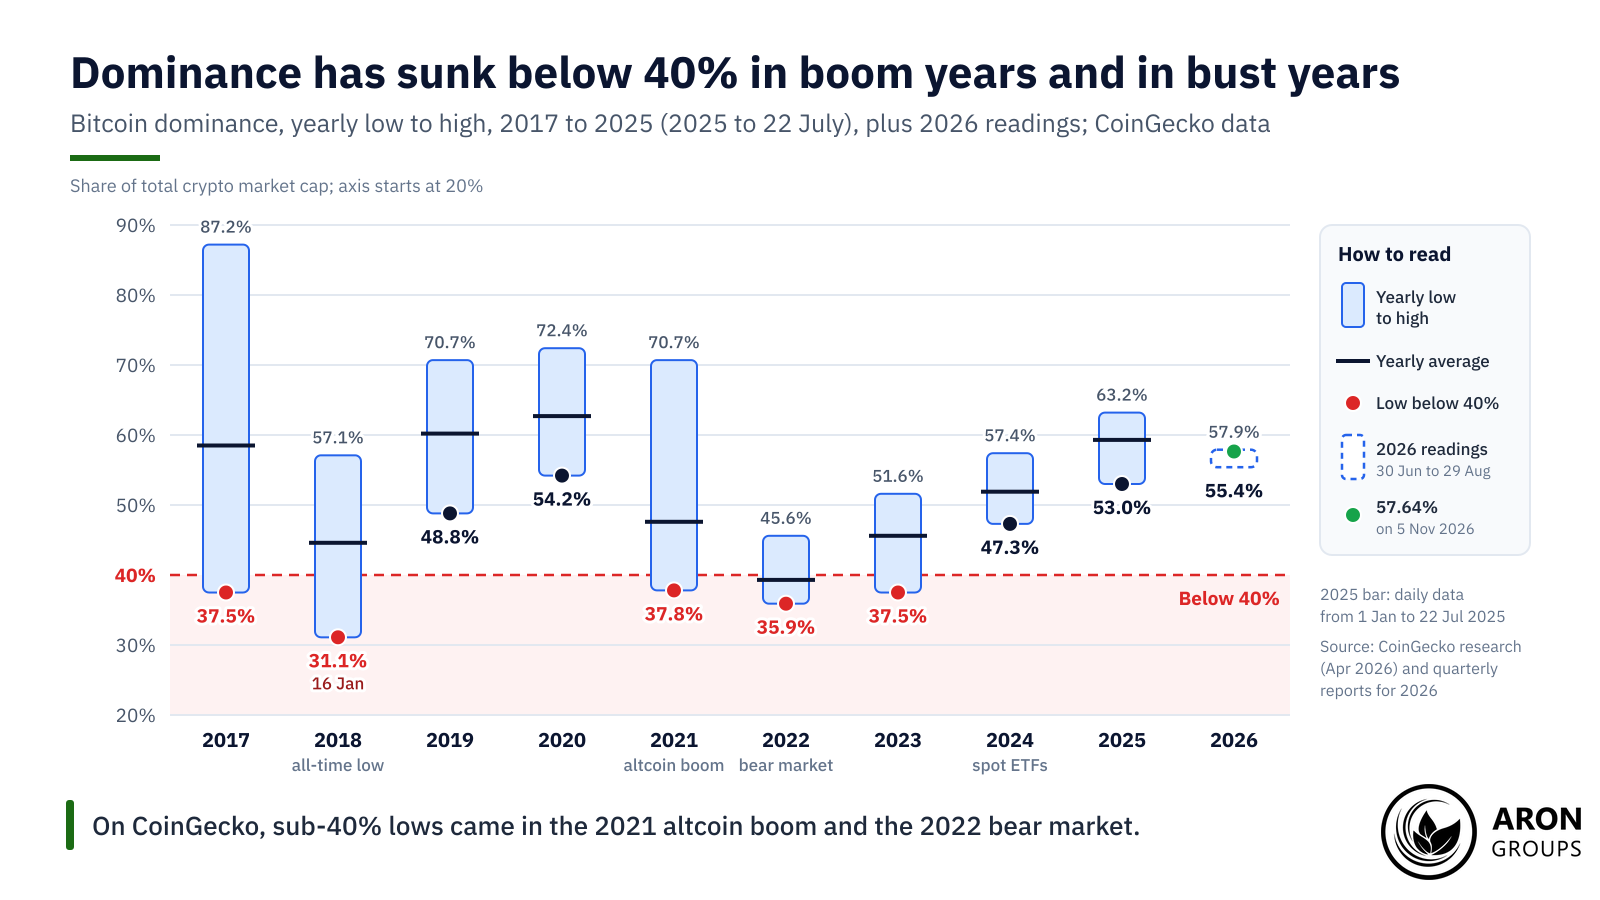
- The 40% line is a past low, not a trigger. On CoinGecko, dominance fell to 37.8% in 2021's altcoin boom, and further, to 35.9%, in the 2022 bear market.
What Is Bitcoin Dominance?
Bitcoin dominance is Bitcoin’s market cap as a share of total crypto market cap. The standard bitcoin dominance definition is BTC.D = Bitcoin market cap ÷ total crypto market cap × 100. CoinGecko, CoinMarketCap and TradingView all use this formula. In an illustrative market where Bitcoin is worth $1.8 trillion out of 3 trillion, BTC.D is 60%. Market cap here means price times circulating supply.
Risk Disclosure
Trading forex and CFDs carries a high level of risk and can result in the loss of all your capital. This content is educational and is not investment advice. Never risk money you cannot afford to lose.
Bitcoin Dominance Today: Readings on 5 November 2026
Anyone checking bitcoin dominance today gets a different answer from each site: on 5 November 2026, CoinGecko showed 57.64% and CoinMarketCap 59.97%. As a bitcoin dominance percentage, CoinGecko’s 57.64% on 5 November 2026 means Bitcoin held about 58 cents of every crypto dollar. The same table gave ether 10.29%, stablecoins 10.79% and all other coins 21.28%. CoinMarketCap’s reading came with a total crypto market cap of $2.62 trillion. Readings move during the day, so a dated snapshot matters more than the second decimal.
Why CoinGecko, CoinMarketCap and TradingView Disagree
Providers disagree because they divide by different totals, not because they price Bitcoin differently. TradingView‘s BTC.D uses only the combined market cap of the 125 largest coins. CoinGecko tracks 21,662 coins but leaves wrapped, bridged and staked tokens out of its total. CoinMarketCap lists 65.47 million tokens, yet ranks coins on a ‘public float’ market cap built from supply it verifies.
Bitcoin’s own market cap is similar on every site, because its supply is public. A bigger denominator therefore means a lower share. That is why CoinGecko’s readings sat about two points below CoinMarketCap’s on 5 November 2026. It is also why a reading means most against the same provider’s history. Some traders prefer a measure without stablecoins: TradingView’s TOTALES index drops them, and on CoinGecko’s table that approach gives Bitcoin 64.61% of the rest.
| Provider | What the total covers | Coins behind it | Dated BTC dominance reading |
|---|---|---|---|
| TradingView (CRYPTOCAP:BTC.D) | Top 125 coins; a separate TOTALES index drops stablecoins | 125 | 61% on 6 May 2026, per Cointelegraph |
| CoinMarketCap | Coins ranked on verified 'public float' supply | 65.47 million listed | 59.97% on 5 November 2026 |
| CoinGecko | All tracked coins except wrapped, bridged and staked tokens | 21,662 tracked | 57.64% on 5 November 2026 |
How the three main providers build the total behind Bitcoin dominance; readings from each provider’s own pages, and TradingView’s as reported by Cointelegraph.
What Bitcoin Dominance Measures, and What It Does Not
Bitcoin dominance measures relative performance: whether Bitcoin is growing faster or slower than the market around it. It also hints at capital preference and sentiment, since money has tended to crowd into Bitcoin when traders turn cautious. On its own it says nothing about Bitcoin’s price direction. Dominance can rise while Bitcoin falls, as long as everything else falls faster.
BTC Dominance vs Altcoin Dominance
Altcoin dominance is the mirror image of BTC dominance. It covers every coin that is not Bitcoin, so the two always add up to 100%. On CoinGecko on 5 November 2026, altcoin dominance was 42.36%. That figure counts stablecoins, which CoinGecko treats as altcoins but which do not move like them. Without them, altcoins held 31.57% of the market, and ETH dominance, ether’s own share, was 10.29%.
TOTAL2, TOTAL3 and Market Rotation
TradingView publishes two indices that track the rest of the market in dollars rather than as a share. TOTAL2 is the market cap of the top 125 coins excluding Bitcoin, and TOTAL3 also excludes ether. Traders compare them with BTC.D to judge market rotation, the shift of money from Bitcoin to ether and then to smaller coins. Because both are dollar totals, they show whether altcoins are gaining in absolute terms, which a share cannot. On 6 May 2026, Cointelegraph reported TOTAL3 at a two-month high of $765 billion.
Bitcoin Dominance Chart: What the Cycles Show
The long-run bitcoin dominance chart shows deep falls in altcoin booms, and also in bear markets. CoinGecko’s research, using daily data from 29 April 2013 to 22 July 2025, puts the all-time high at 99.1% on 29 May 2013. The all-time low was 31.1% on 16 January 2018, during a sharp sell-off in Bitcoin.
Dominance fell from 70.7% on 3 January 2021 to a 2021 low of 37.8%, as ether and other altcoins boomed. Yet it sank further, to 35.9%, in the 2022 bear market, and the 2023 low was 37.5%. In 2024, the year US spot bitcoin ETFs launched, the low was 47.3%, and in 2025, to 22 July, it was 53.0%. On CoinGecko’s quarterly data, bitcoin dominance ended March 2026 at 56.3%, June 2026 at 55.4% and September 2026 at 56.7%. Its third-quarter high was 57.9% on 29 August 2026.
Rising BTC.D: Bitcoin Season
Rising dominance usually marks a Bitcoin season, when capital concentrates in Bitcoin and altcoins look like the riskier bet. Inside crypto, that is a risk-off stance. In the first quarter of 2025, CoinGecko’s reading rose 4.6 percentage points to 59.1%, while Bitcoin fell 11.8% and ether lost 45.3%.
Falling BTC.D: The Classic Altseason Tell
A sustained fall in BTC.D is the classic altseason tell: in a risk-on market, it means other coins are gaining share. In 2017, CoinGecko’s reading slid from a high of 87.2% and first dropped below half on 16 May 2017, at 48.5%. In the third quarter of 2025, CoinGecko’s reading fell 5.2 points to 56.9%. Ether rose 68.5% in that quarter and Bitcoin only 6.4%. Blockchaincenter’s index last showed Altcoin Season on 26 September 2025, near the end of that quarter.
The Four Scenarios: Price and Dominance Together
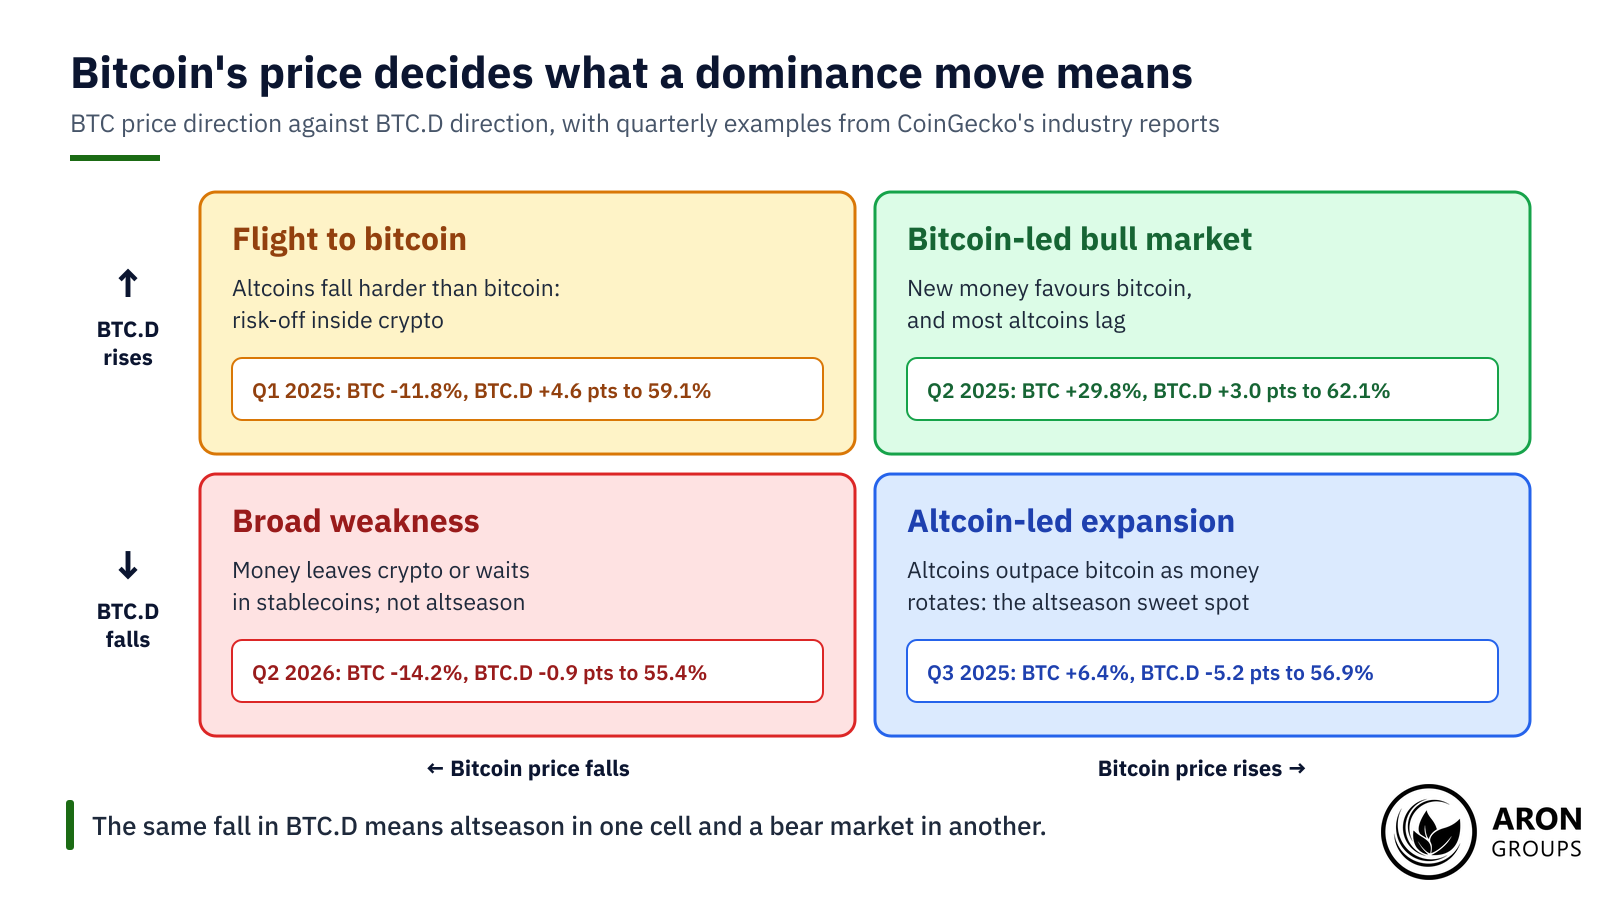
Reading BTC.D next to Bitcoin’s price separates four market states. The pairing matters because dominance alone cannot show whether money is entering or leaving crypto. Each row below gives a quarter from CoinGecko’s reports in which price and dominance moved that way.
| Bitcoin price | BTC dominance | Usual reading | CoinGecko example |
|---|---|---|---|
| Rising | Rising | Bitcoin-led bull market: new money favours Bitcoin | Q2 2025: Bitcoin +29.8%, dominance +3.0 points to 62.1% |
| Rising | Falling | Altcoin-led expansion, the altseason sweet spot | Q3 2025: Bitcoin +6.4%, dominance -5.2 points to 56.9% |
| Falling | Rising | Flight to Bitcoin: altcoins bleed harder | Q1 2025: Bitcoin -11.8%, dominance +4.6 points to 59.1% |
| Falling | Falling | Broad weakness: money leaves crypto or waits in stablecoins | Q2 2026: Bitcoin -14.2%, dominance -0.9 points to 55.4% |
The four price and dominance scenarios, with quarterly examples from CoinGecko’s industry reports; points are percentage points.
The last row is easy to misread. In the second quarter of 2026, Bitcoin fell 14.2% and ether 25.4%, yet Bitcoin’s dominance still slipped. Stablecoins barely moved while everything else fell, so they took share from both.
The Altcoin Season Index and Rough Dominance Bands
The altcoin season index measures breadth rather than share. Blockchaincenter publishes one version. It calls Altcoin Season when 75% of the top 50 coins beat Bitcoin over 90 days, and Bitcoin Season at 25 or below. Stablecoins and asset-backed tokens such as WBTC are excluded. CoinMarketCap runs a similar index on its top 100 coins, with the same exclusions, the same 90-day window and a daily refresh.
The two indices disagree as well. On 5 November 2026, Blockchaincenter’s read 43 and CoinMarketCap’s 52, both between the two seasons. Blockchaincenter’s index was still in Bitcoin Season on 1 September 2026, and moved to neutral on 2 September 2026.
Dominance Levels as a Rough Guide
Traders also use rough BTC.D bands. These are community rules of thumb, not established levels, and popular versions overlap. As an illustrative heuristic with clean edges, above 60% is Bitcoin-heavy and 50% to 60% balanced. From 40% to 50%, altseason talk gets serious. Below 40%, CoinGecko’s data show the 2018 and 2021 lows, but also the 2022 bear market. The band also depends on the chart: on 5 November 2026, CoinMarketCap and CoinGecko sat about two points apart.
Key Point
The 40% line is not a trigger. On CoinGecko, dominance went below it in the 2021 altcoin boom and in the 2022 bear market alike.
Does Falling Dominance Mean Altseason?
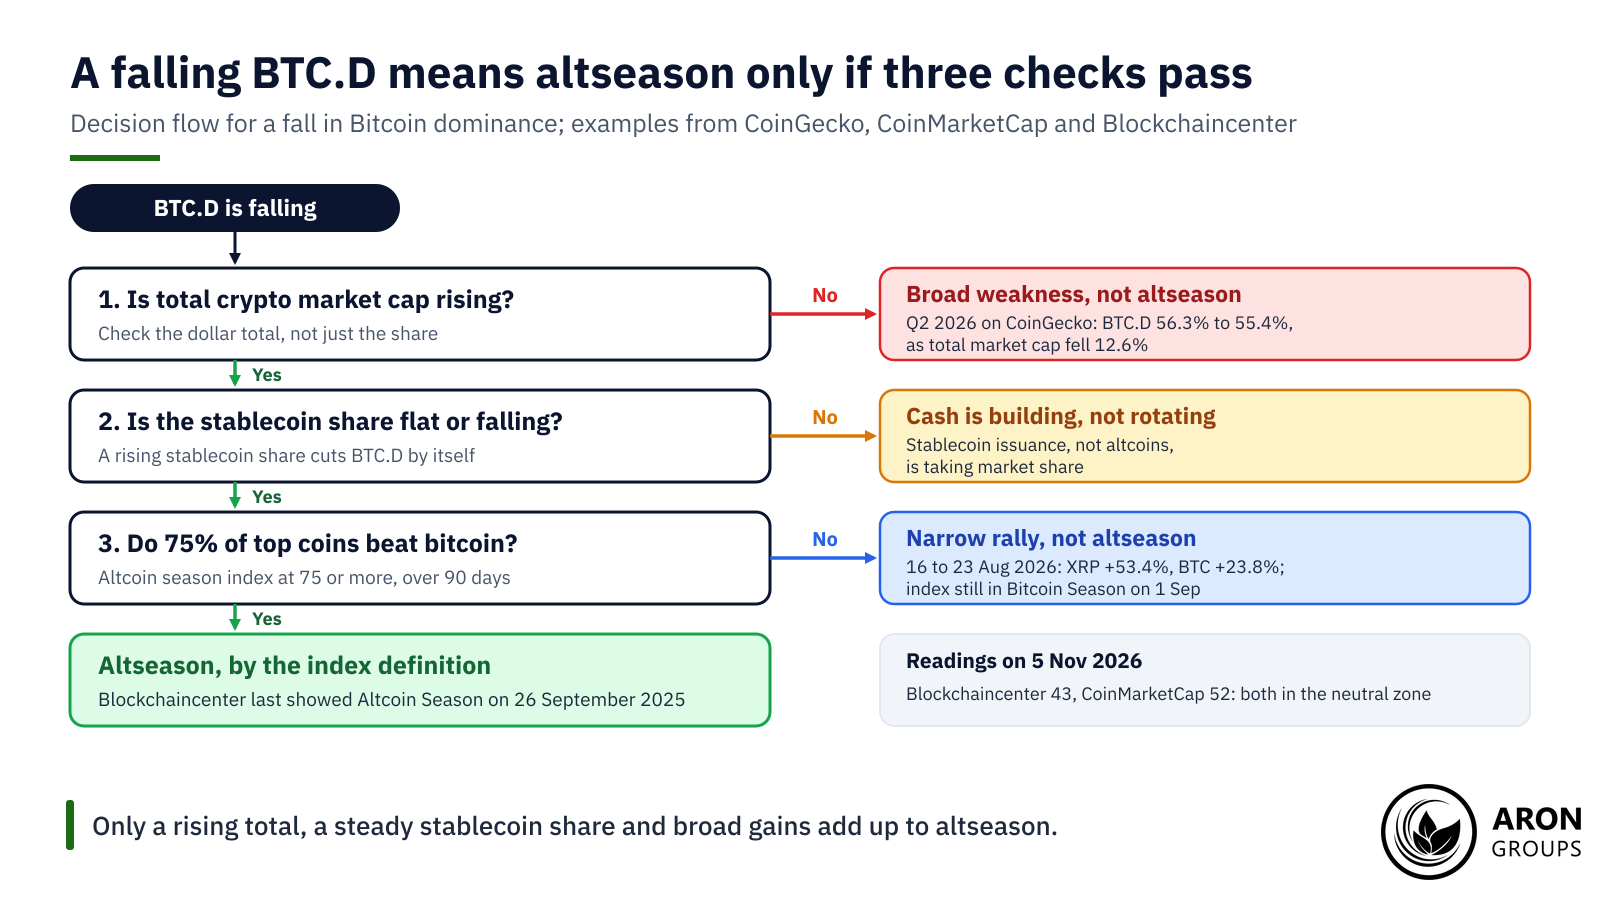
A falling BTC.D is an altseason signal when total market cap is rising, so money is flowing into altcoins. With a falling total, it is bearish for everything. That was the first half of 2026 on CoinGecko. Dominance slipped in both quarters, while total market cap fell 20.4% and then 12.6%, to $2.1 trillion. The effect also runs in reverse. In the third quarter of 2026, total market cap rose 39.6% and ether 71.0%. Yet dominance rose 1.4 points to 56.7%, as the stablecoin share shrank.
The Stablecoin Effect
Stablecoins such as USDT and USDC inflate total market cap without adding risk capital, and they quietly suppress Bitcoin dominance. Their main use so far has been crypto trading, the BIS says. Because they hold near one dollar, their share tends to rise when crypto prices fall. In the year to 5 November 2026, CoinGecko’s stablecoin share rose from 8.19% to 10.79%.
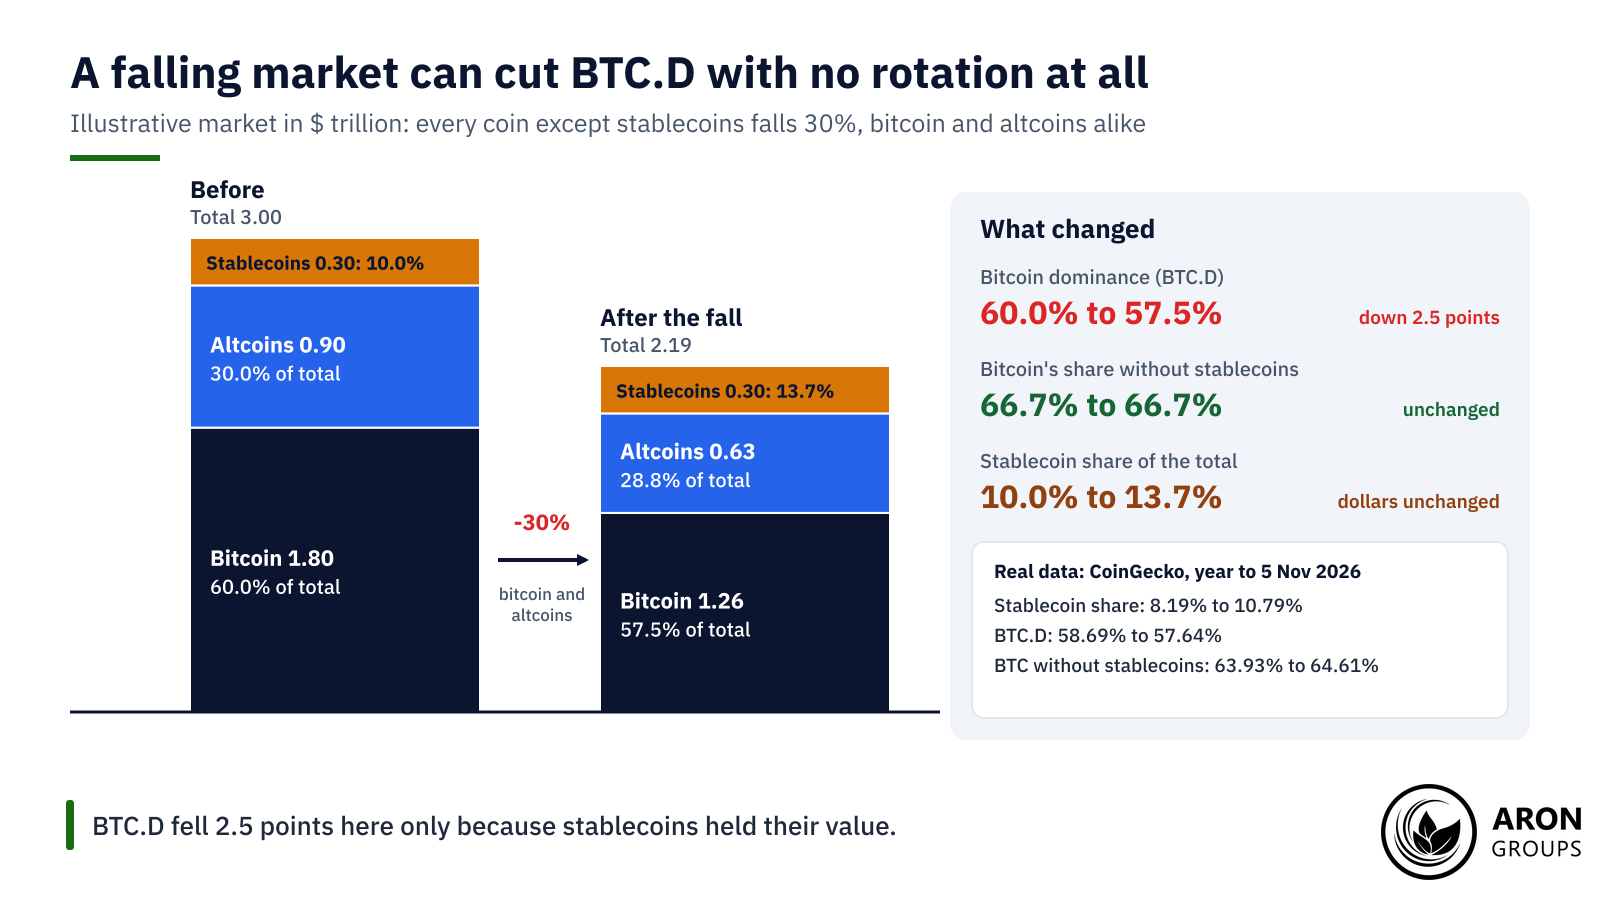
Over that year, Bitcoin’s share fell 1.05 points, from 58.69% to 57.64%. Yet ether and the other coins lost share too, from 33.12% to 31.57%. Excluding stablecoins, Bitcoin’s share rose from 63.93% to 64.61%. The lower BTC.D came from the larger stablecoin share, not from a rotation into altcoins.
Mini Example: How a Falling Market Lowers BTC.D
Take an illustrative crypto market worth $3.0 trillion. Bitcoin makes up 1.8 trillion of it, altcoins 0.9 trillion and stablecoins 0.3 trillion. BTC.D is 1.8 ÷ 3.0 × 100 = 60.0%, and Bitcoin’s share without stablecoins is 1.8 ÷ 2.7 = 66.7%.
Now every coin except the stablecoins falls 30%, so nothing rotates. Bitcoin drops to 1.26 trillion and altcoins to 0.63 trillion, while stablecoins stay at 0.30 trillion. The total becomes 1.26 + 0.63 + 0.30 = 2.19 trillion.
BTC.D is now 1.26 ÷ 2.19 × 100 = 57.5%, down 2.5 points. Without stablecoins it is 1.26 ÷ 1.89 = 66.7%, unchanged. The whole fall in dominance came from the stablecoin share rising from 10.0% to 13.7%.
ETFs, Institutions and Single-Token Rallies
Many analysts argue that ETFs and institutional ownership have kept capital in Bitcoin longer since spot funds launched in 2024. The SEC approved US spot bitcoin ETPs on 10 January 2024, and these exchange-traded funds hold Bitcoin rather than altcoins. CoinGecko put their assets at $108.0 billion on 30 September 2026.
The flows have been uneven, so the evidence is mixed. CoinGecko reports net outflows from US spot bitcoin ETFs in the first and second quarters of 2026. Inflows of $6.4 billion followed in the third. Spot ether ETFs drew $3.1 billion in the same quarter.
Individual tokens can also rally without a market-wide rotation. Between CoinMarketCap’s snapshots of 16 and 23 August 2026, XRP rose 53.4% against Bitcoin’s 23.8%. Yet CoinGecko’s dominance reached its third-quarter high of 57.9% on 29 August, and Blockchaincenter’s index still read Bitcoin Season on 1 September 2026.
Reading BTC.D Alongside Other Signals
Many traders read BTC.D as one input among several. A common routine checks it on weekly closes, next to TOTAL2, TOTAL3 and the ETH/BTC ratio, to see whether a move is broad. The ETH/BTC ratio is the narrower test: it rose in the third quarter of 2026, when ether gained 71.0% against Bitcoin’s 42.7%. Some add sentiment gauges such as a fear and greed index or the funding rate on perpetual futures. The aim is to classify the market regime rather than to time single trades.
Q: Is rising Bitcoin dominance bullish for Bitcoin’s price?
A: Not by itself. Dominance rose 4.6 points in the first quarter of 2025 while Bitcoin fell 11.8%. It shows relative strength, so it needs reading with the price trend.
The Honest Limits of Bitcoin Dominance
Bitcoin dominance is an identity, not a cause. It moves when any coin’s price or supply moves, so a change can come from Bitcoin, from altcoins or from stablecoin issuance. Reading intent into it is interpretation, not measurement. Its inputs are also estimates: CoinMarketCap shows a question mark where it has not sufficiently verified a coin’s circulating supply.
The denominator also shifts under the reader. New tokens enter the total as they list, providers change their rules, and TradingView counts only 125 coins. Even history differs by source. Published January 2018 lows run from 31.1% in CoinGecko’s research to 36.7% on a TradingView chart cited by Cointelegraph in 2021.
Thresholds are conventions too. The 75% altseason rule and the 40% to 60% bands are choices made by index publishers and traders, not tested laws. Many crypto-assets are highly speculative and volatile, ESMA has warned, with sudden and extreme price swings that can overtake any dominance reading.
Trading Bitcoin Dominance With CFDs
Aron Groups does not offer spot coins, wallets or staking, so its clients cannot hold Bitcoin or altcoins through it. It offers crypto CFDs on MetaTrader 5, including BTCUSD, ETHUSD, SOLUSD and XRPUSD, which appear on its Islamic account page. A CFD gives price exposure only, so traders express a dominance view through individual prices, such as BTCUSD against ETHUSD.
Leverage magnifies losses as well as gains. Crypto leverage tiers run up to 1:50 on smaller trade values and fall to 1:10 on larger ones. Overnight swaps are added to or subtracted from the account, and prices can gap past a stop-loss. Margin calls come at a 100% margin level, with stop-out at 50%, or 40% on Islamic and VIP accounts. A demo account with virtual funds allows practice first.
Conclusion
Bitcoin dominance is a simple ratio with a crowded denominator. It shows whether Bitcoin is gaining or losing share, but not why. Providers can also sit about two points apart on the same day.
A useful reading combines three checks: the direction of total market cap, the stablecoin share and the breadth of altcoin gains. On 5 November 2026, dominance was above its June level and both altcoin season indices sat in neutral territory. On that evidence, the market was not in altseason.
Frequently Asked Questions
Short answers to common questions about Bitcoin dominance.
How do you calculate bitcoin dominance?
Divide Bitcoin’s market cap by total crypto market cap and multiply by 100. If Bitcoin is worth $1.8 trillion in an illustrative market of 3 trillion, BTC.D is 60%.
Why is bitcoin dominance different on TradingView and CoinGecko?
TradingView divides by the 125 largest coins, while CoinGecko’s total covers 21,662 tracked coins. A larger total gives a lower share, so CoinGecko’s reading tends to sit below TradingView’s.
Is BTC dominance the same as BTC.D?
Yes. BTC.D, BTC dominance and the reversed phrase dominance btc all mean Bitcoin’s share of total crypto market cap. BTC.D is the TradingView ticker, listed as CRYPTOCAP:BTC.D.
Does falling bitcoin dominance always mean altseason?
No. It needs a rising total market cap and broad altcoin gains. In the second quarter of 2026, dominance and total market cap fell together, which signalled broad weakness rather than altseason.