
icon icon Home
icon icon Accounts
icon icon Quick start
icon icon Symbols

Covered Call ETF vs Dividend ETF: High Yield vs Long-Term Growth, and Why “Yield” Is Not “Return”

Author
Abe Cofnas
Abe Cofnas
calendar Last update: 16 October 2026
watch Reading time: 10 min

The covered call ETF vs dividend ETF choice comes down to where the income is made. A covered call ETF sells call options on the shares or index it holds and pays out the premium, often 8% to 12% a year. A dividend ETF passes on the dividends its companies pay, usually 2% to 4%, and keeps all the upside.

It matters now because money is flooding into the high-yield side: Morningstar data cited by First Trust in March 2026 show net assets in derivative income ETFs grew by $56 billion in 2025, after $33 billion in 2024. Yet Global X told holders that 100% of a July 2025 QYLD payout was return of capital, not income from the call options it sells.

This guide explains the buy-write mechanic and works through the month in which the cap bites. It then sets seven real funds side by side with issuer figures from autumn 2026 and covers NAV erosion, tax, suitability and the honest limits of both.

bookmark
Key Takeaways
  • A covered call ETF sells call options on its holdings and distributes the premium: QYLD's trailing 12-month distribution was 12.10% and XYLD's 10.91% on the Global X fund pages in early October 2026.
  • A dividend ETF passes on company dividends and keeps full upside: SCHD's 30-day SEC yield was 3.39% on 30 September 2026 and SPYD's 4.70% on 1 October 2026.
  • The sold call caps gains. In a month where the index rises 8%, a buy-write with a 2% strike and a 1% premium makes 3%; in a flat month it makes 1% while the index makes nothing.
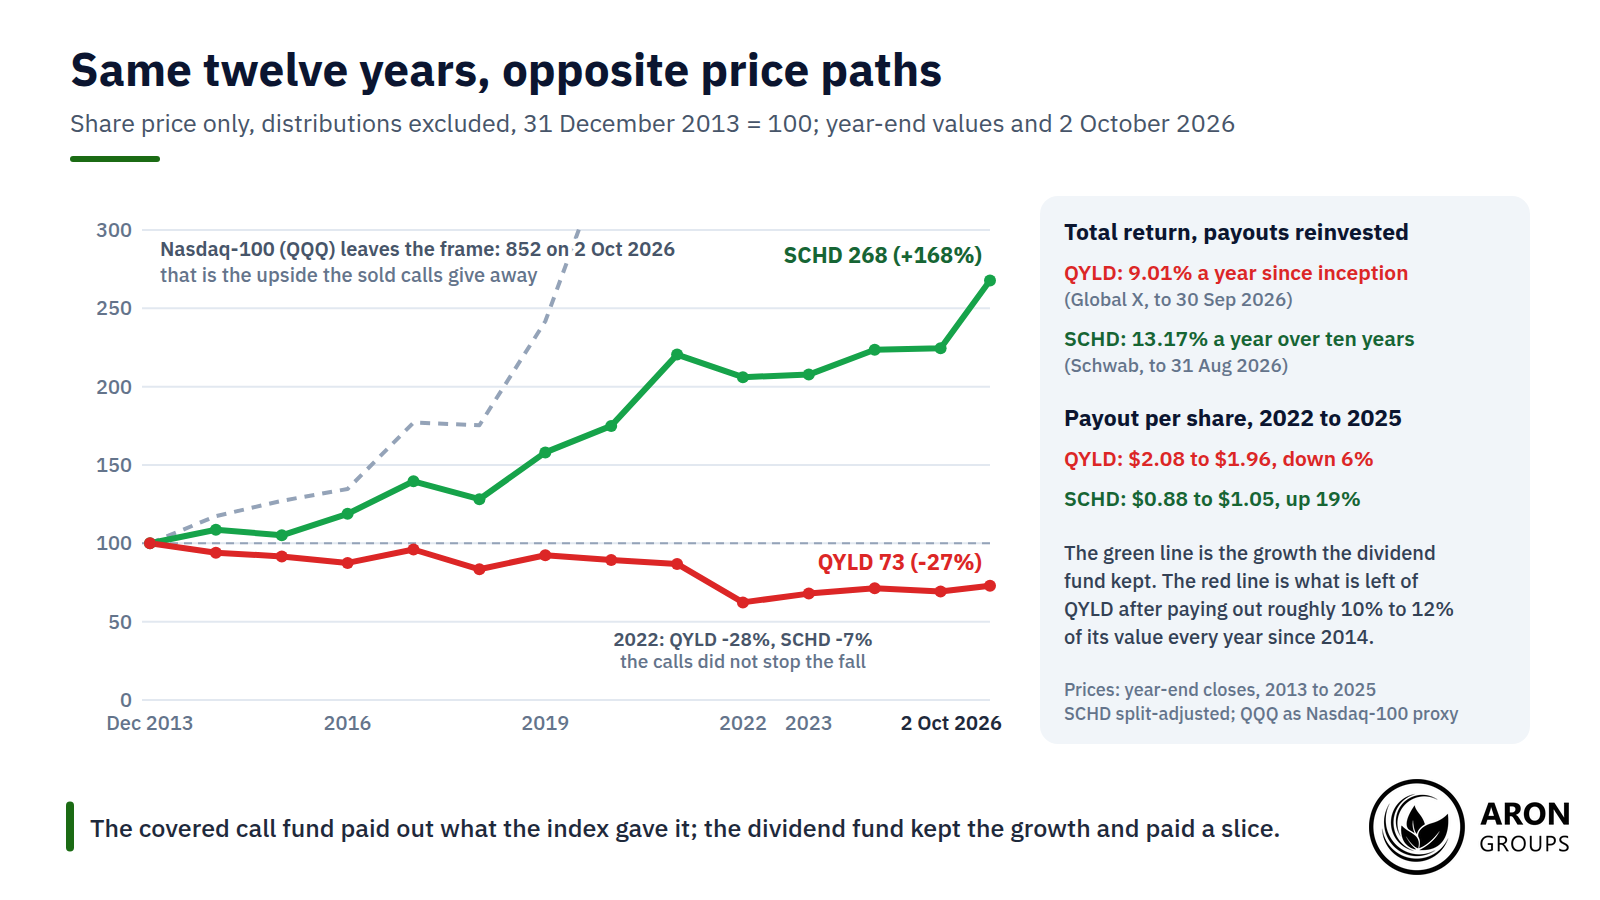
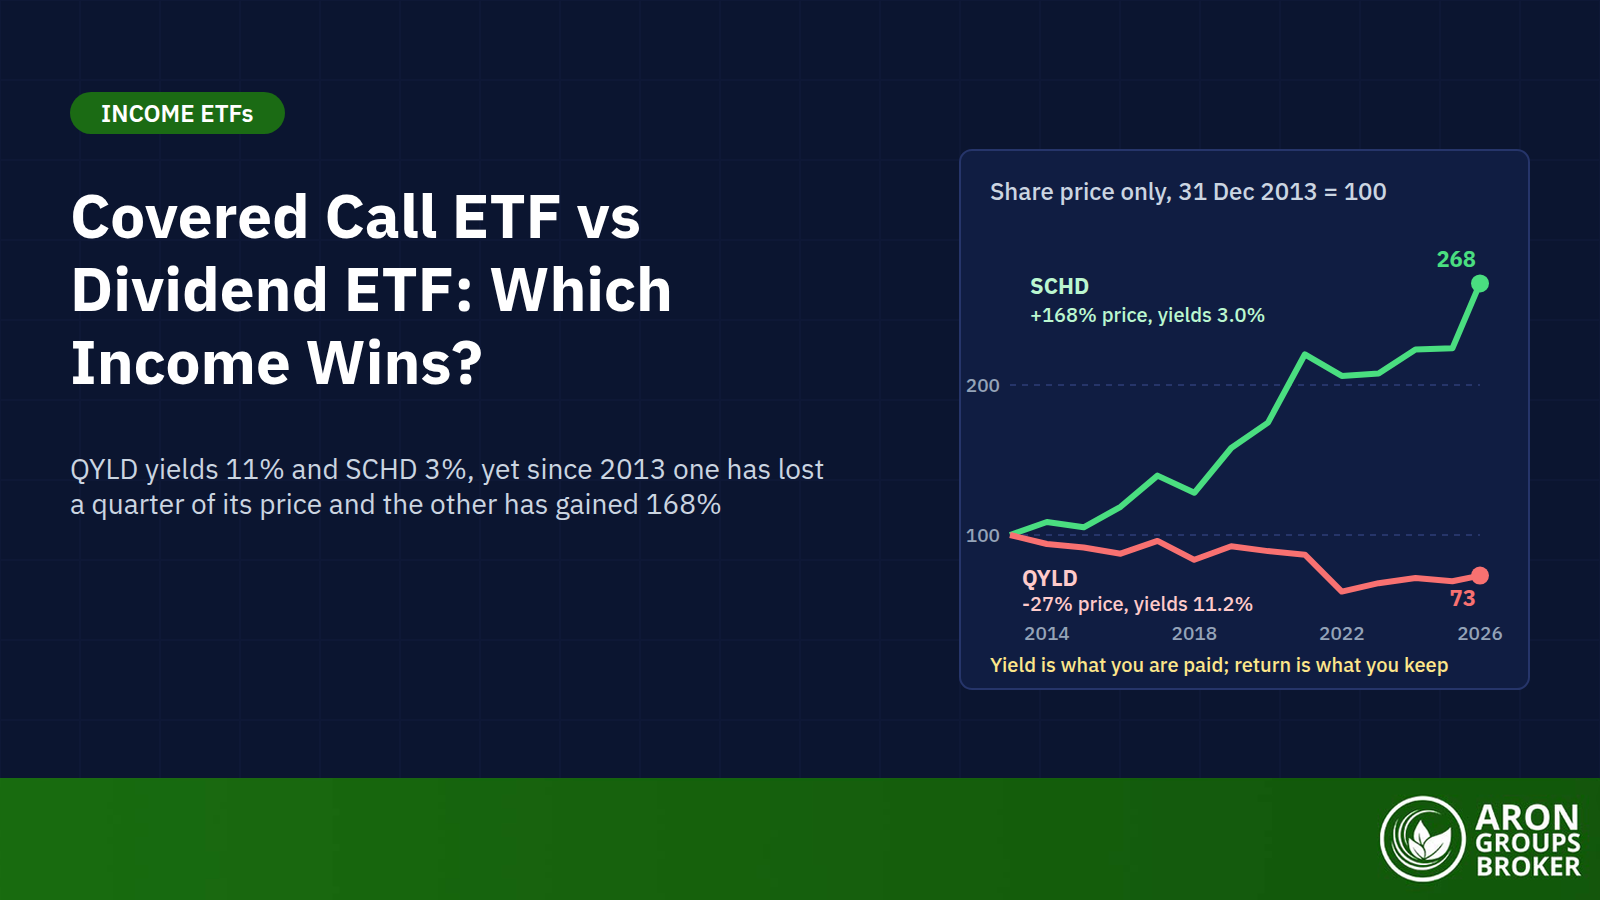
  • From 31 December 2013 to 2 October 2026 QYLD's share price fell 27% while SCHD's rose 168%; with payouts reinvested QYLD returned 9.01% a year since inception and SCHD 13.17% a year over ten years.
  • Global X estimated 100% of QYLD's July 2025 payout and 90.4% of XYLD's June 2026 payout as return of capital, and the SEC's August 2026 bulletin says to judge a fund by total return and SEC yield.

What Is a Covered Call ETF?

A covered call ETF is an exchange-traded fund that holds shares, or tracks a stock index, and sells call options against them every month. The option buyer pays a premium up front for the right to buy the index at a set price, the strike. The fund keeps the premium and pays it out, which is why the yields are so high.

sms-star

Risk Disclosure
Trading forex and CFDs carries a high level of risk and can result in the loss of all your capital. This content is educational and is not investment advice. Never risk money you cannot afford to lose.
How the buy-write works month by month

Selling a call creates an obligation, not a right. The SEC’s investor bulletin on options puts it plainly: the seller of a call is obligated to sell the shares to the buyer who exercises on or before expiry. QYLD writes one-month calls on the Nasdaq-100 at the money, meaning at the current index level, on 100% of its portfolio.

If the index ends the month below the strike, the calls expire worthless and the fund keeps the premium. If it ends above, the calls gain intrinsic value and the fund pays that gain to the buyer, which cancels the rise in its own shares. Then it sells fresh calls at the new level.

The three funds everyone compares

QYLD and XYLD, both from Global X, track the Cboe Nasdaq-100 BuyWrite V2 and S&P 500 BuyWrite indices at 0.60% a year. JEPI, from JPMorgan, is actively managed: it holds about 135 large-cap stocks and books its option income through equity-linked notes, at 0.35%, and held $46.16 billion on 31 August 2026. None of the three is available through Aron Groups.

The Cap: Why a Covered Call ETF Lags in a Strong Bull Market

The premium is the price the buyer pays for the fund’s upside above the strike. QYLD’s summary prospectus of 1 March 2026 says the fund gives up the opportunity to benefit from increases in the index above the exercise prices. It still bears the risk of declines. In a bull market the index keeps rising past the strike, and the fund keeps handing the difference away.

Mini Example: An 8% Month With a 2% Strike

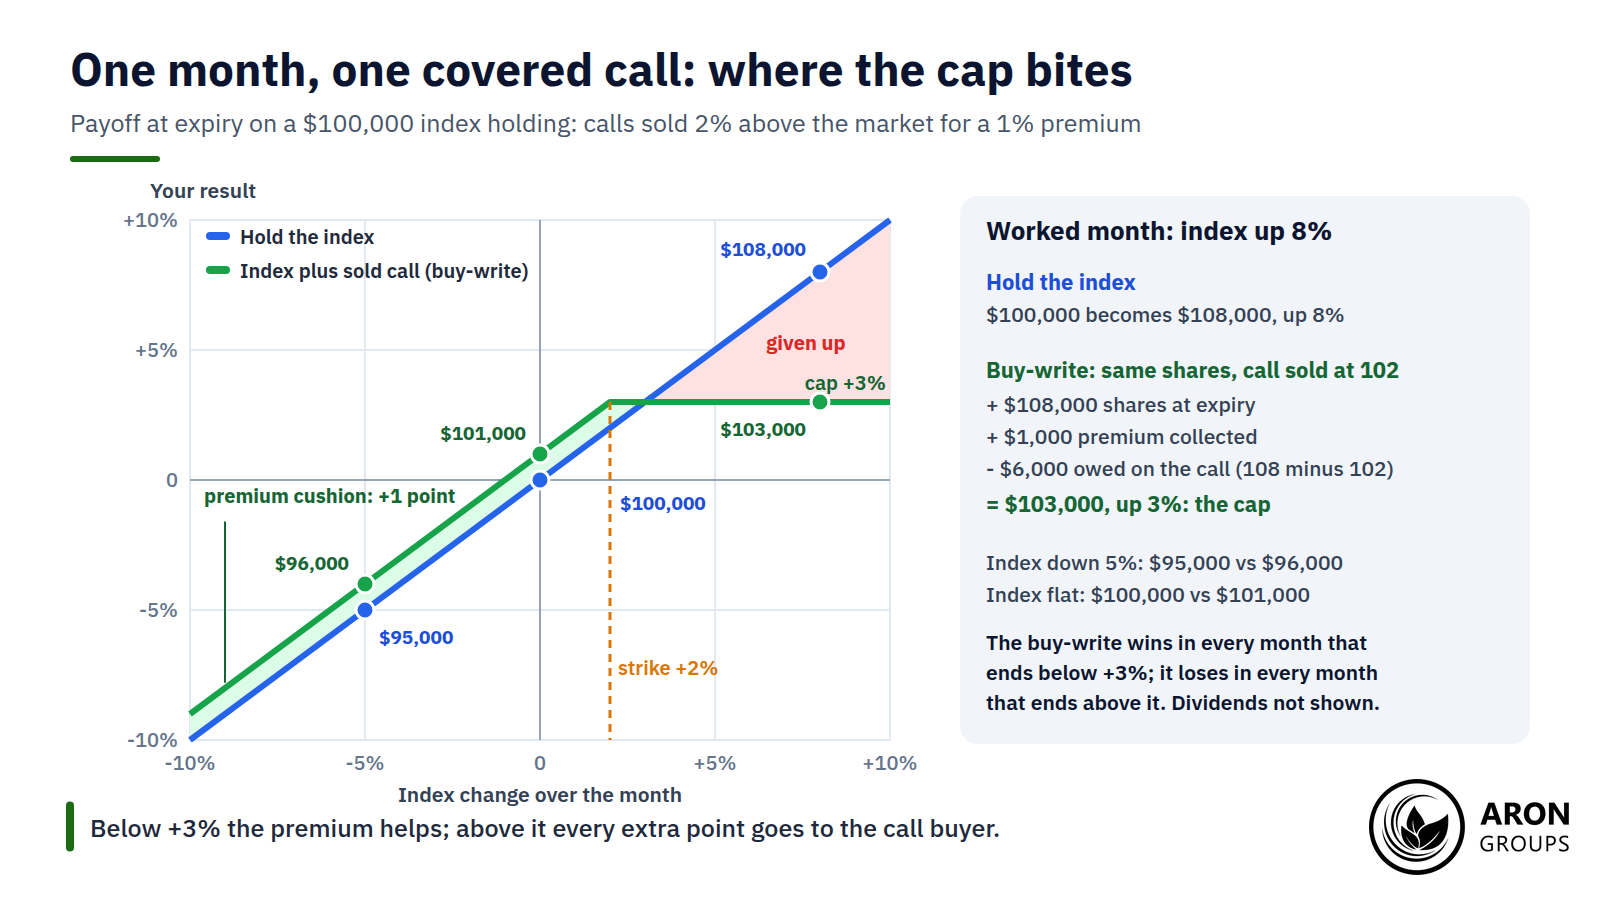
Say a fund holds $100,000 of an index and sells one-month calls struck 2% above the market, at 102, for a 1% premium, or $1,000. The index rises 8%, so the shares are worth $108,000. The calls are 6 points in the money and the fund owes the buyer $6,000 at settlement.

The fund finishes with $108,000 plus $1,000 minus $6,000, which is $103,000, a gain of 3% against 8% for a plain holding. The cap sits at strike plus premium. The buy-write wins in any month that ends below +3% and loses in any month that ends above it.

In a flat month the fund makes 1% while the index makes nothing; in a 5% fall it loses 4%. That one-point cushion is the whole of the downside protection.

Below a 3% monthly gain the premium cushions the fund; above it every extra point of the index goes to the option buyer.

What the long record shows

Index data make the same point over two decades. A March 2026 analysis of Cboe BuyWrite data tabled 21 calendar years to 2025. In all 14 years in which the S&P 500 gained 10% or more, the BuyWrite index trailed it; in 2025 the S&P 500 returned 17.86% against 8.91%. The strategy won in three of the four negative years and in all three years with gains between 0% and 10%.

What Is a Dividend ETF?

A dividend ETF holds companies that pay regular dividends and passes those payments to you, usually every quarter. It sells no options, so when its holdings rise the fund rises with them, and when a company raises its dividend the payout grows.

High-yield funds: VYM and SPYD

High-yield dividend ETFs rank stocks by yield and buy the top of the list. Vanguard’s VYM holds 605 stocks at 0.04%, with a trailing yield of about 2.4% in late September 2026. SPYD holds the 80 highest yielders in the S&P 500 at 0.07% and quoted a 30-day SEC yield of 4.70% on 1 October 2026. The extra yield brings a value tilt, so earnings season matters more.

Dividend-growth funds: SCHD and VIG

Dividend-growth ETFs screen for companies that have raised their payouts for years. Schwab’s SCHD tracks the Dow Jones U.S. Dividend 100 Index at 0.06% and held $108 billion on 1 October 2026; Vanguard’s VIG tracks the S&P U.S. Dividend Growers Index at 0.04% with a trailing yield near 1.6%. The payout starts low and rises: SCHD’s annual distribution went from $0.88 a share in 2022 to $1.05 in 2025, while QYLD’s fell from $2.08 to $1.96.

Covered Call ETF vs Dividend ETF: The Numbers Side by Side

The table puts both camps and a plain S&P 500 fund on one page, using each issuer’s own figures. The as-of dates differ by a few weeks, so compare the shape of the numbers rather than the second decimal.

Fund (strategy)Yield: trailing distribution / 30-day SECExpense ratio1-year total return5-year total return a yearReturns as of
QYLD (covered call, Nasdaq-100)12.10% / 0.02%0.60%22.94%9.33%30 Sep 2026
XYLD (covered call, S&P 500)10.91% / 0.48%0.60%17.57%8.25%30 Sep 2026
JEPI (covered call, active)8.04% / 7.44%0.35%7.77%7.47%30 Jun 2026
SPYD (high-yield dividend)4.53% / 4.70%0.07%15.37%8.91%31 Aug 2026
VYM (high-yield dividend)about 2.35% / not published0.04%21.52%11.78%30 Jun 2026
SCHD (dividend growth)3.00% / 3.39%0.06%29.45%10.01%31 Aug 2026
VIG (dividend growth)about 1.56% / not published0.04%17.53%10.90%30 Jun 2026
VOO (plain S&P 500)not an income fund0.03%22.28%13.36%30 Jun 2026

Issuer pages and fact sheets viewed on 3 October 2026; VYM and VIG trailing yields from market data of 2 October 2026. Returns are NAV with distributions reinvested.

Reading the table

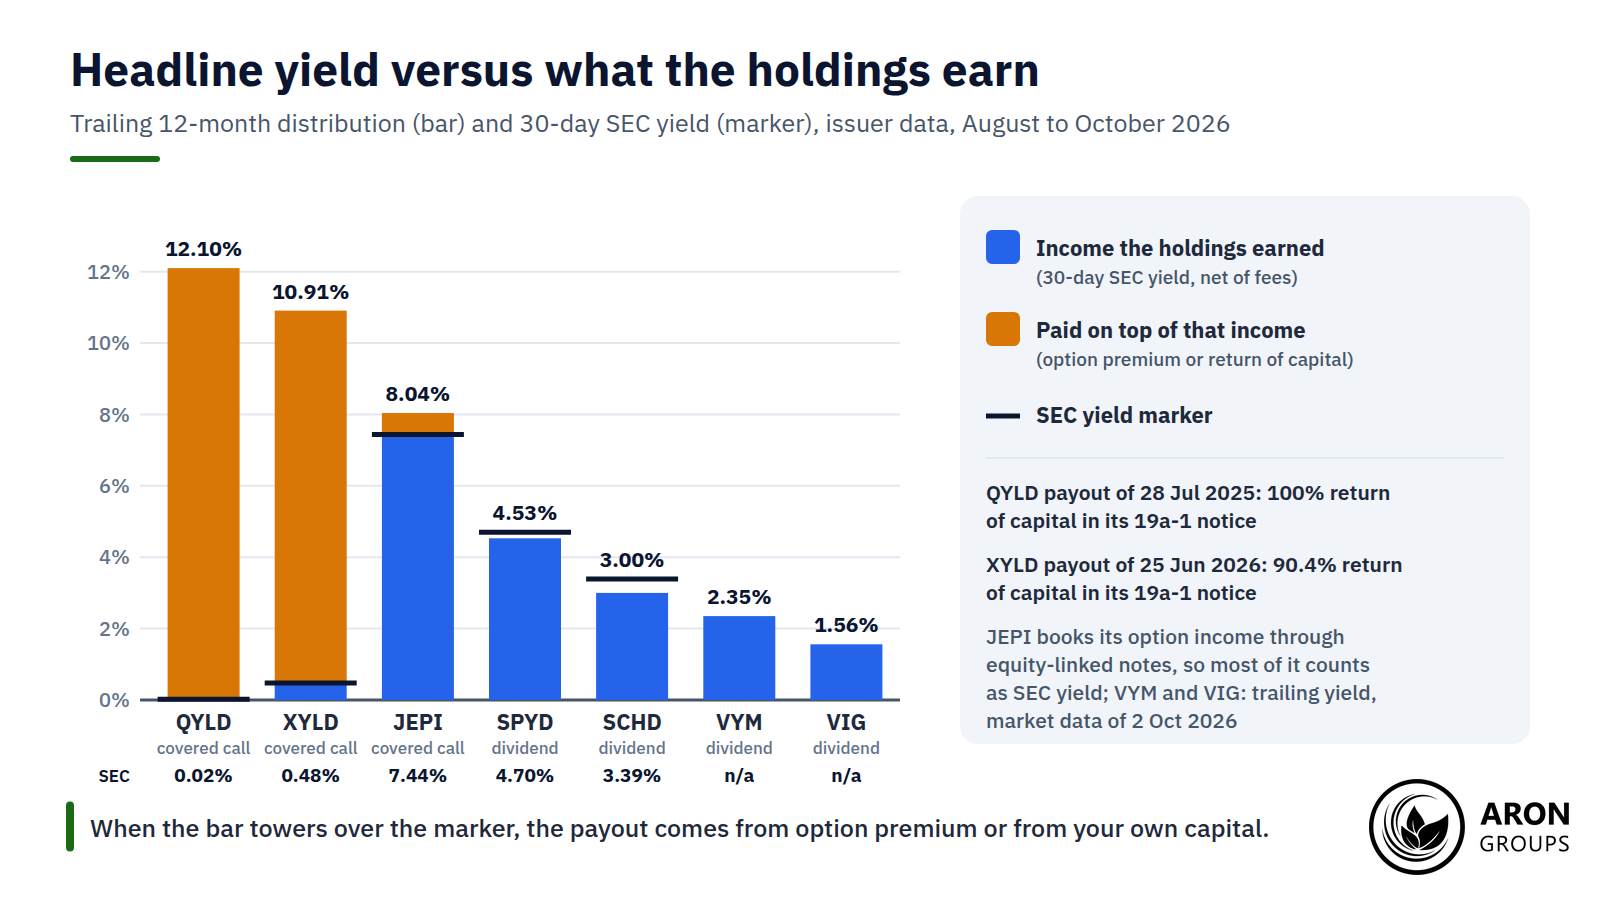
Two patterns stand out. The funds with the highest yields have the lowest SEC yields: QYLD paid 12.10% over the past year while its holdings earned 0.02% net of fees. Index option premium does not count as income in the SEC formula. And over five years three of the four dividend funds beat every covered call fund; only SPYD, at 8.91% a year, trailed QYLD’s 9.33%, and VOO beat them all at 13.36%.

JEPI is the cleanest like-for-like case because JPMorgan prints the S&P 500 beside it. To 30 June 2026 JEPI returned 7.77% over one year and 7.47% a year over five, against 22.32% and 13.41% for the index. Its one-year beta of 0.18 is what you buy instead: a far smoother ride.

When the distribution bar towers over the SEC yield marker, the payout comes from option premium or from your own capital.

NAV Erosion and Return of Capital

NAV erosion is the slow fall in a fund’s share price when it pays out more than it earns. QYLD ended 2013 at $25.54 and closed at $18.63 on 2 October 2026, a price fall of 27%, while the Nasdaq-100 proxy QQQ rose about 750%. The payouts were real, but a large part of them was the fund handing back its own capital.

The SEC’s investor bulletin on fund distributions, updated on 19 August 2026, defines return of capital as paying a distribution out of shareholder principal. It warns that regular returns of capital could be a sign the fund is paying more than it can afford. In its 19a-1 notices Global X put 100% of QYLD’s 28 July 2025 payout down to return of capital. For XYLD’s 25 June 2026 payout the figure was 90.42%.

Why the price falls even though the index rises

The mechanism is the cap plus the payout. In up months the sold calls cancel most of the gain, so the price barely rises. In down months the fund falls with the index, less the premium, and then the distribution leaves the fund. The 2022 drawdown shows the asymmetry: QYLD’s price fell 28% while SCHD’s fell 7%, because the calls were a hedge against only the first few points of each month’s fall.

Over the same twelve years and nine months the covered call fund paid out what the index gave it; the dividend fund kept the growth.

Monthly vs Quarterly Distributions and the Tax Question

Covered call ETFs pay monthly because the option cycle is monthly: QYLD’s $0.1767 a share, which went ex-dividend on 21 September 2026, was its ninth payment of the year. Most dividend ETFs pay quarterly, when their companies pay: SCHD’s $0.2665, ex-dividend on 23 September, was its third of 2026. Smoother cash flow is a convenience, not a return.

Qualified dividends versus option premium

The tax treatment differs at a high level, and none of this is tax advice. For US taxpayers, qualified dividends are taxed at long-term capital gains rates, which are lower than ordinary income rates. Income a fund earns from option premium, including JEPI’s note coupons, is generally taxed as ordinary income. Return of capital is not taxed when received but reduces your cost basis, so it raises the gain when you sell.

What reaches you depends on how the fund characterises each distribution on its year-end tax form, and non-resident investors face US withholding tax at treaty-dependent rates. Inside a tax-deferred account the comparison reverts to total return.

Q: Is a 12% distribution rate sustainable?
A: Only in a market that hands the fund enough premium every month and does not take it back in a fall. Global X caps QYLD’s monthly payout at the lower of half the premium received or 1% of NAV, which comes to roughly 12% a year, and the other half of the premium is meant to cover the down months. The 19a-1 notices show it often does not, which is why the payout has been partly capital and why the share price has drifted lower since 2013.

Which Fits Whom: Covered Call ETF vs Dividend ETF

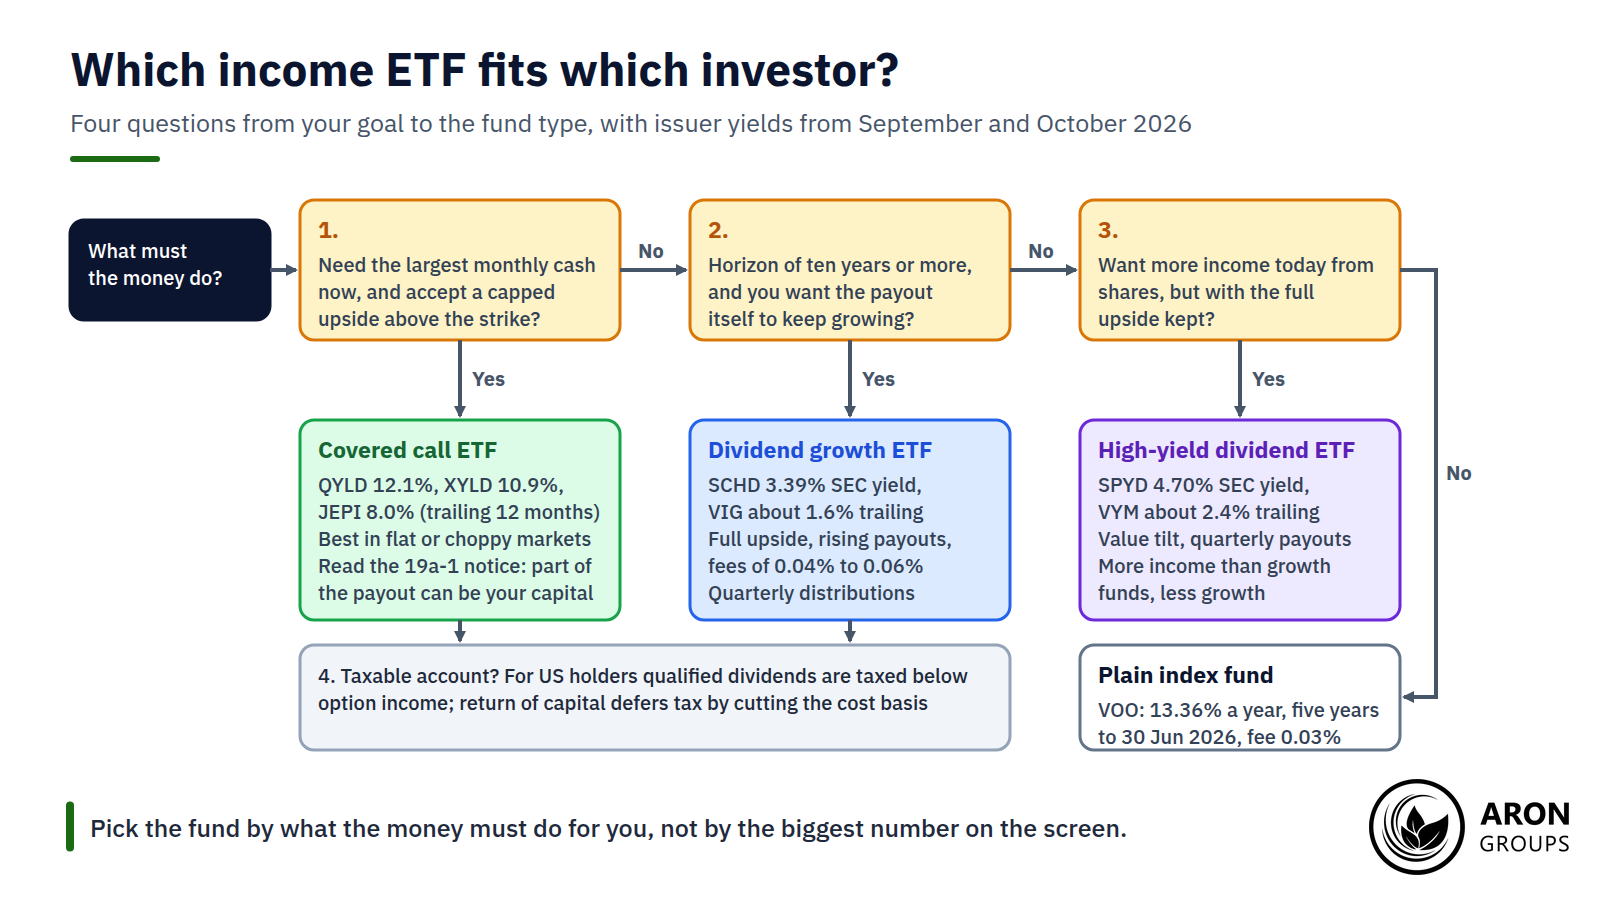
The right fund follows from what the money must do. Someone who needs the largest monthly cheque now, and accepts a capped upside, is the covered call investor. Someone who can wait ten years and wants the payout itself to grow is the dividend-growth investor. Someone in between picks SPYD or VYM.

Four questions sort the funds: the largest cash now points to a covered call ETF, a long horizon with growing income to a dividend-growth ETF.

Flat or sideways markets favour the covered call

A buy-write earns its keep when the index drifts. In a year of small up and down months the premium is collected twelve times and rarely given back. That is how the BuyWrite index beat the S&P 500 by 2.83 percentage points in 2026 to 20 March. Nobody can forecast a sideways year, so treat the fund as an income sleeve, not a market call.

Long-term growth favours the dividend ETF

Over any period that contains a strong rally the dividend fund pulls ahead, because it keeps the rally. SCHD returned 13.17% a year over the ten years to 31 August 2026 and VIG 13.13% to 30 June. QYLD made 10.03% and XYLD 8.49% to 30 September. At those rates $10,000 becomes about $34,500 in SCHD and $26,000 in QYLD over a decade.

sms-star

Key Point
Judge an income ETF by total return and 30-day SEC yield, the two measures the SEC's August 2026 bulletin points to. The distribution rate tells you what a fund pays, not what it earns, and the gap between the two is the capital you are being handed back.


The Honest Limits of Covered Call ETFs and Dividend ETFs

A covered call ETF has three limits the yield hides. The premium shrinks when volatility is low, so the income is not fixed. The strategy trails the index in every strong year on record and protects against nothing beyond one month’s premium in a crash, as 2022 showed. And 0.60% is a high fee for an index product, against 0.03% for VOO.

A dividend ETF has limits of its own. A 3% yield cannot fund a retirement on a small portfolio, and dividends get cut in recessions. Dividend funds tilt towards value sectors such as energy, financials and consumer staples, so they trail in technology-led rallies: SCHD returned 4.3% in 2025 while the S&P 500 made 17.86%. Modern portfolio theory would add that each is a different slice of the same market risk, not a free lunch.

The figures here carry as-of dates between 30 June and 2 October 2026 and will have moved. Platform access to US-listed ETFs varies by country, and users in restricted regions face added legal, access and custody risk.

Where Aron Groups Fits

Aron Groups does not offer ETFs or options, so neither type of fund trades on its platform. What it does offer is index CFDs and share CFDs on MetaTrader 5. These give exposure to the same Nasdaq-100 and S&P 500 moves without the wrapper or the cap. Its terms state that corporate actions on share and index CFDs, including dividend payments, may be reflected as account adjustments that depend on the position’s direction. Check the current terms before counting on dividend income from a CFD.

Holding a CFD overnight normally costs a swap, the CFD equivalent of the fee and financing drag inside an income fund. The Islamic ECN account is commission-free and interest-free, and its page lists swap-free holding periods by instrument, so check long holds against those terms. A demo account lets you watch an index position through a few monthly expiries first, and the lesson of this article applies there too: measure a position by what it returns after costs, not by what it pays.

Conclusion

The covered call ETF vs dividend ETF decision is about which half of the market’s return you want. A covered call ETF converts the upside into monthly premium and pays it out. That produced yields of 8% to 12% in 2026 and total returns well below the index. A dividend ETF keeps the upside and pays a growing 2% to 4% slice of it.

The record since 2013 is the clearest evidence: QYLD paid out faithfully and its share price fell 27%, while SCHD paid less, its price rose 168% and its payout grew. The 19a-1 notices explain the gap: much of the high yield was capital coming back.

Whichever side fits your goal, score it by total return and SEC yield rather than the distribution rate. The biggest number on the screen is the one that tells you least.

Frequently Asked Questions

Short answers to common questions about covered call ETFs and dividend ETFs.

Is a covered call ETF better than a dividend ETF?

Neither wins in every market. A covered call ETF pays far more now but caps gains; it trailed the index in every strong year of a 21-year table to 2025. A dividend ETF pays less and keeps the growth, and over five years to mid-2026 SCHD and VIG beat every covered call fund on total return.

Why does QYLD lose value over time?

QYLD sells at-the-money calls, so up months are capped at the premium while falls are cushioned only by that premium. It then pays out up to 1% of NAV a month, much of it estimated as return of capital. Its share price has fallen 27% since the end of 2013 while the Nasdaq-100 rose about 750%.

Is JEPI a dividend ETF?

No. JEPI holds dividend-paying large caps, but most of its 8.04% yield comes from option premium earned through equity-linked notes. That is why its 30-day SEC yield was 7.44% on 31 August 2026. It is an actively managed covered call fund.

Which is better in a sideways market?

The covered call ETF. When the index ends most months near where it started, the fund keeps the premium each time. A dividend fund earns only its 2% to 4%. In a 21-year table to 2025 the Cboe BuyWrite index beat the S&P 500 in every year with gains between 0% and 10%.

Continue Reading
not-found
calendar 16 October 2026
Rate this article

Leave a Reply

Your email address will not be published. Required fields are marked *

No thanks