The week opening gap reveals how Smart Money re-prices risk after the weekend, creating a short-lived inefficiency in price delivery across Forex, indices, and futures. Understanding the importance of NWOG is crucial, as it helps traders identify key support and resistance levels and provides insight into overall market structure.
Many traders observe this gap on their MT5 charts but misinterpret it as noise instead of recognising a structural shift in order flow.
The NWOG gap serves as a reference point to understand where large financial institutions may be adding liquidity. Analysing NWOG also helps traders interpret market behaviour, particularly the distinction between institutional and retail actions during the market open and the subsequent price stabilisation.
Proponents of ICT believe that institutional algorithms refer back to these gaps to rebalance price to a “fair value” level.
This article covers definition, market structure context, identification, consequent encroachment, bullish and bearish models, and practical execution guidelines.
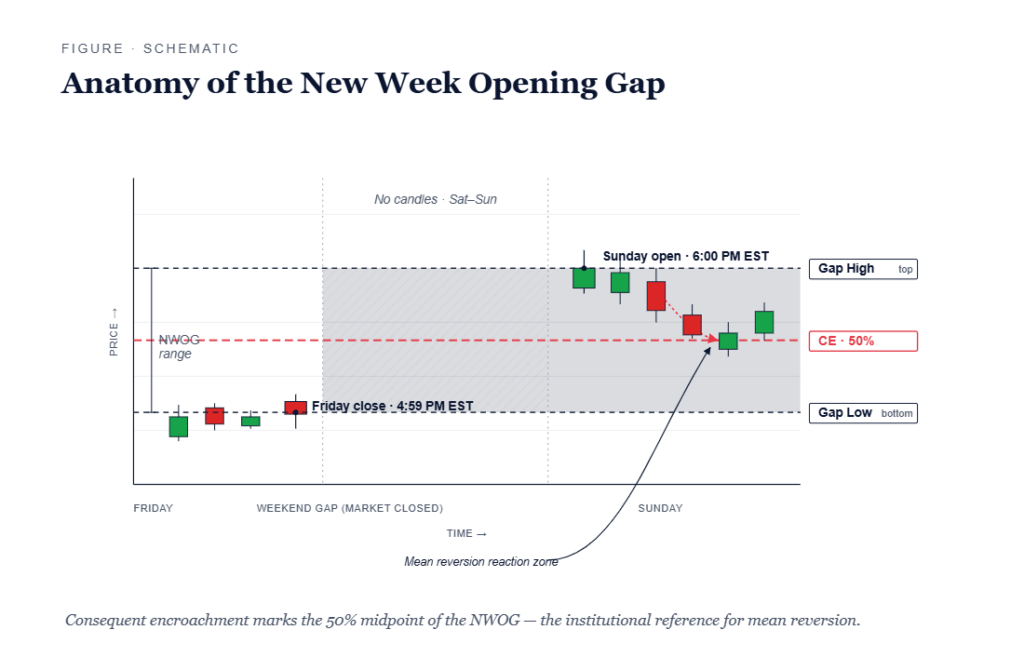
- The New Week Opening Gap (NWOG) is the price difference between Friday’s closing price at 4:59 PM EST and Sunday’s opening price at 6:00 PM EST, and its importance lies in identifying key support and resistance levels, as well as liquidity zones that can influence price action at the start of the week.
- ICT traders treat NWOG as an institutional price delivery imbalance that is frequently revisited to rebalance liquidity, particularly around consequent encroachment (the 50% level of the gap). The NWOG indicator can be used to visualise these gaps for strategic trading decisions.
- NWOG must be analysed within the context of market structure, higher-timeframe bias, and liquidity pools; it is not a standalone signal. Trading strategies can be built around price interactions with NWOG, and understanding NWOG is crucial for interpreting market structure.
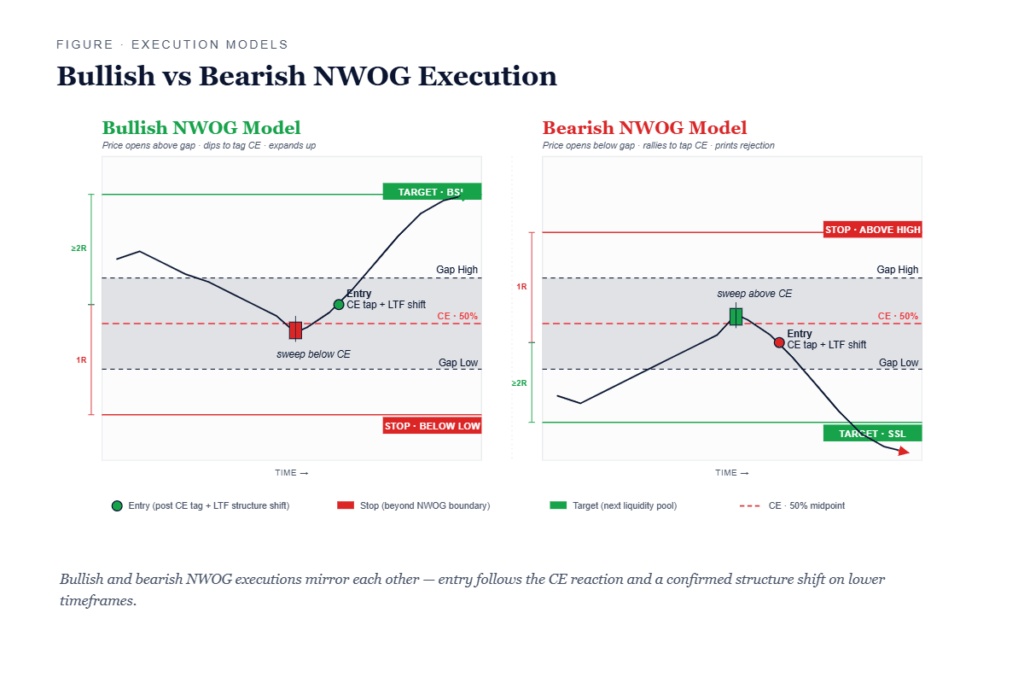
- Execution refines on lower timeframes (M15–M1) using ICT concepts like market structure shift and liquidity sweeps.
- There is no obligation for price to fully fill the gap; risk management and scenario planning remain essential. NWOG analysis is an important strategy for traders.
Definition and Mechanics of the New Week Opening Gap (NWOG)
The New Week Opening Gap occurs between the closing price on Friday at 4:59 PM EST and the opening price on Sunday at 6:00 PM EST, resulting from the market being closed over the weekend. This price gap represents the exact price difference between these two levels.
NWOG is considered a liquidity void because no trading occurs during the weekend, and price often retraces to fill this gap to achieve fair market value. In ICT terms, this gap behaves similarly to a higher-timeframe Fair Value Gap (FVG), often attracting price back into the range as the market rebalances.
For readers still establishing the fundamentals, a refresher on how to trade forex makes the gap concept easier to apply.
Its defining characteristics can be summarised at a glance:
- Formation Window: Friday 4:59 PM EST to Sunday 6:00 PM EST
- Classification: Liquidity void / Price inefficiency
- Typical Behaviour: Mean reversion towards gap or CE
- ICT Analogue: Weekly-scale Fair Value Gap
Risk Disclosure
CFDs are complex instruments and come with a high risk of losing money rapidly due to leverage. You should consider whether you understand how CFDs work and whether you can afford to take the high risk of losing your money. Past performance is not indicative of future results. This content is provided for educational purposes only and does not constitute investment advice.
Why NWOG Forms: Order Flow and Weekend Information
The formation of NWOGs is influenced by external factors such as geopolitical events and macroeconomic data releases, which can significantly impact market sentiment and price behaviour at the start of the new week. Banks and funds adjust positions to weekend information via opening auction prices.
Concrete examples include the 2022 Russia-Ukraine escalation weekends where EURUSD gapped down 150+ pips, and March 2020 COVID headlines causing NAS100 gaps exceeding 5%. Resting orders accumulated without execution explode into market-on-open volume, displacing price directionally.
Q: Do we treat every tiny price difference between Friday close and Monday open as tradeable?
A: While any difference is technically a gap, institutional-grade nwog analysis focuses on gaps that displace price away from prior liquidity or significantly influence early-week market structure. Filter gaps under 10-20 pips on major pairs relative to weekly ATR; context determines whether the NWOG is operational.
Identifying NWOG and NDOG on the Chart
To identify an ICT New Week Opening Gap, traders must mark Friday’s closing price at 4:59 PM EST and Sunday’s opening price at 6:00 PM EST, with the gap representing the difference between these two prices. Draw a box from low to high of these levels.
Indicator tools can automate the marking of NWOG gaps, allowing traders to visualise areas of market inefficiency. The NWOG indicator is specifically designed to help traders identify and visualise price gaps at the start of the new week, making it easier to detect potential support and resistance zones.
Adjust for broker server times on MT5 (some show 5 daily candles, others 6). The New Day Opening Gap (NDOG) follows similar logic for daily transitions.
The two gap types differ in scale and behaviour:
- NWOG: Weekly timeframe, 30-150 pips, 70-80% partial fill tendency
- NDOG: Daily timeframe, 10-50 pips, 60-75% fill tendency
Recurring boxes for these levels can be saved inside the MetaTrader 5 toolbox so the markings persist across sessions.
Q: On which timeframe should I draw NWOG for best precision?
A: Use H4 for clean visualisation of the Friday-to-Sunday transition, then refine on M15 for pip-exact consequent encroachment. The exact candle open/close prices matter; zoom in to avoid rounding errors on indices.
NWOG, Market Structure, and Liquidity Context
Traders view NWOG areas as significant zones of support and resistance, where price may bounce off or pass through. The importance of NWOG lies in its ability to help traders identify key support and resistance levels, liquidity zones, and to aid in market prediction, making it a crucial element in ICT analysis and trading strategies.
The gap must be read within existing weekly and daily market structure: trend direction, swing highs/lows, and visible pools of liquidity. Specific strategies can be developed based on price interactions with NWOG levels, influencing both market entry and reversal decisions during bearish and bullish scenarios.
| NWOG Position vs. Prior Week | Institutional Intent | Common Response |
|---|---|---|
| Above Prior Week High | Buy liquidity grab | Retrace to CE, then higher |
| Inside Prior Week Range | Balance test | Range expansion or fill |
| Below Prior Week Low | Sell stops hunted | Rally to CE resistance |
Q: Why does price frequently revisit the new week opening gap?
A: The NWOG is often referred to as a liquidity void because no trading occurs over the weekend, and price tends to retest and fill these gaps to achieve fair value. This revisit is probabilistic; some weeks leave gaps unfilled for extended periods.
Consequent Encroachment (CE) of NWOG
Consequent encroachment represents the 50% level of the gap range, treated as a crucial reaction point. Traders can use the Fibonacci tool to measure this, marking the 50% retracement level as a reactive price point within the gap.
Did You Know? Using the 50% level of the NWOG as a potential entry point can lead to high probability trades, as this level often acts as a significant reaction point for price movements. Historical backtests show 60%+ price stabilisation at CE.
Read the fill behaviour through both directional lenses:
- Full Gap Fill , bullish: Weak support, continuation; bearish: Weak resistance, continuation
- Partial to CE , bullish: Strong reaction zone; bearish: High-prob reversal
- No Revisit , bullish: Displacement mode; bearish: Trend acceleration
Q: Q: Should I prioritise the 50% CE level over the exact boundaries?
A: A: Both matter. The edges define the liquidity void as key support and resistance levels, while CE marks the mean reversion point. Backtest both behaviours on major FX pairs using 1-2 years of weekly data.
Rule: Treat consequent encroachment as a reaction zone, not a guaranteed reversal. |
Bullish NWOG Scenarios and Execution Models
Price behaviour around NWOGs can indicate market direction; if the price is above the NWOG, it may act as a support level. A bullish nwog typically shows the market open above Friday’s close in alignment with an existing uptrend.
In bullish scenarios, if the price is above the New Week Opening Gap, traders should wait for a retracement to the NWOG and look for confirmation of a reversal before executing a buy trade targeting the next liquidity level. Traders may look for long trades when price confirms support by closing above the NWOG, using this as an entry point for buying opportunities.
Stops commonly sit beyond the NWOG low.
Mini Example: Price Above NWOG, Retrace to CE, Then Expansion (text-only scenario)
The new week opens above Friday close. Price rallies briefly, then retraces into the gap and tags CE.
On M15, a bullish market structure shift forms after sweeping short-term sell-side liquidity. Enter on retracement of that displacement, stop below the local low, target higher-timeframe buy-side liquidity.
Q: Q: What signals indicate a bullish gap is failing?
A: A: Clean acceptance below the NWOG low, multiple lower-timeframe price breaks to the downside, and failure to reclaim CE after revisit. The gap then flips from potential support to active resistance zones.
Bearish NWOG Scenarios and Execution Models
For bearish scenarios, if the price is below the NWOG, traders should wait for a retracement to the NWOG and look for bearish confirmation before executing a sell trade targeting the next liquidity level. The gap top becomes weekly resistance.
Common downside objectives include prior week’s low, equal lows on the daily timeframe, or deeper liquidity pools below multi-week swing lows.
Example Model: Price Below NWOG, Retrace Into Gap, Rejection Lower
The market open gaps below prior support. Price trades higher into the gap, taps CE, then prints a sharp bearish rejection candle on H1.
Liquidity above a short-term high inside the gap is swept before decisive bearish displacement, signaling Smart Money selling pressure at a premium.
Q: Q: Does a downside gap automatically mean weekly trends point lower?
A: A: No. A gap down into longstanding higher-timeframe support can fuel bullish reversal as trapped shorts cover. Always tie analysis to broader market structure and macro context.
NWOG vs NDOG: Multi-Timeframe Gap Framework
NWOG and daily gaps form a hierarchy: weekly gaps carry medium-term directional information, while NDOG refines intraday and short-term liquidity flow. Both function as liquidity voids but differ in reliability and macro sensitivity.
| Aspect | NWOG | NDOG |
|---|---|---|
| Time Horizon | Medium-term bias | Intraday/short |
| Size Relative to ATR | 0.5-2x weekly | 0.2-0.8x daily |
| Fill Speed | 1-5 days | Hours to same day |
| Best ICT Use | Structural S/R anchor | Entry refinement |
Principles align, but NDOGs are more sensitive to fundamental news and microstructure noise. Require stronger confirmation and tighter risk.
NDOG works best subordinate to NWOG bias on multiple timeframes.
Lower Timeframes, Execution, and Resistance Levels Around NWOG
Drop from weekly context to lower timeframes (M15, M5) for precise entries where price interacts with gap edges or CE while sweeping liquidity. NWOG zones create dynamic resistance levels and support zones guiding price reactions.
Execution Checklist:
- Determine higher-timeframe market bias
- ark NWOG and CE on chart
- Map nearby liquidity pools
- Wait for liquidity sweep into gap
- Confirm market structure shift on lower timeframes
- Execute with defined stops and targets
Every entry on the checklist should carry a defined risk-to-reward target before the order is placed.
Trading Tip: Prioritise M15 and M5 for clarity of price action structure. Use M1 only with sufficient spread conditions and experience reading fast potential price movements.
Limitations, Risk Management, and Common Misconceptions
Not every NWOG will be fully filled; gaps can persist for weeks. Large weekend news creates sustained displacement with minimal retrace.
The market has no obligation to revisit gaps, and forcing counter-trend trades purely because a gap exists is hazardous.
These constraints make a disciplined risk management strategy non-negotiable rather than optional.
Risk Warning:
- Conservative leverage early in the new week
- Pre-defined invalidation beyond gap extremes
- Reduced position sizing during initial volatility
- Journal all nwog gaps with screenshots and macro notes
Q: Q: Is holding positions through the weekend advisable?
A: A: NWOG analysis is primarily for managing trades after the market open, not predicting weekend gaps. Holding introduces gap risk in both directions. Many institutional approaches flatten into Friday close to avoid unpredictable headline exposure.
Rule: The market has no obligation to fill a gap; trade the response, not the expectation. |
Conclusion
The New Week Opening Gap is most useful as a structural reference rather than a standalone trigger. Mark it precisely on MetaTrader 5, locate consequent encroachment, then let market structure and liquidity decide whether the gap acts as support, resistance, or a magnet for mean reversion.
Used this way, the gap helps you develop an edge that survives live conditions.
Edge comes from process, not prediction. Confirm a level through backtesting on your own instruments, track the results on an equity curve, and protect the downside before chasing the next liquidity target.