The TGIF setup represents one of the most structured end-of-week trading approaches within ICT methodology. This algorithmic trading model targets reversals after the weekly high or weekly low has been established, offering traders a repeatable framework for Friday sessions across forex pairs, indices, and gold CFDs.
This is not a generic Friday strategy. The TGIF model exists because Fridays carry a specific institutional behaviour that does not repeat midweek, and the setup is only valid when that behaviour prints cleanly.
This guide walks through the mechanics of the weekly range, the ICT concepts that frame the entry, the Fibonacci anchoring rules, the timing windows, and the risk controls that turn the model from a chart pattern into a repeatable Friday playbook.
- The ICT TGIF setup is a Friday-only liquidity model that exploits end-of-week reversals back into the weekly range using institutional order flow logic.
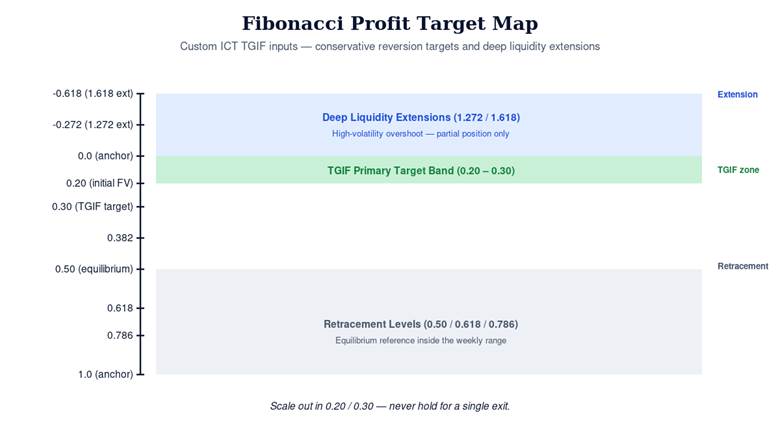
- Traders anchor Fibonacci tools to the current week’s high/low and use 0.20 and 0.30 levels, plus 1.272 and 1.618 extensions, as precise Friday profit targets.
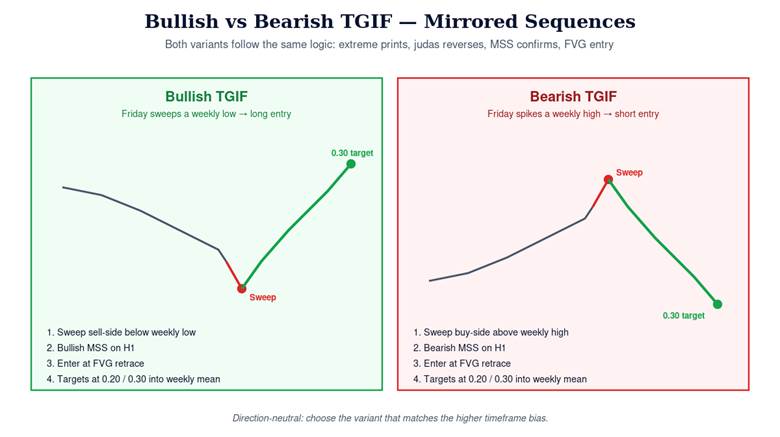
- Bullish TGIF setups seek long trades from a newly formed weekly low, while bearish TGIF setups seek short trades from a freshly formed weekly high.
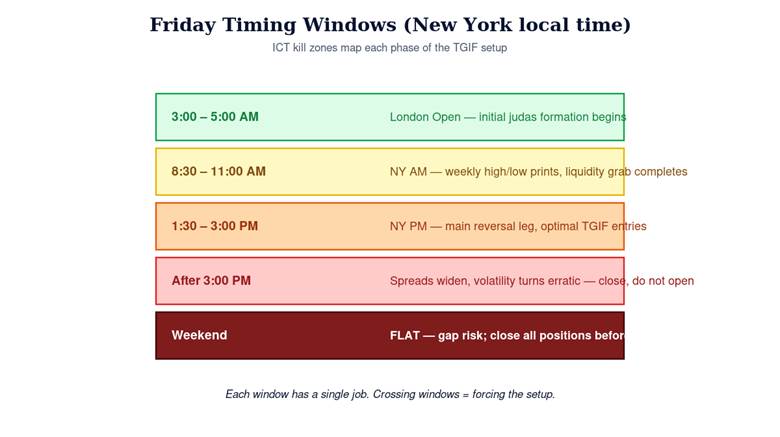
- Fair value gaps, market structure shifts, and ICT kill zones (especially the New York session) are critical for timing entries and exits.
- Strict risk management is essential, avoid low-volatility Fridays and never force trades when the weekly range and liquidity profile are weak.
Introduction to the ICT TGIF Setup
TGIF stands for “Thank God It’s Friday” and connects directly to how institutional desks rebalance positions and engage in Friday profit taking before the weekend. This behavior often drives price back toward a fair value weekly mean, creating predictable reversion opportunities.
The setup relies on three core technical tools: fair value gap identification, market structure shift confirmation, and fibonacci levels including the custom 0.20 and 0.30 targets that define realistic profit target zones.
Risk Disclosure
CFDs are complex instruments and come with a high risk of losing money rapidly due to leverage. You should consider whether you understand how CFDs work and whether you can afford to take the high risk of losing your money. Past performance is not indicative of future results. This content is provided for educational purposes only and does not constitute investment advice.
Why Fridays behave differently from midweek trading?
Several structural factors concentrate flow on Fridays. The bullets below capture the main drivers:
- Institutional profit taking accelerates as weekend exposure is reduced
- Weekly options expiry creates concentrated order flow
- Liquidity thins after the New York session peak
- Price tends to seek equilibrium within the weekly trading range
- The market’s tendency to form extremes early Friday and reverse by close creates the tgif trading opportunity
Understanding the TGIF Liquidity Model
The tgif trading setup functions as a weekly liquidity algorithm. The ICT TGIF setup is based on the tendency of the market to form a weekly high or low on Fridays, which often leads to a retracement back to the weekly trading range. Institutions first push price to create the week’s extreme, then reverse toward the weekly mean during Friday’s afternoon session.
The weekly range spans from Monday open through Thursday close, plus early Friday price action. This range frames premium zones (above equilibrium) and discount zones (below equilibrium) where fair value is rebalanced. In trending markets, this creates a clear framework for mean-reversion plays.
Key definitions for TGIF
Four anchor terms underpin every TGIF discussion that follows:
- Weekly high: The highest price from Monday open through Friday’s extreme
- Weekly low: The lowest price in the same period
- Weekly mean: The 50% level of the weekly range, representing equilibrium
- Return to fair value: The algorithmic pullback to fill imbalances after extremes are printed
In both bullish market and bearish market conditions, the ict tgif works as a reversion play after the trading week establishes directional bias.
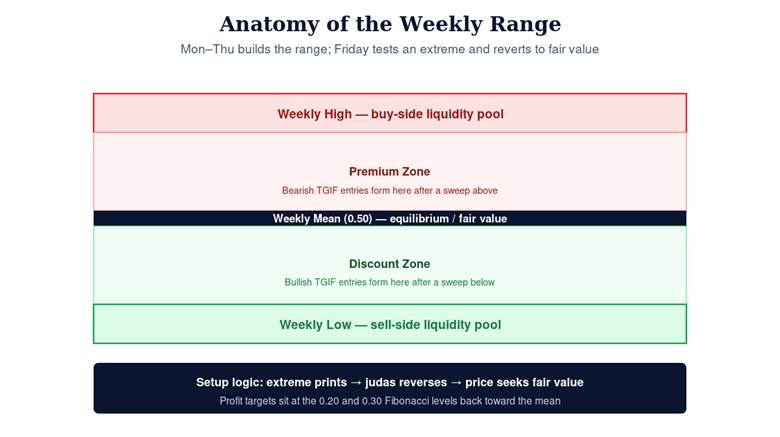
Rule: TGIF is a mean-reversion model. The setup only exists once the weekly extreme has printed and the market has a magnet to revert toward. |
Core ICT Concepts Behind the TGIF Setup
Several ict concepts underpin successful tgif trading strategy execution. Understanding these elements transforms the setup from theory into actionable trade entries.
ICT Judas Swing
A deliberate fake move that runs stops above prior highs or below prior lows on Friday. The ict judas swing formation typically occurs during the morning session, setting the weekly extreme before reversing. Traders practicing the ict judas swing wait for this manipulation to complete before entering.
Market Structure Shift (MSS)
A market structure shift occurs when the price breaks a key swing high or low, indicating a potential reversal and is a critical component of the TGIF setup. This displacement confirms the ICT judas leg has completed. Look for MSS on H1 charts after the Friday extreme prints.
Fair Value Gap (FVG)
Three-candle imbalances where aggressive moves leave unfilled price voids. These serve as ideal entry zones after MSS confirmation on 5-15 minute charts.
Liquidity Pools
Clusters at equal highs/lows, previous day’s high/low, and Monday-Thursday extremes that Friday’s manipulation targets.
ICT Kill Zones
London open (3:00-5:00 AM New York local time), New York AM (8:30-11:00 AM), and New York PM (1:30-3:00 PM york time) sessions where institutional activity concentrates.
Fibonacci Settings and Inputs for the TGIF Setup
The tgif setup uses specific fibonacci settings that differ from standard retail configurations. Fibonacci retracement levels of 0.20 and 0.30 are commonly used as profit targets in the ICT TGIF trading setup, alongside classic levels.
Recommended fibonacci inputs for MT5
Apply the following levels in your MT5 Fibonacci tool when anchoring a TGIF setup:
- 0.0 (swing low/high anchor)
- 0.20 (Weekly Fair Value Initial)
- 0.30 (Secondary Target)
- 0.382
- 0.50 (Equilibrium)
- 0.618
- 0.786
- 1.0 (swing high/low anchor)
- 1.272 (Liquidity Extension)
- 1.618 (Deep Extension)
The 0.20 and 0.30 levels serve as conservative Friday targets when trading back into the weekly range. Retracement levels project pullbacks within the range, while expansion levels (1.272, 1.618) forecast where price might overshoot into deeper liquidity.
The automatic Fibonacci indicator can help traders quickly identify retracement levels based on key Fibonacci ratios, enhancing the accuracy of the TGIF setup.
How to Draw Fibonacci Levels for TGIF (Step-by-Step)
Proper anchoring of the fibonacci tool determines whether your profit target plot fibonacci levels align with actual market behavior.
- Step 1: On the weekly chart, identify the complete Monday-Thursday range plus early Friday extremes. To set Fibonacci levels for a bullish TGIF setup, traders should draw from the weekly low to the weekly high, while for a bearish setup, they should draw from the weekly high to the weekly low.
- Step 2: Confirm higher timeframe direction on D1 or H4. Even though TGIF is mean-reversion within the weekly candle, trades should align with the primary trend to avoid fighting institutional bias.
- Step 3: Drop to lower timeframe charts (M15 or M5) to apply precise Fibonacci tools on the ict judas leg. This provides optimal levels for entry refinement.
Common anchoring mistakes to avoid
Three repeated errors invalidate otherwise valid Fibonacci anchors:
- Using incomplete intraweek swings (e.g., Tuesday-only highs)
- Ignoring H4/D1 bias when forcing counter-trend setups
- Anchoring before the Friday extreme has printed
Friday Timing, Sessions, and ICT Kill Zones
The TGIF setup is highly dependent on timing, liquidity behavior, and the weekly market structure, delivering optimal performance only under specific conditions. Fridays concentrate unique flows: weekly profit-taking, options hedging, and institutional rebalancing.
Traders using the TGIF setup should identify the weekly high or low, which is often formed between the morning session and afternoon session on Fridays, particularly around 1:30 PM to 2:00 PM New York time.
Critical timing windows (New York local time)
Three intraday kill zones structure the entire Friday session:
During the afternoon session wait for MSS confirmation before executing. Avoid trading after 3:00 PM when spreads widen and volatility becomes erratic.
For traders using Aron Groups Broker, focus on liquid pairs like EURUSD or XAUUSD during these windows in the york session.
Q: What happens if the weekly extreme prints outside the New York AM window?
A: If the extreme prints during London or in the early Asian session, treat the setup with extra caution — the reversal leg may unfold across thinner liquidity, and the standard 1:30 PM reversal pattern is less reliable. Wait for MSS confirmation on H1 before sizing the trade.
Step-by-Step TGIF Execution Blueprint
This chronological checklist transforms the trading model into an actionable playbook:
- Thursday EOD: Assess weekly bias, confirm weekly range exceeds 1.5% for majors
- Friday Pre-London: Plot Monday-Thursday high/low and mark key liquidity pools
- London/NY AM: Monitor for ict judas swing creating week high or reversing downward to form lows
- Post-Grab: Confirm market structure shift point on H1 (bearish MSS after high sweep, bullish after low sweep)
- Locate Entry: Find fair value gap or order block on M5-M15 in reversal direction
- Fibonacci Alignment: Verify entry zone aligns with optimal levels
- Execute: Enter via limit order inside FVG, stop loss beyond swept liquidity
- Manage: Partial take profit at nearest liquidity pool, main targets at 0.20 and 0.30 fibonacci levels
Skip conditions: No clear judas move, narrow range (<1%), or news-disrupted Friday.
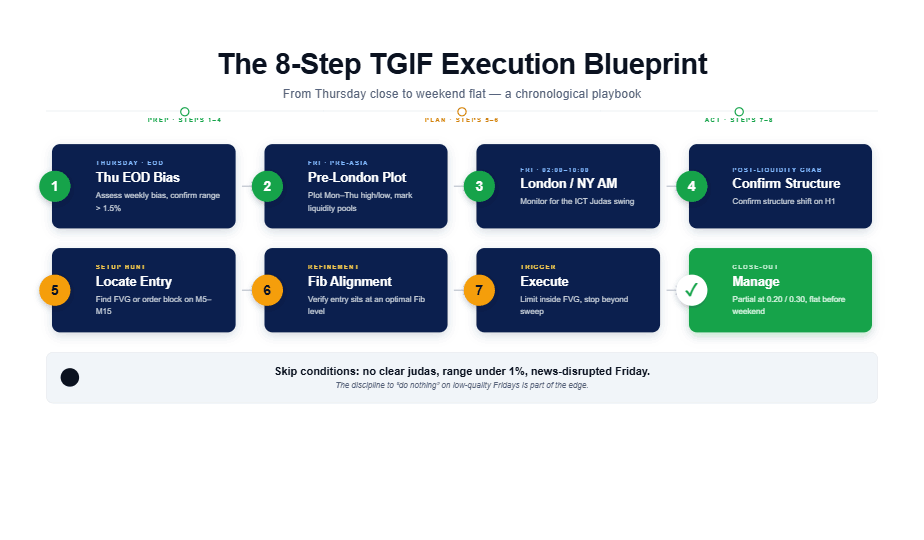
Rule: Skipping a Friday is a trade. The discipline to stand down on a low-quality range is part of the model’s edge. |
Bullish TGIF Setup (Trading From Weekly Low to Fair Value)
The bullish tgif setup activates during bearish market weeks when Friday prints a new weekly low via downside manipulation. The TGIF (Thank God It’s Friday) trading strategy is designed to capitalize on the weekly high or low formation, which typically occurs on Fridays in trending markets.
Execution sequence
The bullish execution sequence follows five steps:
- Price sweeps into a higher timeframe demand zone, taking out sellside liquidity below the weekly low
- MSS confirms bullish reversal on H1
- Fair value gap forms on M15 during upside displacement
- Entry: Long position at 50-62% FVG retrace
- Targets: 0.20 and 0.30 retracement levels toward weekly mean
Mini Example: Bullish EUR/USD TGIF — March 2025 (text-only scenario)
Real market example: EURUSD on a Friday in March 2025, price drops 80 pips during London to sweep the weekly low at 1.0850 (vs. prior 1.0930), MSS bullish breaks post-low higher low, buy trade entered at FVG targeting 0.20 (1.0900) and 0.30 (1.0885), yielding 1:3 risk-reward.
Bearish TGIF Setup (Trading From Weekly High to Fair Value)
The bearish tgif setup emerges during bullish market weeks when Friday pushes to a new weekly high via upside manipulation into premium zones.
Execution sequence
The bearish execution sequence is the mirror image:
- Price spikes into a higher timeframe supply area, taking out buyside liquidity above the weekly high
- MSS confirms bearish reversal on H1
- Bearish fair value gap or order block forms on M15
- Entry: Sell trade at FVG retrace
- Targets: 0.20 and 0.30 levels back inside weekly range
Mini Example: Bearish XAUUSD TGIF — December 2024 (text-only scenario)
Real market example: XAUUSD December 2024, gold spikes to $2650 weekly high during NY AM, MSS down breaks H1 swing, Fibonacci drawn from $2580 (low) to $2650 (high), short entry at bearish FVG targeting 0.20 ($2628) and 0.30 ($2620), capturing 100+ point reversal into PM session.
Key Notes:
- The setup direction is decided by the weekly extreme, not the trader’s opinion.
- Both variants require MSS confirmation before sizing — the judas alone is not the signal.
- Fibonacci targets sit on the same 0.20 / 0.30 band regardless of direction.
Fair Value Gaps, Liquidity Pools, and Confluence
Fair value gaps serve as primary entry zones after MSS in both bullish and bearish scenarios. These imbalances represent institutional footprints where price behavior tends to revisit.
Identifying liquidity pools
Liquidity pools cluster at predictable structural points. Mark these before Friday opens:
- Equal highs and equal lows
- Previous day’s high/low (PDH/PDL)
- Monday-Thursday extremes
- Friday’s ICT judas leg targets these before reversing
Confluence factors for A-grade setups
Four confluence checks separate a tradable TGIF from a noisy chart:
- Higher timeframe bias alignment
- FVG positioned at Fibonacci level
- Entry during NY kill zone
- Clear liquidity sweep completion
Fair value and fair value gap are related but distinct: one refers to equilibrium (weekly average), the other to imbalances left by aggressive moves.
Fair Value Gap and Fibonacci: Practical Targeting Logic
After entry, the TGIF setup allows traders to take advantage of price retracements back to the weekly range after a weekly high or low has been established, using tools like Fibonacci retracement levels to set profit targets at 0.20% and 0.30%.
Targeting workflow
The targeting workflow scales out across three zones to capture the bulk of the reversal without giving back gains:
- First partial: Nearest intraday liquidity pool (1:1 risk-reward)
- Main targets: 0.20 and 0.30 levels of weekly swing (50-75% of position)
- Extension targets: 1.272 or 1.618 in high-volatility conditions (remaining position)
Move stop to breakeven once price fills nearby fair value. Scale out dynamically rather than holding for single exit.
Adjust price targets if New York PM liquidity dries up or spreads widen late Friday, especially relevant for CFD products where final trading hours can see 2-5x spread expansion.
Risk Management, Trade Management, and Position Sizing
TGIF is a high-probability but low-frequency setup, approximately 52 opportunities annually with 30-40% invalid. Trade with defined risk: 0.5-1% of account balance per position.
Position sizing formula: Position Size = (Account Risk %) / (Entry-SL Distance × Pip Value)
Friday-specific risks
Four conditions can invalidate an otherwise clean TGIF setup. Each must be monitored before and during execution:
- Spreads widening near market close
- Reduced liquidity after major data releases
- Weekend gaps impacting held positions
- News events (avoid NFP Fridays)
Recommendations
Apply the following operational rules every Friday, without exception:
- Backtest 30+ historical Fridays before live trading
- Scale out at 0.20 and 0.30 levels rather than single take profit
- Journal every setup with screenshots
- Close all positions before weekend
Q: Why limit risk to 0.5-1% on TGIF when the setup looks high-probability?
A: Because annual frequency is roughly 52 attempts with a 30-40% invalidation rate, the realistic edge plays out over months, not weeks. Larger position sizes amplify normal variance into account-ending drawdowns long before the edge can manifest.
Common Mistakes When Trading the TGIF Setup
Even experienced traders fall into repetitive price patterns of error with this friday setup:
- Forcing trades in narrow ranges: When the weekly range falls below 1% expansion, Fibonacci targets often aren’t reached, resulting in premature stop-outs. A trendy market with clear direction is essential.
- Trading against higher timeframe bias: Taking a bearish TGIF short against a D1 bullish displacement leads to 70%+ failure rates.
- Entering before MSS confirmation: Jumping in after the judas without waiting for market structure confirmation gets traders stop-hunted 60% of the time.
- Poor stop placement: Placing stops just beyond equal highs/lows guarantees losses.
- Psychological errors: Treating every Friday move as TGIF, revenge trading failed attempts, and over-leveraging due to perceived pattern “certainty.”
Using TGIF Setup With Aron Groups Broker Tools
Traders can access forex, indices, gold, and crypto CFDs via Aron Groups Broker on MT5 to apply the TGIF model in real market conditions with competitive spreads.
Recommended Friday watchlist
Concentrate on highly liquid, well-correlated instruments where the TGIF mechanics print cleanly:
- Major FX: EURUSD, GBPUSD, USDJPY
- Gold: XAUUSD
- Indices: US30, NAS100
Use built-in or custom Fibonacci scripts and FVG scanners on MT5 to automate weekly swing identification. While complementary services like copy trading exist, master ict tgif execution requires independent analysis and risk management.
Final Thoughts
The ict tgif setup helps traders capitalize on Friday’s unique market conditions through a structured approach to liquidity, fair value rebalancing, and Fibonacci-based targeting. Success depends on respecting the sequence: weekly high/low formation → ict judas → market structure shift → FVG entry → Fibonacci targets.
Much like how organizations use TGIF events to end the week with a sense of accomplishment and positive note, disciplined traders can approach Fridays with a clear framework. The tgif setup form of trading rewards patience, the discipline to “do nothing” on low-quality Fridays is part of the edge.
Backtest on at least 20-30 historical Fridays across multiple instruments before trading live. Remember: no setup works every week. Long-term consistency comes from accepting key considerations about market conditions rather than forcing every opportunity.