icon icon Home
icon icon Accounts
icon icon Quick start
icon icon Symbols

Mastering the Quasimodo (QM) Pattern in Price Action Trading

Author
Abe Cofnas
Abe Cofnas
calendar Last update: 26 October 2025
watch Reading time: 10 min

In technical analysis, traders seek patterns that can accurately predict market reversal points. Among the most powerful of these formations is the Quasimodo (QM) pattern. This pattern, grounded in the logic of price movements and market structure, enables traders to identify the end of an existing trend and the beginning of a new one.

Unlike classic patterns such as the Head and Shoulders, the QM pattern offers a deeper level of market insight and is often associated with Smart Money Concepts (SMC). In this guide, we will conduct a comprehensive analysis of the structure, variations, and trading strategies related to this effective pattern.

bookmark
Key Points:
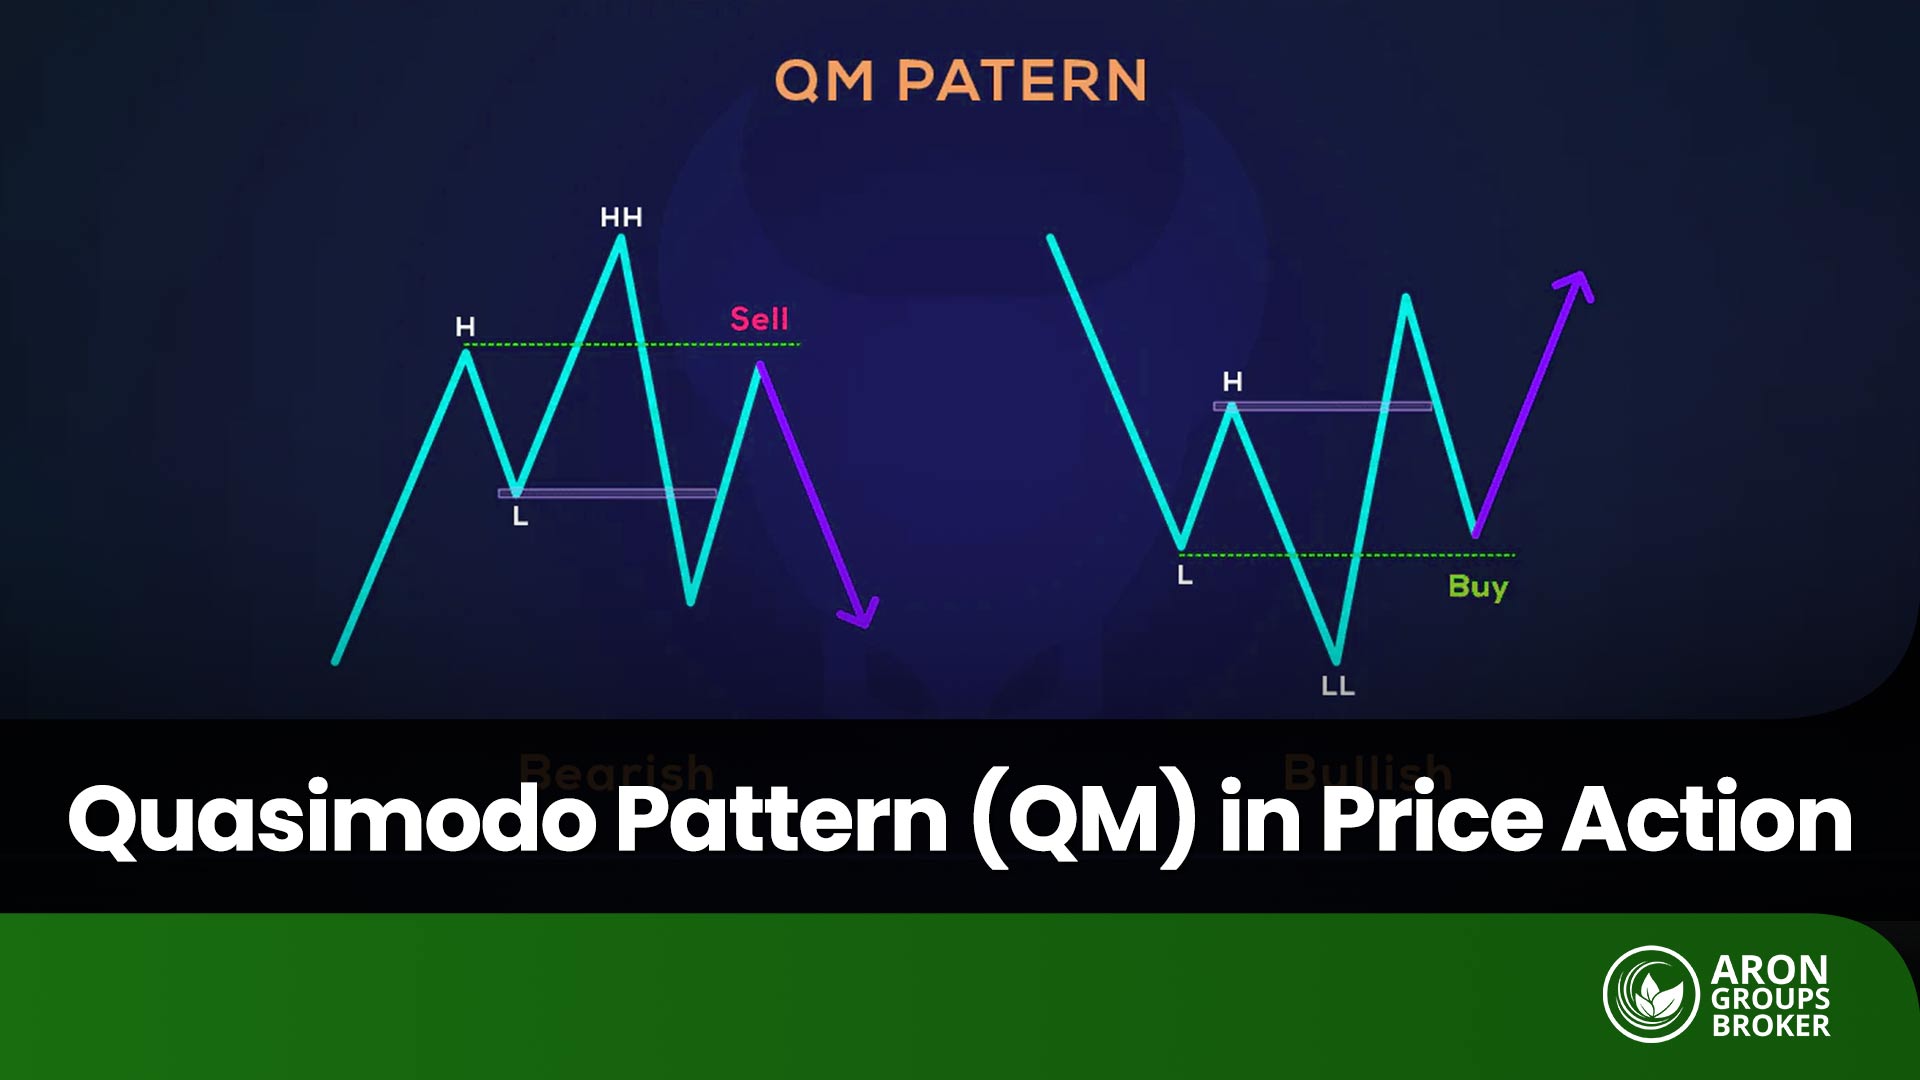
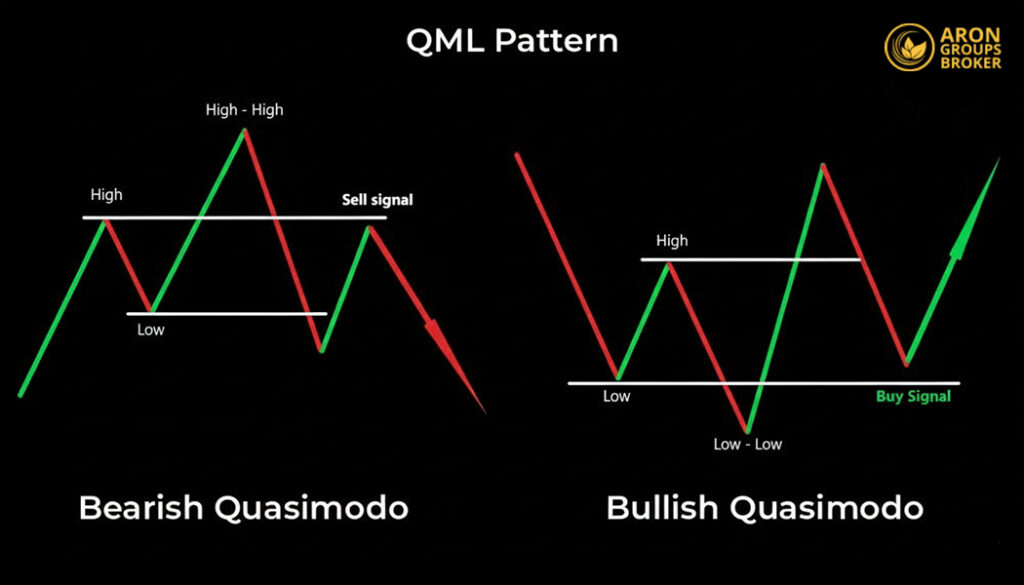
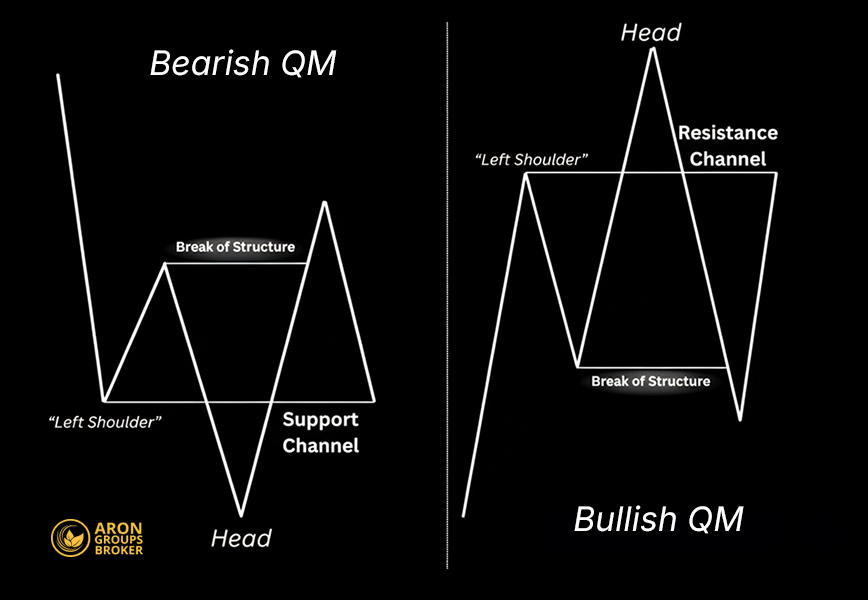
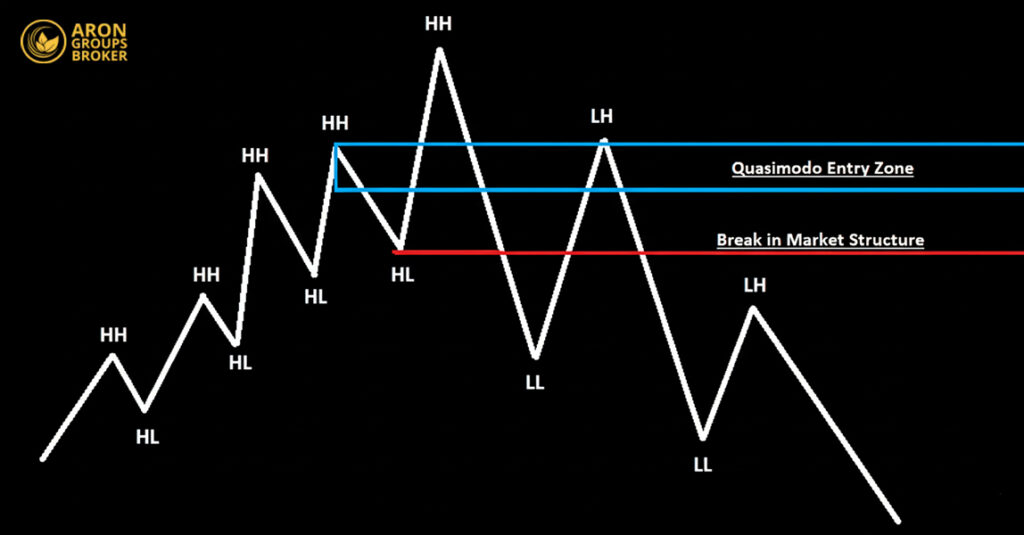
  • The QM pattern is an advanced reversal formation that signals a break of market structure (BOS) before the final reversal.
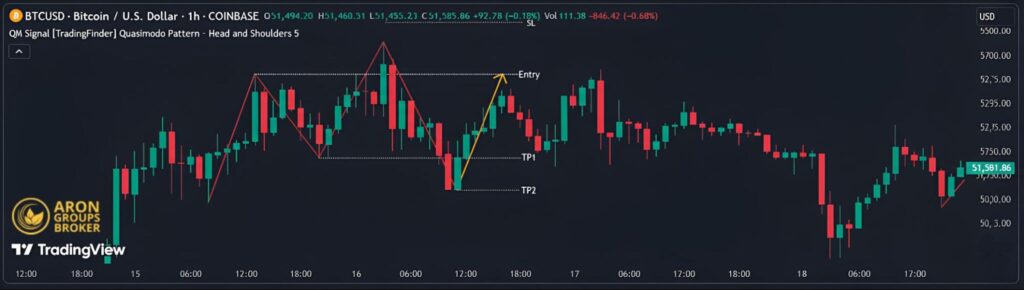
  • The optimal entry point is the Quasimodo Level (QML), which corresponds to the left shoulder.
  • The stop-loss order should always be placed beyond the pattern's head—above the highest high in a bearish setup or below the lowest low in a bullish setup.
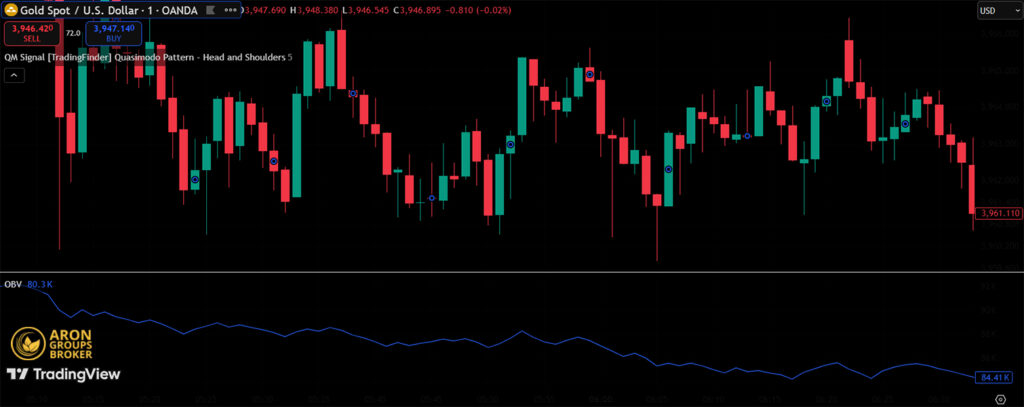
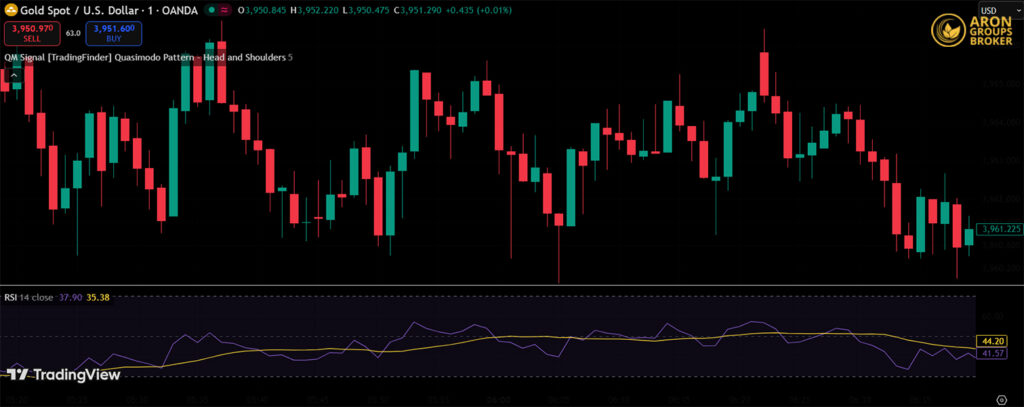
  • The pattern’s reliability is enhanced when combined with other technical indicators, such as RSI divergence, order blocks, and supply and demand zones.
  • While the QM pattern is fractal and appears on all timeframes, its validity is significantly higher on longer timeframes (H4 and above).

What is the Quasimodo (QM) Pattern in Price Action Trading?

The QM pattern is a reversal formation that indicates a potential shift in the prevailing market trend. Its name is derived from the character Quasimodo, alluding to the pattern’s asymmetrical and uneven structure. The primary feature that distinguishes the QM pattern from other price action patterns is its tendency to trap traders who enter positions based solely on breakouts of previous highs or lows.

Quasimodo Pattern

In a bearish context, the QM pattern forms when the price action creates a new higher high (HH), followed by a break of structure (BOS) to the downside. This deceptive move, often referred to as a liquidity grab or stop hunt, captures liquidity resting above the previous high before the market reverses direction.

Anatomy of the Quasimodo (QM) Pattern

To correctly identify this pattern, you must be familiar with its key components. A complete QM pattern consists of the following elements:

Quasimodo Pattern

Left Shoulder

This is the first peak (in a bearish setup) or trough (in a bullish setup) within the pattern’s structure. It serves as a critical reference point.

Head

This point represents the highest high in a bearish QM or the lowest low in a bullish QM. This move surpasses the high or low of the left shoulder, often misleading traders into believing the prior trend is continuing.

Right Shoulder

Following the break of the market structure (BOS), the price retraces to form the right shoulder. In a bearish pattern, this is a rally; in a bullish pattern, it is a decline. This move typically stalls in the price zone of the left shoulder.

Break Point

This is the level where the price violates the market structure. In a bearish QM, it’s the point where the price breaks below the low formed between the left shoulder and the head. In a bullish QM, it’s where the price breaks above the high formed between the left shoulder and the head. This action provides the first significant signal of a trend change.

Quasimodo Level (QML)

The most critical level in the QM pattern is the price level of the left shoulder. This zone, known as the Quasimodo Level (QML), represents the optimal entry point for a trade in the direction of the new trend. Price is expected to react strongly to this level upon the formation of the right shoulder.

Types of QM Patterns in Price Action

The Quasimodo pattern manifests on charts in both bullish and bearish variations.

Bullish QM Pattern

This pattern forms at the culmination of a downtrend and signals a potential reversal to an uptrend. Its formation sequence is as follows:

Quasimodo Pattern
  • A trough (Left Shoulder) is established.
  • The price then declines to register a lower low (Head).
  • Following this, the price rallies and breaks the prior high, resulting in a break of structure (BOS).
  • Finally, the price retraces to the level of the left shoulder (the Quasimodo Level or QML), presenting a potential buying opportunity.

Bearish QM Pattern

This pattern appears at the end of an uptrend and provides a sell signal. Its formation sequence is as follows:

Quasimodo Pattern
  • A peak (Left Shoulder) is established.
  • The price then rallies to register a higher high (Head).
  • Subsequently, the price declines and breaks the prior low, causing a break of structure (BOS).
  • Finally, the price retraces to the level of the left shoulder (the Quasimodo Level or QML), which serves as an entry point for a sell trade.

Optimal Timeframes for Identifying the QM Pattern

Selecting the appropriate timeframe is a critical factor in the success of trading strategies based on the Quasimodo (QM) pattern. The pattern is fractal, meaning its structure repeats across all chart durations, from the one-minute (M1) to the monthly (MN) timeframe. However, it is essential to understand why the pattern holds greater validity on higher timeframes and how to leverage this characteristic effectively.

Why Are Higher Timeframes More Reliable?

The reliability of a pattern on higher timeframes (e.g., 4-hour, daily, weekly) is significantly greater for two primary reasons:

  • Reduction of Market Noise: Lower timeframes (e.g., M1, M5, M15) are saturated with random and insignificant price fluctuations known as market noise. This noise can generate numerous false patterns. On higher timeframes, each candlestick represents a longer period of trading activity, thereby reflecting more substantial price movements and significant market decisions while filtering out short-term noise.
  • Greater Capital Participation: A QM pattern that forms on a daily chart signifies a major battle between buyers and sellers over several days, involving a much larger volume of capital. In contrast, a QM pattern on a one-minute chart might be the result of only a few small trades. Consequently, a pattern forged by more significant market decisions and heavier capital investment carries greater validity and importance.

How to Trade the Quasimodo (QM) Pattern

Once the pattern has been correctly identified, the next step is trade execution. A successful trade based on the QM pattern requires the precise determination of three core components: the entry point, the stop-loss, and the price targets.

Trade Entry After a Break of Structure

The optimal entry point for a trade is the Quasimodo Level (QML), which corresponds to the price level of the left shoulder. After the price confirms a break of the structure, traders should wait for a retracement to this level to initiate a position. Entering at this zone typically offers the most favorable risk/reward ratio.

Mastering the Quasimodo (QM) Pattern in Price Action Trading

Setting a Stop-Loss for the QM Pattern

Effective risk management is vital to any trading strategy. When trading the QM pattern:

  • For a bearish pattern: The stop-loss should be placed slightly above the head (the highest high).
  • For a bullish pattern: The stop-loss should be placed slightly below the head (the lowest low).

Placing the stop-loss in these locations ensures that if the analysis is incorrect and the prior trend resumes, the position will be closed with a minimal loss.

Determining Price Targets and Exit Points

Several methods can be used to establish take-profit levels:

  • Key Support and Resistance Levels: These levels act as price magnets, as they have historically caused trends to pause or reverse. Setting the first price target (TP1) at the nearest key level is a logical and conservative strategy. Many professional traders take partial profits at these points to de-risk the trade.
  • Fixed Risk/Reward Ratio: This is a systematic approach rooted in money management. With this strategy, you predetermine a target based on a specific ratio, such as 2:1 or 3:1. This method promotes trading discipline and ensures that, on average, winning trades are larger than losing ones.
  • Previous Market Structure Highs and Lows: These points are natural price targets because they represent areas of liquidity where the market is likely to gravitate.
    • For a sell trade: Targeting the last significant low created before a rally is an effective strategy.
    • For a buy trade: Targeting a significant previous high is a logical objective.
sms-star

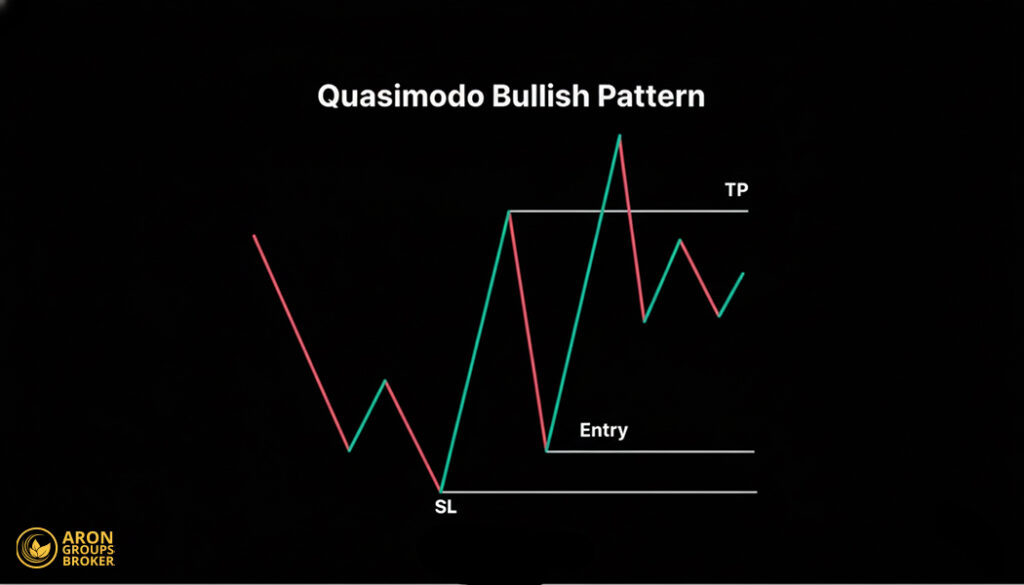
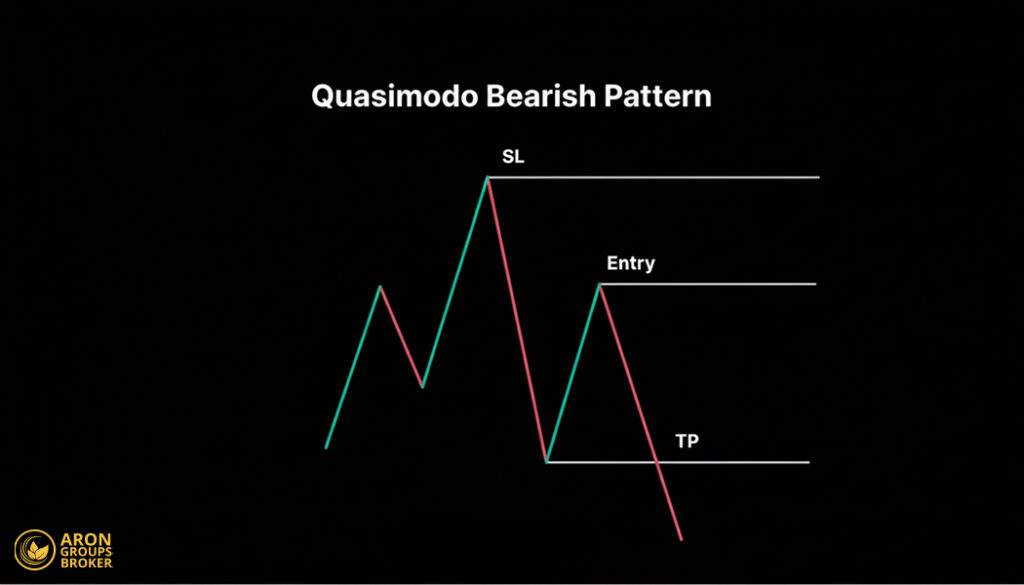
💡 Professional Tip: The most effective approach is to combine these methods. For example, set your first take-profit level (TP1) at the nearest support or resistance and a final target (TP2) based on a major market structure point or a 3:1 risk/reward ratio.

Confirming QM Pattern Entries with Order Blocks and Imbalances

To identify high-probability entry points, it is highly effective to combine the Quasimodo (QM) pattern with two key Smart Money Concepts.

Quasimodo Pattern
  • The Core Setup: Look for a QM pattern where the Quasimodo Level (QML), or the left shoulder, aligns perfectly with a valid Order Block (OB). This confluence signifies that both the market structure (indicated by the QM) and the institutional order flow (indicated by the OB) are confirming the same reversal zone.
  • The Price Magnet: The presence of an imbalance, also known as a Fair Value Gap (FVG), near the order block further increases the setup’s validity. This inefficiency acts as a magnet, drawing the price toward your intended entry point to fill the gap.
  • The Ideal Entry Scenario: The optimal entry occurs when the price retraces to form the right shoulder, simultaneously filling the price imbalance and reacting to the order block situated at the QML. This convergence of three distinct factors provides a powerful trade entry signal.

Combining the QM Pattern with ICT Price Action Concepts

Quasimodo Pattern

The Quasimodo (QM) pattern is a core concept within the Inner Circle Trader (ICT) price action methodology. From an ICT perspective, the move that forms the head of the pattern (the higher high or lower low) is interpreted as a liquidity grab or stop hunt. Its primary purpose is to trigger stop-loss orders and trap breakout traders before the market reverses.

Combining the QM Pattern with Supply and Demand Zones

Quasimodo Pattern

The left shoulder of a bearish QM pattern often aligns with a potent supply zone, while in a bullish QM pattern, it frequently corresponds to a valid demand zone. The confluence of the Quasimodo Level (QML) with these zones provides strong confirmation for a trade entry.

sms-star

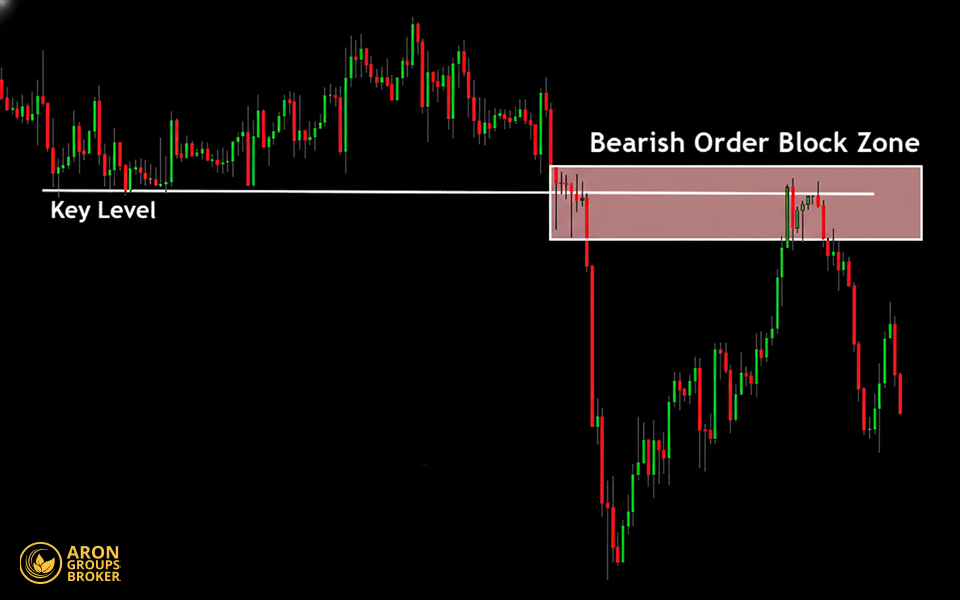
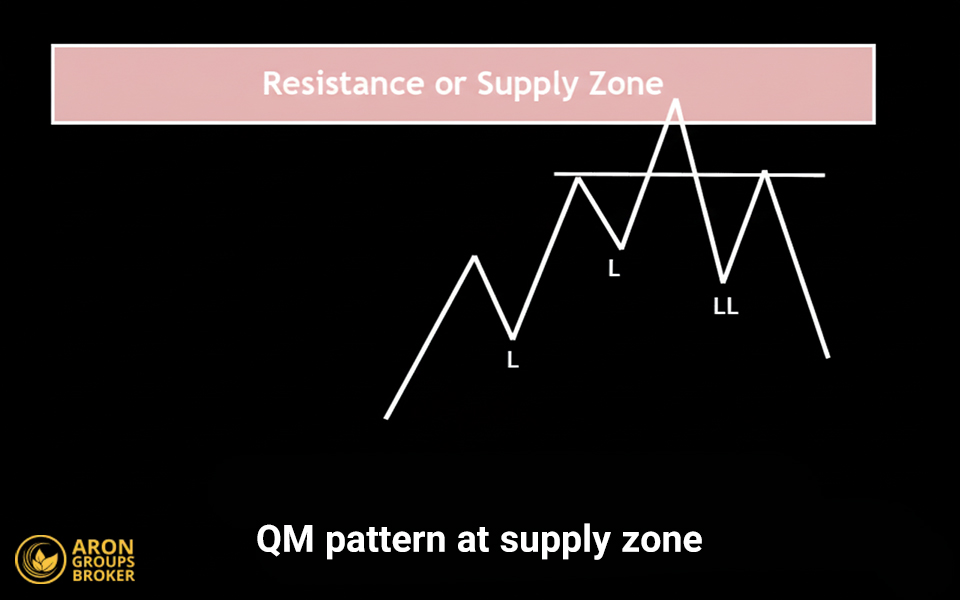
According to ForexBee, the success of a QM pattern is highly dependent on its location. To increase the probability of a successful trade, execute buy signals only when they form in support or demand zones and sell signals only in resistance or supply zones. Avoid trading this pattern within a ranging or trendless market.

Combining the QM Pattern with the On-Balance Volume (OBV) Indicator

Quasimodo Pattern

Divergence on the On-Balance Volume (OBV) indicator can serve as excellent confirmation for a QM pattern. For instance, in a bearish QM setup, if the price is making a higher high while the OBV fails to do the same, this divergence indicates weakening buying pressure and signals a high probability of a price reversal.

Combining the QM Pattern with the Relative Strength Index (RSI)

Quasimodo Pattern

Divergence on the Relative Strength Index (RSI) is one of the most popular confirmation signals for reversal patterns. In a bearish QM, when the price forms a higher high, but the RSI simultaneously forms a lower high, this classic bearish divergence indicates diminishing momentum and a strong likelihood of a price decline.

Conclusion

The Quasimodo (QM) pattern is a highly effective tool in price action for identifying market reversal points with precision. It offers a more sophisticated analysis of market dynamics and liquidity than classic chart patterns. By accurately identifying its components, correctly defining entry points, stop-losses, and price targets, and combining it with other confirmation tools, traders can leverage this pattern to execute profitable trades in the direction of new trends.

Remember that no pattern is infallible, and rigorous risk management must always be the top priority.

Source: TradingView QM Scripts

Continue Reading
not-found
calendar 26 October 2025
Rate this article

Leave a Reply

Your email address will not be published. Required fields are marked *

No thanks