


In price action analysis, there are times when candlesticks enter a phase of stagnation, indicating a temporary pause in market momentum. During such periods, the Base Candle plays a crucial role, as it reflects a state of balance between buyers and sellers and often signals the potential beginning of a new move.
Understanding what a Base Candle is and how it forms within the price action structure helps traders identify more precise entry and exit points in their trades. This concept is one of the fundamental pillars for interpreting market trends and identifying key zones, which we will explore in detail below.

- Understanding the balance between buyers and sellers within the Base Candle structure provides deeper insight into the market’s true behavior.
- Combining Base Candle analysis with the identification of supply and demand zones significantly enhances the ability to anticipate potential price reversals.
- Waiting for confirmation after a base has formed is one of the key factors in improving the accuracy of price action trades.
- Applying proper risk management and a well-structured trading plan when trading based on base formations plays a decisive role in long-term consistency and success.
What Is a Base Candle and What Role Does It Play in Price Action?
In price action trading, the concept of a Base Candle refers to a section of the chart where price temporarily enters a state of equilibrium. During this phase, buyers lose the incentive to continue pushing prices higher, while sellers exert minimal pressure to drive prices lower. This temporary balance often occurs before a strong impulsive move and can serve as a clue for either a trend continuation or a potential market reversal.
To put it simply, a Base Candle represents a pause in price movement, where the market consolidates and gathers the necessary energy for its next move. Because of this, price action traders pay close attention to these base areas, as they often mark the starting point of significant price movements.
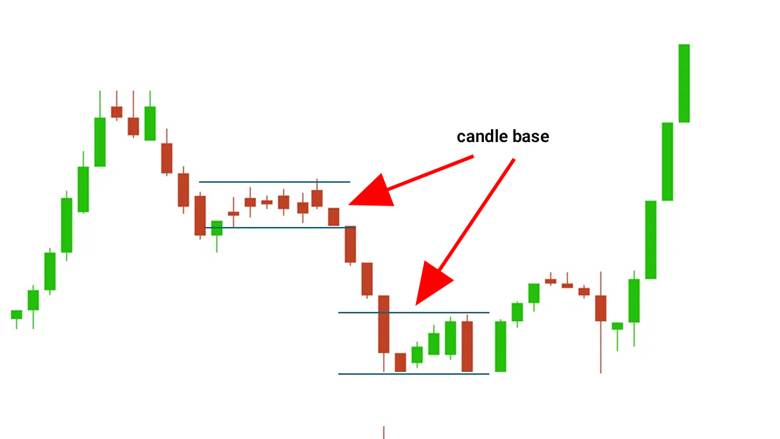
For example, imagine that on an asset’s chart, after a sharp upward rally, the price enters a consolidation phase and forms several small candles in succession. This consolidation zone is the Base Candle area, which may eventually lead to a new bullish leg once its boundaries are broken.

According to PriceActionNinja, some analysts emphasize that when a strong and rapid price impulse occurs right after the formation of a Base Candle, it often signals the entry of “smart money” into the market.
Components of a Base Candle
In price action trading, every detail inside a Base Candle carries important information about what is happening between buyers and sellers. By understanding the internal structure of the candle, traders can interpret market sentiment more accurately. Let’s look at the main elements that form a Base Candle in a clear and simple way.
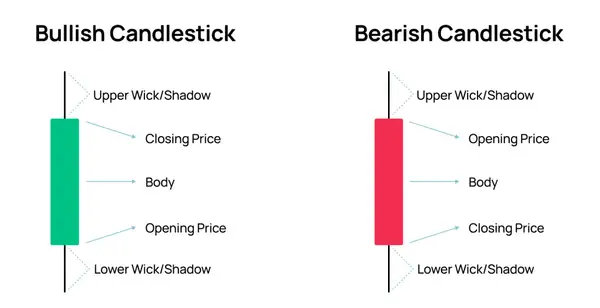
Body
The body of a Base Candle is usually small. This means the distance between the opening and closing prices is limited. A large body often reflects a strong directional move, not a base. A small body shows indecision in the forex market and a temporary balance between buying and selling forces.
Wicks or Shadows
In many Base Candles, the upper and lower wicks are longer than usual. These wicks represent attempts by price to move higher or lower, but each time the opposing side pushes it back. The presence of long wicks shows hesitation and balance between buyers and sellers.
Body to Wick Ratio
The relationship between the body and the wicks in a Base Candle is very meaningful. When the body is very small and the wicks are long, it means there is strong pressure from both sides. If the body is moderately sized and the wicks are shorter, it may suggest that a new trend is beginning to form rather than a clear consolidation.
Number of Candles in a Base
A base can appear as one single small candle or as a group of several small candles that form together. When multiple small candles appear in a row, it reflects a stronger consolidation phase where supply and demand remain in balance for a longer time.
Buyer and Seller Pressure Inside the Base
Inside a Base Candle, buyers and sellers are constantly competing, but neither side dominates. Repeated attempts to break the upper or lower boundaries of the base can show that one side is gaining control. Once price moves out of the base, it becomes clear which group has taken the lead.
Having a clear understanding of these elements helps traders identify the importance of a Base Candle within price structure and use it effectively to find precise entry and exit points in their trading strategy.
Types of Base Candles in Price Action
In price action trading, price movement does not always flow in one clear direction. Sometimes the market pauses in the middle of a trend to allow buyers and sellers to reach a temporary balance. During this pause, a structure known as the Base Candle is formed. Depending on where it appears in the overall trend, the base can be bullish, bearish, or neutral. Understanding these different types of Base Candles helps traders identify potential areas for price continuation or possible reversals.
Bullish Base Candle
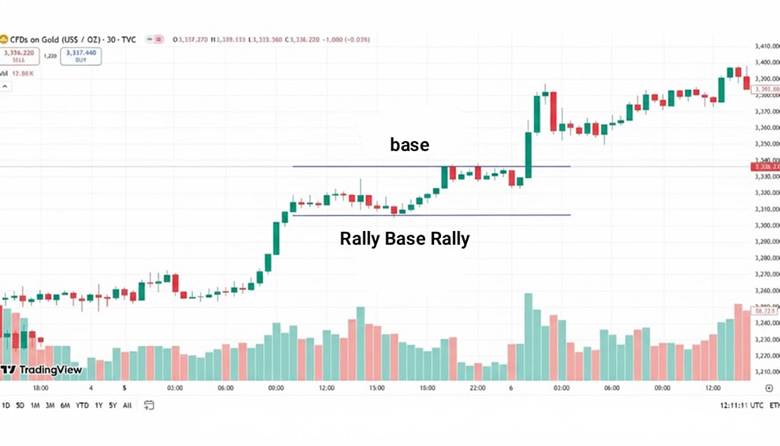
A Bullish Base Candle forms when the market experiences a downward move, then enters a short consolidation phase before starting to rise again. In this phase, price moves within a narrow range and buyers gradually gain strength over sellers. This type of Base Candle often marks the beginning of a new upward movement. In the concept of supply and demand, it is known as the Rally Base Rally (RBR) pattern.
In some trading methods, such as the Quasimodo (QM) pattern, these base zones are considered important signs of a potential trend reversal or the start of a new bullish wave.
Bearish Base Candle
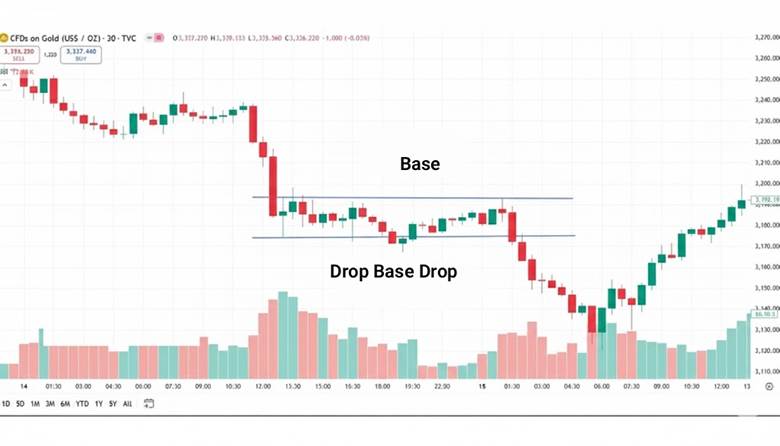
A Bearish Base Candle appears when the market is moving upward but pauses for a short time before beginning a downward move. During this phase, sellers slowly take control while buyers lose their momentum. This structure is often associated with the Drop Base Drop (DBD) pattern and is recognized as a supply zone where selling pressure can push the price down. Identifying this type of Base Candle helps traders find high-probability sell areas and plan short positions more effectively.
Neutral or Consolidation Base Candle
At times, the market shows no clear bullish or bearish direction. Price stays within a narrow range, forming small candles that reflect hesitation and uncertainty. This phase is called a Consolidation Base Candle. Trading volume often decreases during this stage, and the market waits for either buyers or sellers to take control. Once the consolidation area breaks, a strong price movement usually follows, defining the new direction of the market.
Recognizing the difference between these types of Base Candles allows traders to better understand how supply and demand interact and how balance shifts between buyers and sellers. This understanding helps in making more accurate trading decisions and improves overall timing for entries and exits based on price action.
The Role of the Base Candle in Supply and Demand Zones
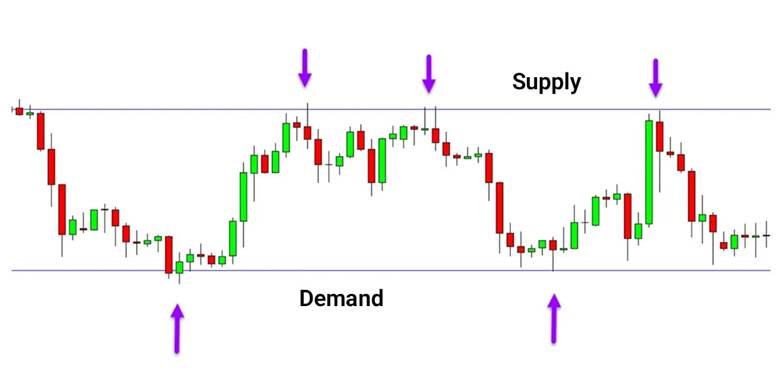
In technical analysis, many key points on a chart form where the price pauses for a short period before moving strongly in one direction. These zones often originate from structures that include the formation of a Base Candle. A base represents the area on the chart where the market temporarily stops between buyers and sellers, creating the foundation for supply and demand zones.
Base Candle as the Equilibrium Point Between Buyers and Sellers
When a Base Candle forms, the market is in a state of temporary balance between buying and selling forces. Price fluctuates within a narrow range, and neither side has enough strength to control the market. This balance becomes significant when one side eventually gains dominance, leading to a strong directional move. In essence, the Base Candle captures a moment of decision in the market that can mark the beginning of a new trend or the end of the current one.
Why Base Candles Create Powerful Reversal Zones in Supply and Demand Areas
When the market forms a base, it often reflects the activity of large traders or institutional investors entering or exiting the market. During this phase, a significant volume of orders accumulates within that zone, turning it into a strong level of potential reaction. Later, when the price revisits this area, those unfilled orders can become active again, increasing the likelihood of a price reversal.
Because of this characteristic, many analysts consider the Base Candle the core foundation for identifying supply and demand zones. Within the smart money concept, these zones represent the areas where major market participants position their capital and influence the next direction of price movement.
The Connection Between Base Candles and Order Blocks in Price Action Trading
In more advanced analysis, especially in institutional or smart money trading, base structures are closely linked to the concept of Order Blocks. Order Blocks are areas where large institutions have placed their orders, and the main market moves often originate from these points.
In many cases, the Base Candle marks the exact location where the Order Block has formed and where a large volume of trading activity has taken place. By combining the understanding of the Base Candle with the concept of the Order Block, price action traders can identify low-risk entry points and more precise exit zones within the market structure.
Ultimately, understanding the role of the Base Candle within supply and demand dynamics helps traders recognize where the market has paused and when it is preparing for a new move. This knowledge forms the foundation for accurate price behavior analysis and effective price action trading strategies.
How to Trade Using the Base Candle in Price Action
In price action trading, when the market pauses within a short-term range and then moves strongly in one direction, it creates a valuable opportunity for a precise trade entry. This range, known as the Base Candle, helps traders identify where orders accumulate and where a new movement begins. Using the Base Candle correctly, along with proper risk management and clear profit targets, is one of the key principles of professional price action trading.
How to Identify a Valid Base Candle Before Entering a Trade
To ensure the validity of a Base Candle, several important factors should be considered. The number of candles forming the base should not be too many, because long bases usually indicate weaker momentum. Ideally, a base consists of two to five small candles within a narrow range. The candle bodies are usually small, while the wicks are relatively long, showing a temporary balance between buyers and sellers.
During the formation of a base, trading volume typically decreases as the market takes a brief rest. Another strong confirmation of a valid Base Candle is when it forms in areas that overlap with supply and demand zones, since these points often lead to strong price reactions. Following these guidelines helps traders distinguish between strong and weak base structures before entering a trade.
How to Enter a Trade After a Breakout from the Base Candle
A trade signal forms when the price breaks out of the base range and a strong candle closes in the direction of the breakout. In price action structures, such as the Rally Base Rally (RBR) pattern, the breakout confirms a bullish continuation, while in the Drop Base Drop (DBD) pattern, it signals a bearish continuation.
The best time to enter a trade is after a breakout candle with a large body and sufficient volume, which confirms that momentum supports the move. This reduces the risk of a false breakout. Traders can use tools like TradingView charts to monitor price behavior visually and refer to analytical resources on Investopedia for deeper theoretical understanding. Combining visual observation with solid theory helps identify the most reliable entry points after a breakout.
How to Set Stop Loss and Take Profit When Trading the Base Candle
Effective risk control is crucial when trading based on the Base Candle. The stop loss is usually placed slightly outside the boundaries of the base. For a long position, it is placed just below the lower boundary of the base, while for a short position, it is placed just above the upper boundary.
The take profit target is determined according to the market structure. It can be set at the next supply or demand zone visible on the chart, or based on a fixed risk-to-reward ratio, such as 1:2. Traders who rely on the Base Candle often analyze price swings and market behavior on higher time frames to define more accurate targets.
In summary, the Base Candle becomes a powerful trading tool when a trader can correctly identify its validity, confirm the breakout direction, and manage risk with logical stop loss and target placement. Mastering these elements allows price action traders to enter the market with greater precision and confidence.
Some traders wait for a retest of the Base Candle area after a breakout before entering a trade. This means price breaks out, returns to touch the base again, and then moves in the breakout direction. Waiting for this retest helps confirm the breakout’s validity and reduces the risk of false breakouts, allowing for more precise and confident trade entries.
Common Mistakes in Identifying or Using the Base Candle
In price action trading, one of the most common mistakes is assuming that every consolidation area is a Base Candle. A true base must show clear signs of balance between buyers and sellers, such as small candle bodies, long wicks, and low trading volume. Without these features, the area is simply a short pause in the trend and lacks real significance.
Entering a trade too early, before the breakout is confirmed, is another frequent error. Many traders jump in without waiting for the confirmation candle to close, which often leads to false breakouts. Placing the stop loss too close to the base is also risky, as normal price fluctuations can easily trigger it and close the trade prematurely.
Another common mistake is ignoring volume and market structure. A Base Candle that forms near supply and demand zones or order blocks carries much more weight because it aligns with institutional activity and smart money flow. In contrast, bases that form randomly in the middle of a trend usually lack the strength to cause a major price reversal.
Conclusion
Understanding the Base Candle is one of the most essential skills for every price action trader. A base represents the point where the market pauses briefly to create a temporary balance between buyers and sellers, and this equilibrium often becomes the starting point of a strong future movement.
By carefully analyzing the structure of the Base Candle, recognizing its position within supply and demand zones, and studying price behavior during breakouts, traders can achieve more precise and strategic entries and exits. Mastering this concept not only improves analytical accuracy but also marks a significant step toward becoming a professional price action trader.