Trading in financial markets isn’t just about following trends. Sometimes, a small signal hidden within a single candlestick can mark the beginning of a significant reversal. The hammer candlestick is one such subtle yet powerful sign. It often appears when the market reaches a turning point, when the forces of supply and demand begin to shift.
By understanding this pattern precisely, traders can identify zones where selling pressure is exhausted and buyers begin to step in before the market entirely changes direction. In this article, rather than merely repeating textbook definitions, we explore how the hammer candle, when combined with contextual analysis and complementary tools like RSI, can serve as a highly effective entry signal for more accurate trades.

- If the hammer’s lower shadow aligns exactly with a liquidity zone, it signals absorption of sell orders and potential price reversal.
- A hammer forming on a higher timeframe gains validity when a sudden volume spike appears on a lower timeframe (e.g., 5-minute chart).
- Contrary to popular belief, the inverted hammer is not exclusive to downtrends in a sideways or range-bound market; it often indicates a breakout from consolidation.
What Is the Hammer Candlestick Pattern?
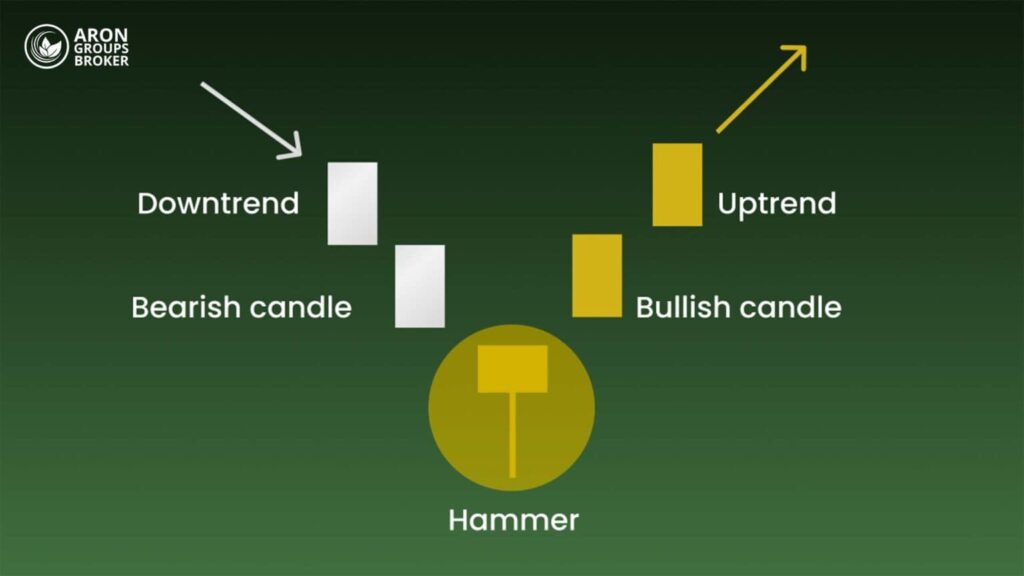
According to Investopedia, the hammer candlestick pattern is one of the most well-known and reliable reversal patterns in price action analysis, similar to the engulfing pattern. It typically appears at the end of a downtrend. This candlestick has a petite body near the top and a long lower shadow, signaling intense buying pressure following a period of heavy selling. Its shape resembles a hammer lying on the ground, which gives it its name.
When a bullish hammer (green candle) or even a bearish hammer (red candle) forms near a support zone or after a sharp price decline, it indicates that sellers initially pushed prices lower. Still, buyers later regained control and drove prices upward. This action is generally interpreted as a sign of a potential trend reversal from bearish to bullish.
It’s important to note that the hammer candlestick alone is not sufficient as a trading signal; it must appear in the proper market context to be considered valid.
Visual Characteristics of the Hammer Candle
The hammer has a distinct appearance that makes it easy to identify on price charts. Recognizing its structure accurately is essential for proper pattern identification:
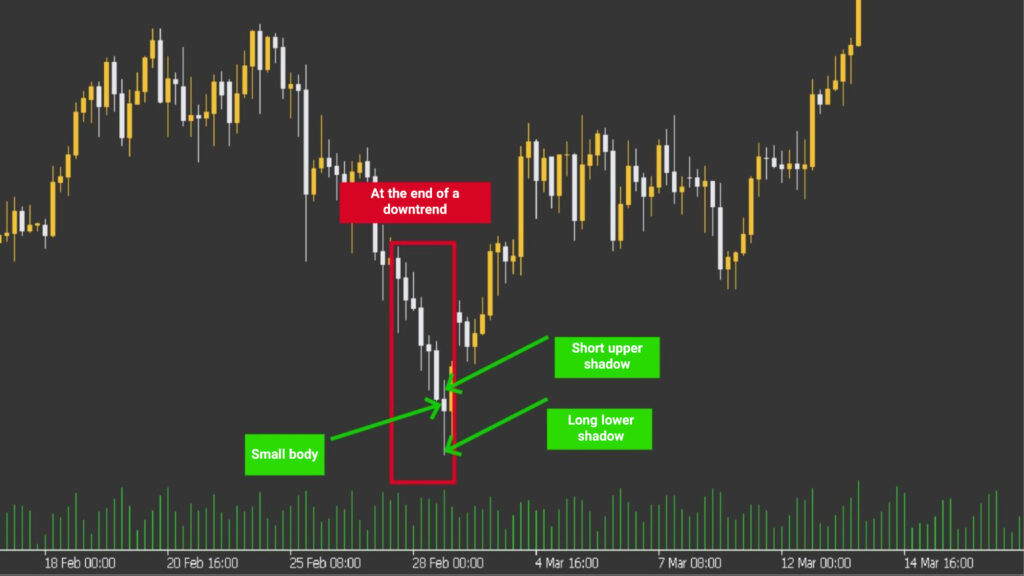
- Long lower shadow: The most defining feature of the hammer is its extended lower wick, typically two to three times the length of the real body. This shows that during the trading session, sellers pushed the price significantly lower, but buyers stepped in and forced it back up.
- Small body near the top: The small body near the top of the candle represents the narrow difference between the opening and closing prices. It can be green (bullish) or red (bearish), but the color itself is less important than its overall structure and chart position.
- Little to no upper shadow: In most cases, the upper wick is either absent or very short. The shorter it is, the stronger the candle’s reversal signal is considered to be.
When these features appear near a support level or after a strong downtrend, they often signal the formation of a bottom and the beginning of a price reversal.

If a hammer candle forms within the range of a previous engulfing candle, the likelihood of a more substantial reversal increases. This is because the hammer effectively acts as a “reversal trap” within the liquidity absorption zone of the preceding candle.
When Is a Hammer Candlestick Considered Valid?
Although a hammer candlestick on its own can signal a potential trend reversal, it must meet several key conditions to be regarded as a reliable trading signal:
- Appearing at the end of a downtrend: A hammer is valid only when it forms at the bottom of a downward movement. If it appears in the middle of a sideways trend or without an apparent prior decline, it should not be interpreted as a reversal signal.
- Forming near a support zone: The hammer gains more credibility when it emerges close to technical support levels or demand zones, areas where professional traders typically enter the market.
- Confirmation of a bullish signal: A bullish confirmation candle immediately following the hammer strengthens the signal, indicating that buyers have gained control. This confirmation may appear as a strong bullish candle or a breakout above a local resistance line.
- Long lower shadow and small body: The longer the lower wick and the smaller the real body, the stronger the rejection of lower prices and the more powerful the buying pressure. The absence or shortness of an upper wick further increases the pattern’s reliability.
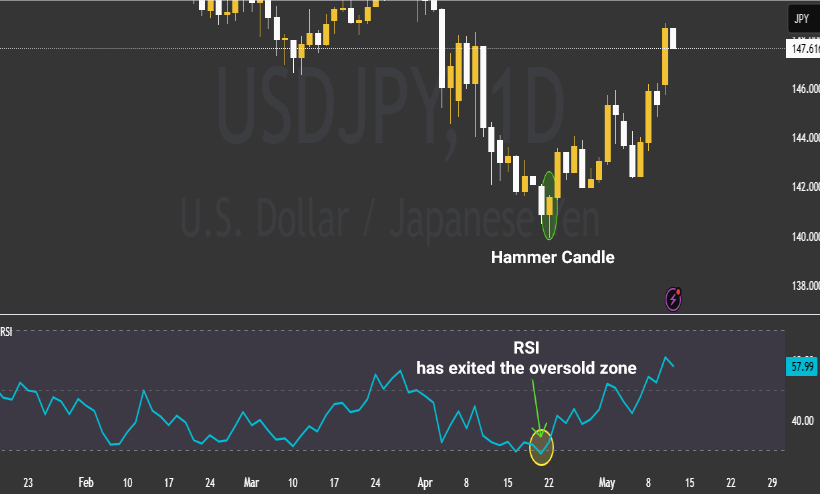
- Alignment with indicators: Combining the hammer with tools like the RSI (Relative Strength Index) can help pinpoint more precise entry points, especially when the RSI is in the oversold zone and the hammer forms at the same time.
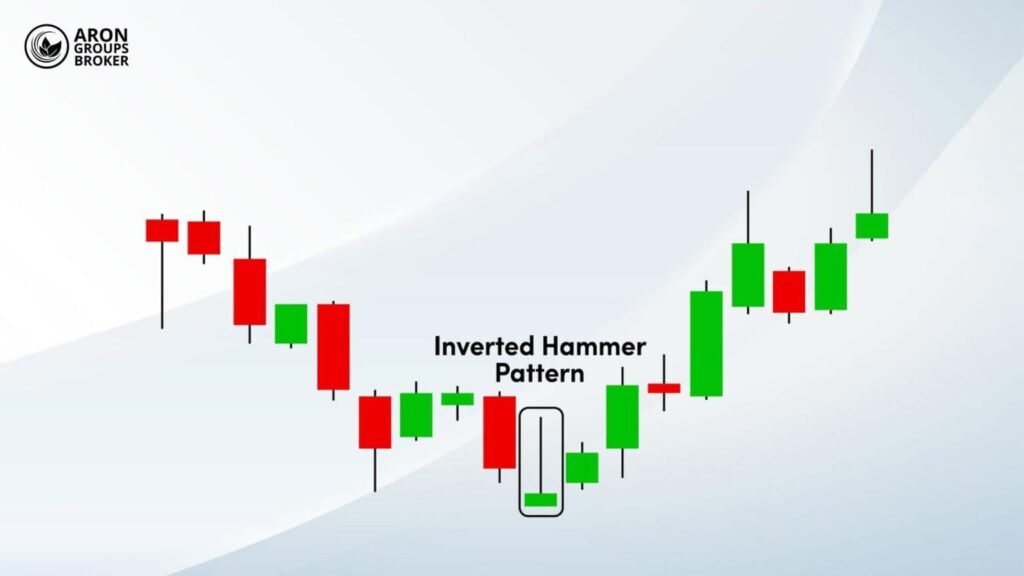
What Is an Inverted Hammer Candlestick and How Does It Differ from a Regular Hammer?
The Inverted Hammer is another price action reversal pattern that, like the regular hammer, appears at the end of a downtrend, but its structure is reversed. In this pattern, the candle’s real body is located near the bottom, while the long shadow extends upward, whereas in a regular hammer, the shadow is below and the body is at the top.
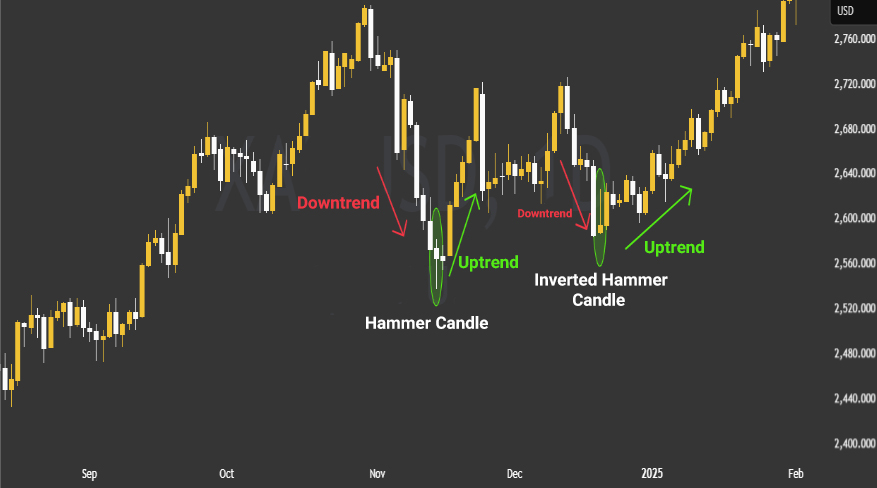
In an inverted hammer, the market initially rallies, forming a long upper shadow, but then declines and closes near the opening price. This behavior shows that buyers attempted to push prices higher, but selling pressure pushed them back down. Despite that, the formation of this pattern can signal the early stage of a bullish reversal, especially when followed by a strong bullish confirmation candle.

Both the hammer and inverted hammer are bullish patterns that appear after a downtrend, while the hanging man and shooting star are bearish and form after an uptrend.
Differences Between the Inverted Hammer and the Regular Hammer
- Shadow direction: The regular hammer has a long lower shadow, while the inverted hammer has a long upper shadow.
- Market psychology: The regular hammer indicates a clear rejection of selling pressure, whereas the inverted hammer acts more as an early warning of potential reversal.
- Confirmation requirement: The inverted hammer typically requires stronger confirmation, such as a solid bullish candle afterward, to be considered reliable.
How to Trade Using the Hammer and Inverted Hammer Candlesticks
Identifying a hammer or inverted hammer is only half the work. The key lies in how you enter the trade after these patterns form. A disciplined approach requires analyzing the chart context, waiting for confirmation, and setting proper stop-loss and take-profit levels.
Trading the Regular Hammer (Hammer Pattern)
When a hammer forms at the end of a downtrend and near a support zone:
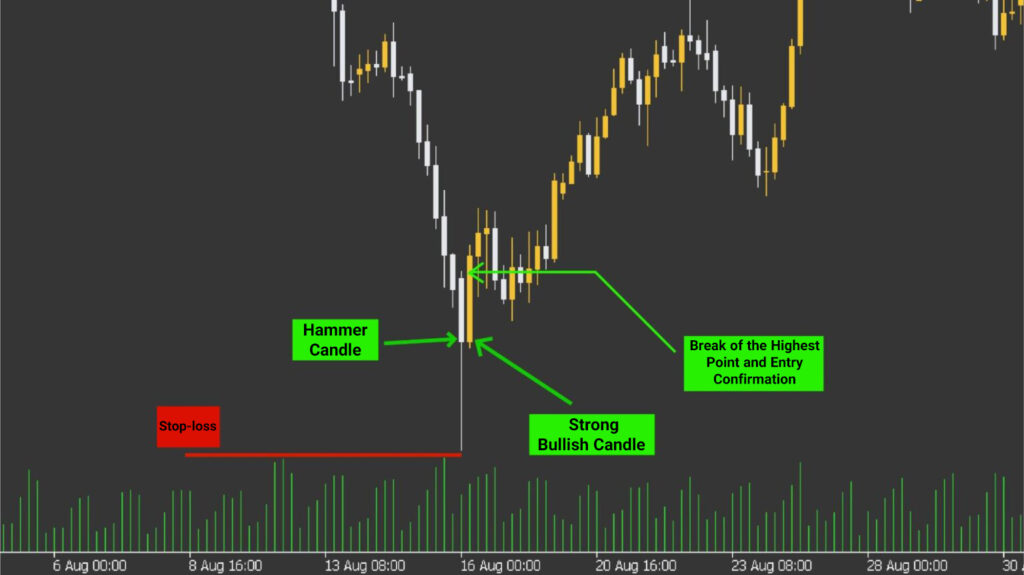
- Confirmation: Wait for the next candle to close. If it’s a strong bullish candle, an entry above it is considered reasonable.
- Entry: Enter a buy position once the price breaks above the high of the hammer or confirmation candle.
- Stop-loss: Place the stop-loss just below the hammer’s lower shadow.
- Take-profit: Use the next resistance level or a risk-to-reward ratio of 1:2 or 1:3.
Example:
Suppose the EUR/USD pair declines to a support level of 1.0650, where a green hammer candle with a long lower shadow forms. The next candle is bullish and closes above the hammer’s high. In this case, a trader could enter a long position at 1.0675, set the stop-loss below the hammer’s low (around 1.0635), and determine the take-profit based on the next resistance or desired risk-to-reward ratio.

If a hammer forms during key market sessions such as the end of the London session, the start of the New York session (in forex), or near futures contract settlements, it is often driven by smart money activity, increasing its reliability.
Trading the Inverted Hammer (Inverted Hammer Pattern)
When the inverted hammer forms at the end of a downtrend:
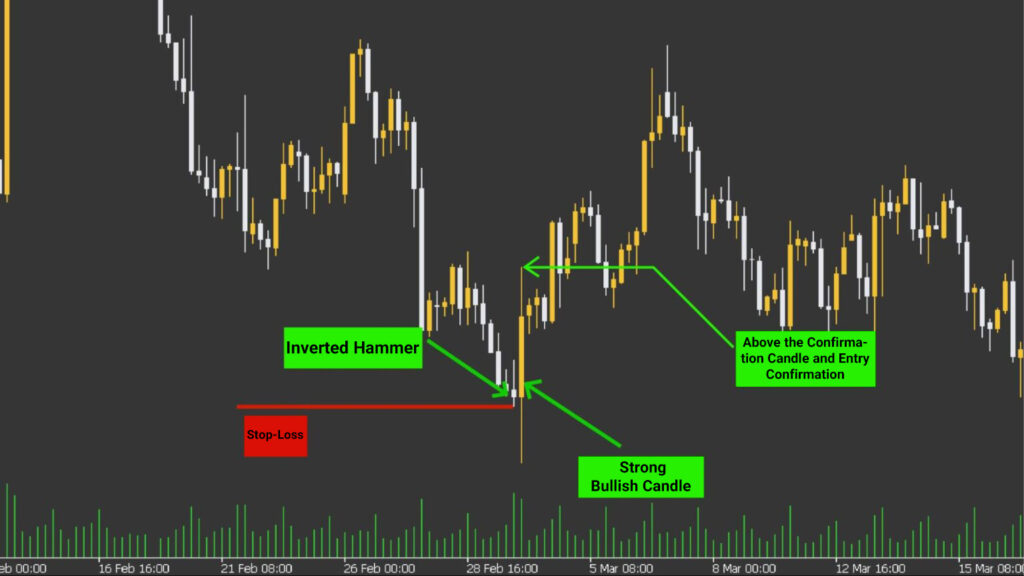
- Confirmation: Confirmation is crucial. The following candle should be clearly bullish and accompanied by high trading volume.
- Entry: Enter the trade above the confirmation candle’s high, not just after spotting the inverted hammer.
- Stop-loss: Place it slightly below the candle’s body or lower shadow.
- Take-profit: Set targets based on resistance levels or a favorable risk-to-reward ratio.
Example:
Suppose Bitcoin drops to a psychological support zone of $25,000. An inverted hammer appears as a green candle with a long upper shadow and a small lower body. The next candle is a strong bullish candle with high volume, closing above the hammer’s high. In this scenario, a trader might enter a buy position at $25,400, set a stop-loss below the hammer’s low at $24,800, and determine the take-profit based on the next resistance or a balanced risk-to-reward setup.
Combining Hammer and Inverted Hammer Candlesticks with Price Action and Technical Indicators
Integrating the hammer and inverted hammer candlestick patterns with price action concepts and indicators like RSI can create a highly effective framework for market decision-making.
Price Action: The Framework for Market Behavior
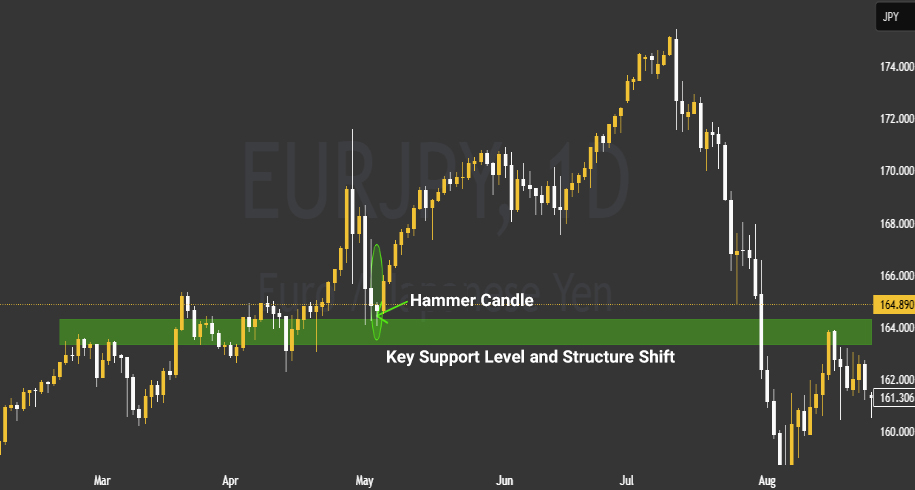
In price action analysis, the location of a hammer matters more than its appearance. When these candles form at key zones such as support levels or liquidity areas, they gain higher validity. Their reliability further increases when combined with factors such as market structure, fakeouts, or breaks of key levels, often offering precise entry points.
Combining the Hammer with RSI
One of the best ways to filter false signals is through the Relative Strength Index (RSI). This indicator reveals whether the market is overbought or oversold. For instance, if a hammer or inverted hammer forms while the RSI is in the oversold zone (below 30), the probability of a price reversal significantly increases.
Other Complementary Indicators
Alongside RSI, traders can use moving averages (MA) to identify the overall trend direction or MACD to confirm divergence. However, these indicators serve only as supporting tools; the candlestick’s structure and position remain the primary factors in decision-making.
Common Mistakes When Interpreting the Hammer Pattern
Despite being one of the most popular and practical reversal patterns in technical analysis, misinterpreting the hammer can lead to poor decisions and financial losses. Here are the most frequent mistakes traders make:

- Ignoring the candle’s location on the chart
The biggest mistake is entering a trade solely because the candle looks like a hammer, without checking whether it occurs at a support level or at the end of a downtrend. A hammer forming mid-uptrend or within a range-bound market has no reversal significance.
- Neglecting the confirmation candle
A hammer alone is not sufficient. The absence of a bullish confirmation candle afterward suggests that buyers lack the strength to sustain the move. Entering without confirmation exposes traders to false reversals.
- Confusing the hammer with similar patterns
Patterns such as spinning tops or doji candles may look similar to hammers. Failing to notice the shadow-to-body ratio and the candle’s location can lead to misinterpretation.
- Ignoring broader market conditions
The hammer should be analyzed within the overall market context. In highly volatile conditions or during major news events, the pattern alone cannot be relied upon as a signal of actual reversal.
- Using the hammer indiscriminately across all markets and timeframes
Some traders apply the same hammer strategy across markets—stocks, forex, and crypto—without considering structural differences. The pattern tends to be more reliable on higher timeframes and often requires additional filters in specific markets.
Conclusion
The hammer and inverted hammer candlesticks offer traders more than just a visual signal; they represent the market’s silent language of rebalancing between supply and demand. When interpreted within the proper market context and combined with price action and RSI analysis, they can mark the start of precise, intelligent trading decisions.
Ultimately, success with these patterns does not come from blind reliance on them, but from contextual understanding, multi-layered analysis, and the patience to wait for confirmation. When appropriately applied, the hammer pattern can evolve from a simple visual cue into a powerful forecasting tool for identifying trend reversals and building targeted trading positions.


