icon icon Home
icon icon Accounts
icon icon Quick start
icon icon Symbols

A Complete Price Action Guide to Trading the Morning Star and Evening Star Reversal Patterns

Author
Abe Cofnas
Abe Cofnas
calendar Last update: 5 November 2025
watch Reading time: 8 min

Some reversal candlestick patterns can help traders identify potential trend changes earlier and make better decisions about entering or exiting the market. Among these, the Morning Star and Evening Star patterns are among the most well-known, widely regarded by analysts as powerful signals of a trend reversal.

Becoming familiar with identifying the Morning Star and Evening Star candlestick patterns on a chart can help you trade with greater confidence. If you would like to learn more about these patterns and how to apply them in practice, we recommend reading this article to the end.

bookmark
Key Points:
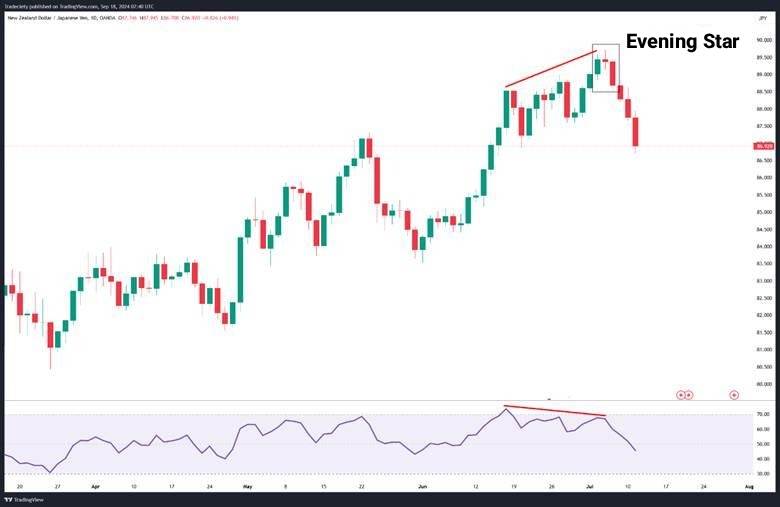
  • The Morning Star and Evening Star patterns tend to perform more effectively in highly volatile markets such as Forex or crypto, especially when they align with major economic news.
  • These patterns generally provide more reliable signals on higher timeframes (such as the daily chart) compared to shorter ones.
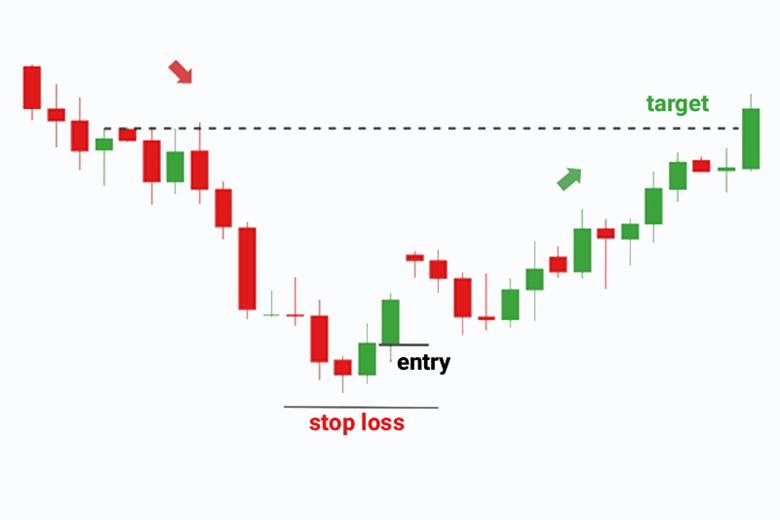
  • They reflect a shift in trader sentiment—from optimism to indecision, followed by either buying or selling pressure.
  • Combining these patterns with price action analysis and other chart formations (such as triangles or head and shoulders) can enhance overall profitability.

What is the Morning Star Pattern?

The Morning Star candlestick pattern is a three-candle bullish formation that appears at the end of a downtrend and signals a possible move to the upside. It plays an important role in price action analysis because it shows that sellers are losing strength and buyers are starting to take control of the market.

This pattern consists of three candles.

  • The first candle is a large bearish one that confirms the continuation of the downward movement.
  • The second candle is small or a doji and shows hesitation and balance between buyers and sellers.
  • The third candle is a strong bullish one that confirms the trend reversal. For stronger confirmation, the third candle should close at least halfway into the body of the first candle.

Traders usually combine the Morning Star pattern with other confirmation tools, such as support levels or the RSI indicator, to improve signal accuracy. It can be used across many financial markets, including Forex and stocks, and often gives traders greater confidence when entering buy positions.

Morning Star and Evening Star

What is the Evening Star Pattern?

When the market is in a strong uptrend and buyers have pushed prices higher, a specific pattern may appear that signals a possible reversal to the downside. One of the most common of these is the Evening Star candlestick pattern, which consists of three candles.

  • The first candle is a strong bullish one that confirms the ongoing uptrend.
  • The second candle is small or a doji and shows hesitation among traders.
  • The third candle is a relatively large bearish one that takes back a significant portion of the first candle’s gains or even breaks below it.

This structure helps analysts anticipate a potential shift from an uptrend to a downtrend. It can signal a good point to exit buy positions or consider entering sell positions. The Evening Star pattern is considered more reliable when it forms at the top of an uptrend, suggesting that buyers are losing momentum and that sellers are taking control.

Using this pattern, along with confirmations such as trading volume or other candlestick signals, can help traders make better, more confident decisions.

Morning Star and Evening Star
sms-star

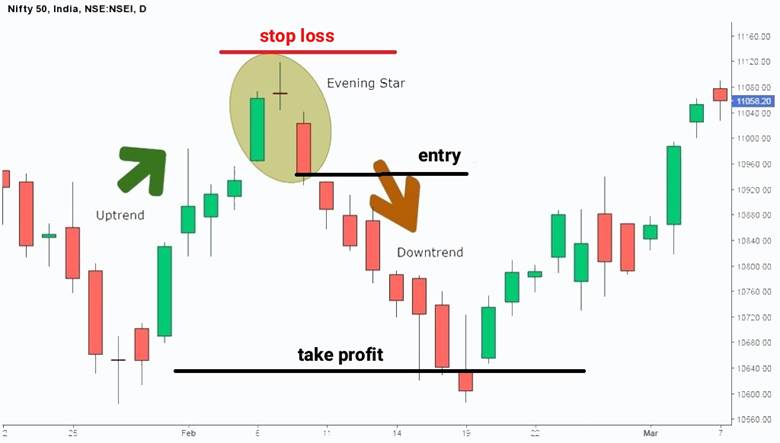
A significant rise in trading volume during the third candle strengthens the pattern’s reliability, showing that sellers have taken control of the market.

Components of the Morning Star Candlestick and How to Identify It on the Chart

The Morning Star pattern consists of three candles that appear at the end of a downtrend and indicate a possible shift toward an uptrend. The components of this pattern are as follows:

  • ·First candle: A large bearish candle that confirms the continued dominance of sellers.
  • Second candle: A small-bodied candle, usually a doji or spinning top, that shows uncertainty and balance between buyers and sellers. This candle often forms with a price gap from the first one.
  • Third candle: A large bullish candle that closes at least halfway into the body of the first candle, confirming the trend reversal.

For the pattern to be valid, the body of the second candle should not overlap with the body of the first or third candle. The appearance of this pattern near support or resistance levels, especially near strong support zones, increases its reliability. Combining it with indicators such as RSI or trading volume can further improve the accuracy of identifying this setup.

Morning Star and Evening Star

How to Trade Using the Morning Star Candlestick (Identifying Entry and Stop Loss Points)

To trade with the Morning Star pattern, first look for it at the end of a downtrend. After the third candle forms, which is a strong bullish candle showing a possible move to the upside, you can enter a buy position.

To reduce risk, place your stop loss slightly below the lowest price of the second candle. The second candle is usually a doji or a small-bodied candle that shows hesitation in the market.

For setting profit targets, look for the next resistance levels or use Fibonacci tools to find good exit points.

You can also combine this strategy with indicators such as RSI to confirm oversold conditions or with Bollinger Bands if the pattern forms near the lower band. These confirmations help make trading decisions more accurate.

If trading volume increases during the formation of the third candle, it strengthens the reliability of the pattern. With good take-profit and stop-loss management and enough practice, this method can lead to consistent and profitable trades.

Morning Star and Evening Star

Components of the Evening Star Candlestick and How to Identify It on the Chart

The Evening Star candlestick pattern is a three-candle bearish formation that appears at the end of an uptrend and signals a possible reversal to the downside.

This pattern includes three candles with the following characteristics:

  • First candle: A large bullish candle that shows buyers are still in control and price is moving strongly upward.
  • Second candle: A small-bodied candle such as a doji or spinning top that reflects hesitation and a pause in market momentum. This candle usually forms with a gap up from the first candle.
  • Third candle: A large bearish candle that closes at least halfway into the body of the first candle and confirms the trend reversal.

For the pattern to be valid, the body of the second candle should not overlap with the bodies of the first or third candles. The pattern gains more reliability when it forms near strong resistance levels.

sms-star

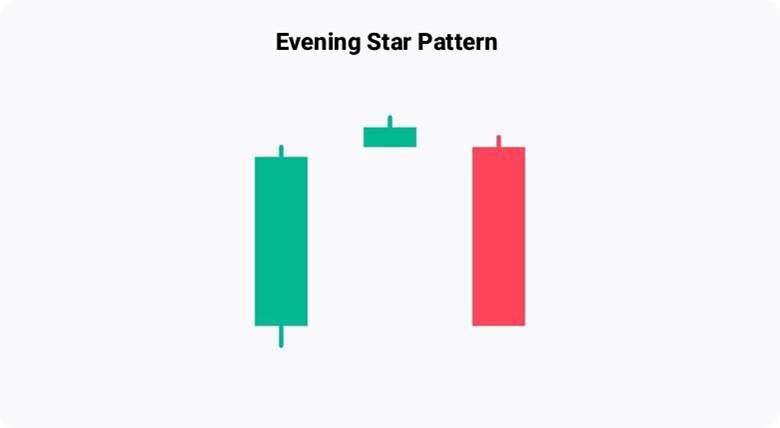
According to Investopedia, “An Evening Star is a bearish candlestick pattern that technical analysts use to identify potential reversal signals in a stock’s price trend.”

How to Trade Using the Evening Star Candlestick (Identifying Entry and Stop Loss Points)

To use the Evening Star pattern, first look for it at the end of an uptrend. When the third candle, which is a strong bearish candle, closes, you can enter a sell position in markets that allow two-way trading. This candle shows that sellers have taken control of the market.

To reduce risk, place your stop loss slightly above the highest price of the second candle, which is usually a doji or a small-bodied candle.

For setting profit targets, look for the next support levels or use Fibonacci tools to identify suitable exit points.

Morning Star and Evening Star

You can also use indicators such as MACD to confirm the downtrend or check for an increase in trading volume during the formation of the third candle for stronger confirmation.

As a reversal candlestick pattern, the Evening Star can become a powerful trading signal when practiced in a demo account and combined with tools like RSI that indicate overbought conditions. With proper risk management and enough experience, it can help lead to successful and profitable trades.

Morning Star and Evening Star

Common Mistakes in Identifying the Morning Star and Evening Star Candles

Traders sometimes make mistakes when identifying the Morning Star and Evening Star patterns, which can lead to false signals. The first common mistake is recognizing the pattern without considering the prior trend. The Morning Star must form during a downtrend, and the Evening Star must form during an uptrend.

Ignoring support and resistance levels is another error, as these levels help confirm the reliability of the pattern. Some traders also rely on the pattern alone without using confirming indicators such as RSI or MACD, which increases the risk of incorrect analysis.

Entering a trade too early, before the third candle closes, is another frequent mistake that can result in losses.

To avoid these errors, it is recommended to practice identifying these patterns in a demo account and to combine them with analytical tools such as trading volume or moving averages. Doing so can improve both the accuracy of analysis and overall trading performance.

sms-star

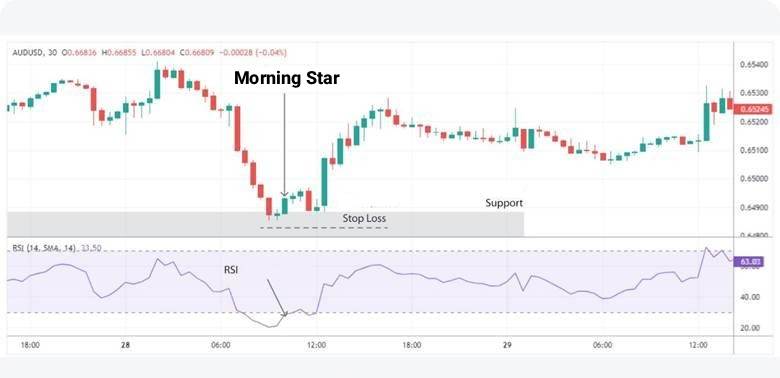
A frequent mistake is entering a trade before the third candle closes. The confirmation comes only after this candle completes, so patience is crucial for accuracy.

Conclusion

The Morning Star and Evening Star patterns are important three-candle formations in technical analysis that help traders identify potential trend reversals in markets such as Forex and stocks. They provide strong signals when used correctly, but their accuracy increases when combined with indicators like RSI, MACD, or key support and resistance levels. Traders should avoid relying on these patterns alone and instead confirm signals with additional analysis. Regular practice in demo accounts and studying historical charts can improve pattern recognition and lead to more confident and profitable trading decisions.

Continue Reading
not-found
calendar 5 November 2025
Rate this article

Leave a Reply

Your email address will not be published. Required fields are marked *

No thanks