When price candles consecutively move in one direction and the corrective space almost disappears, you are essentially observing a Micro Channel. This subtle structure is one of the key indicators of trend strength and momentum in price action. When understood correctly, it can create low-risk and highly accurate trading opportunities.
The Micro Channel strategy allows traders to enter a trade before a pullback or trend break occurs, when other traders are still waiting for confirmation. In this article, we will explore the concept of the Micro Channel, learn how to identify it on a chart, and understand how to use it alongside tools such as order blocks, supply and demand zones, and key swings to enhance entry accuracy.
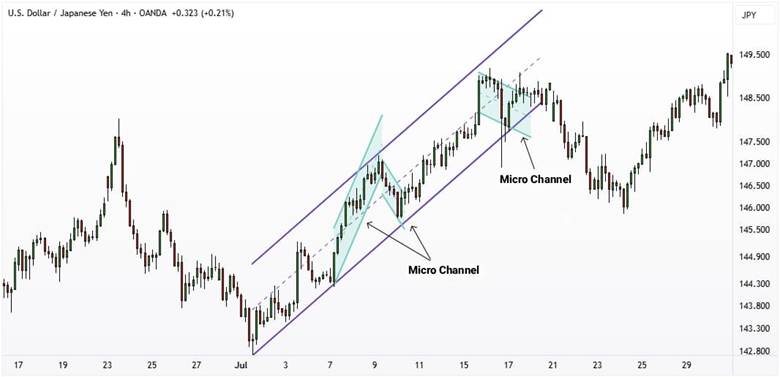
- A Micro Channel represents a phase of market strength and helps identify the true momentum before a significant move occurs.
- Precision in recognizing the structure and angle of the Micro Channel movement can make the difference between an early entry and a timely one.
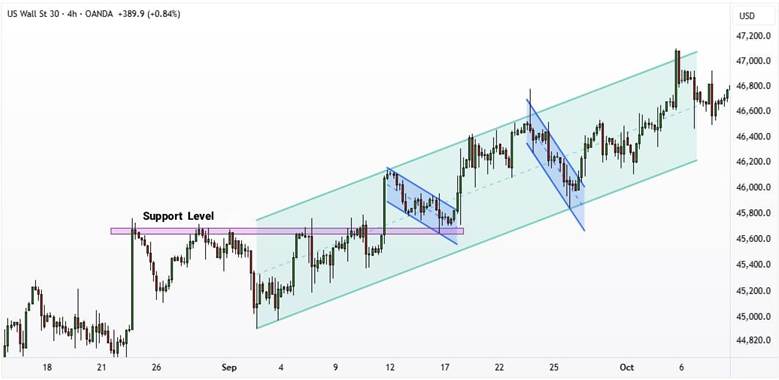
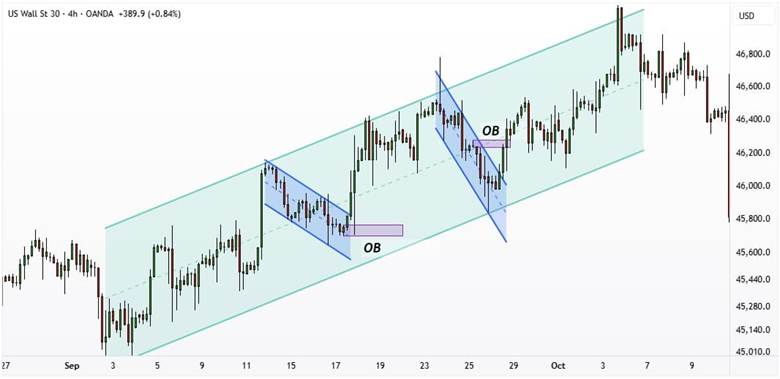
- Combining the Micro Channel with concepts like market structure, order blocks, and key levels enhances the validity of signals.
- Mastering Micro Channel analysis requires consistent practice, chart review, and experience in real-market conditions.
What is a Micro Channel and Why is it Important for Traders?
In price action analysis, a Micro Channel simply refers to a period where the price moves in a specific direction with consecutive candles, without a significant retracement. According to Al Brooks, when the market is in a micro channel, it means the strength of buyers or sellers is so strong that the price has little opportunity to reverse.
A Micro Channel typically forms between two to ten candles and represents strong and sustained momentum. Understanding what a micro channel is holds great importance for traders because it can highlight moments when the market is still in the early stages of its move, and entering at this stage offers lower risk compared to other times.
This structure helps identify fake breakouts more easily, allowing traders to recognize when a trend is truly continuing. For this reason, utilizing the Micro Channel strategy is highly valuable for both novice and experienced traders, as it enables more accurate entries, logical stop loss placement, and better position management.
When a Micro Channel forms and the candles have large bodies with small wicks, the likelihood of a deep corrective phase forming becomes much lower. In other words, this characteristic can be a strong indication that the first pullback is unlikely to reverse the trend.
The Difference Between Micro Channels and Traditional Price Channels
Price channels are among the most important tools for analyzing market behavior, but there are significant differences between traditional channels and micro channels.
In a standard price channel, price moves between two parallel lines and goes through multiple retracements or pullbacks along the way. This structure usually has a gentler slope and is visible on the chart over a longer period. Traders typically enter trades at the end of these pullbacks to take advantage of the continuation of the trend.
In contrast, a micro channel is a much tighter and shorter-term structure, often consisting of only a few candles. In this case, the price moves with strong momentum and minimal correction, leaving very few opportunities to enter during retracements. Essentially, in such conditions, small breakouts tend to continue the trend rather than reverse it.
This characteristic makes the micro channel strategy particularly valuable for traders who operate in fast-moving or highly volatile markets.
If we look at the concept of a spike and channel pattern in price action, there are some similarities to a micro channel since both indicate strong directional strength. However, the key differences are as follows:
- A spike channel is typically a short, steep channel with high momentum, often signaling trend continuation after an explosive move.
- A micro channel, on the other hand, shows a smooth and consistent price movement, providing short-term entry and exit opportunities during minor corrections.
Understanding the difference between a spike channel and a micro channel helps traders decide whether to enter during retracements or to trade in sync with sharp trend movements.
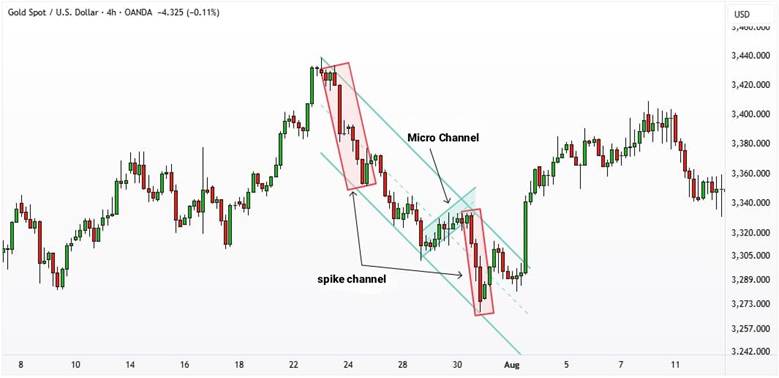
According to TradingPedia, traditional channels are areas of frequent pullbacks, whereas in a micro channel, the price can move several times without any significant retracement, turning it into a new momentum phase.
Main Components of a Micro Channel and How It Forms
To better understand the structure of a micro channel, we first need to recognize its main components. Each micro channel consists of two parallel lines:
- The lower line, which usually acts as short-term support;
- The upper line, which serves as short-term resistance.
These two lines define the range of price movement and indicate the overall direction of the trend. Accurate trendline drawing is crucial, as the formation and continuation of the micro channel are based on it.
A micro channel typically forms during strong trending conditions, often after a sharp move or spike, when the market enters a phase of temporary consolidation. In this situation, candles appear consecutively with minimal retracement, and the distance between their highs and lows is very small. This condition signals the continuation of strength in the direction of the main trend and shows that buyers or sellers are still in control of the market.
If a micro channel extends beyond roughly ten candles, it is highly likely to transition into a trading range phase. This means traders should not only recognize its formation but also be able to identify the signs of its conclusion.
How to Identify a Micro Channel on the Chart
To identify a micro channel on a chart, start by looking for several consecutive candles moving in the same direction with a relatively consistent slope. This structure typically forms between two and ten candles and indicates sustained strength from either buyers or sellers.
Next, draw two parallel lines through the highs and lows of these candles. The lower line acts as support, while the upper line serves as resistance. When candles move within this narrow range, it means the market is in a momentum phase, with no clear signs of a deep correction yet. Using the available tools in TradingView to draw these lines can make identifying the structure much easier.
In the third step, pay attention to volume and price behavior around these lines. Stable or declining volume usually suggests a continuation of the trend. Additionally, spotting candlestick patterns such as Pin Bars or Inside Bars near the channel boundaries can provide strong confirmation for an entry. Finally, when the price breaks out of the channel or makes a small pullback, it often creates an ideal opportunity to trade in the direction of the main trend.
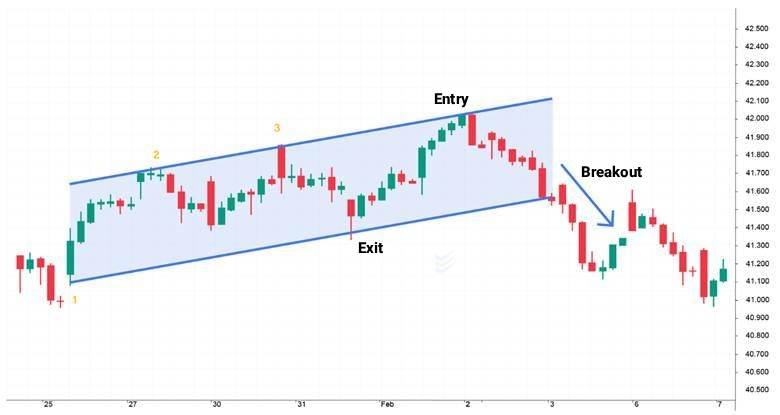
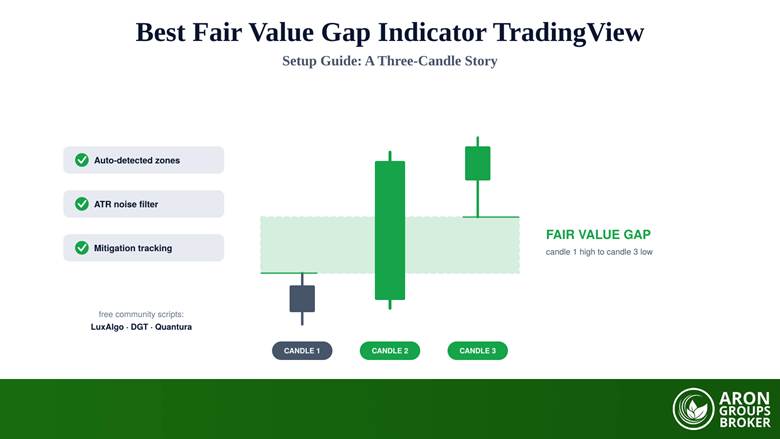
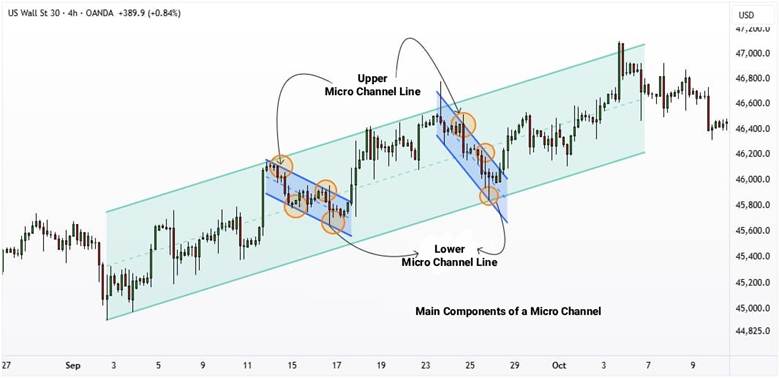
To draw the line corresponding to this structure, simply identify two consecutive candles, then use the third candle to confirm the trend against that line. If the third candle closes on or above the line, the trend is confirmed; otherwise, there is a likelihood that the structure is weakening.
How to Trade with a Micro Channel
For price action traders, understanding how to enter and exit within a micro channel structure is highly important. In the micro channel strategy, the main focus is on compact movements with little or no correction, where the market moves strongly in a clear direction. In such a situation, the trader must know how to use this price momentum for precise and low-risk entries. The best time to trade is usually when the price breaks out of the channel and then returns to the previous range, because in most cases this breakout is false and the main trend continues.
How to Identify Suitable Entry Points at the End of a Corrective Phase
In a small corrective phase, usually one or two candles move against the main direction. When this correction is ending and a reversal candle appears in the direction of the trend, it can be a good signal for entry.
For example, if the market is in an uptrend and the price temporarily moves below the lower boundary of the channel but quickly reverses back, it can be a good buying opportunity. In some cases, such movements occur within a trading range and indicate the end of correction and the return of strength to the market.
How to Set Stop Loss and Take Profit Based on the Micro Channel Structure
In micro channel-based trades, the stop loss is usually placed slightly outside the channel to prevent being hit by small fluctuations. In an uptrend, the stop loss is placed below the bottom of the channel, and in a downtrend, above its top.
The take profit is usually placed on the opposite side of the channel or based on the size of the recent move. A minimum risk-to-reward ratio of one to two is recommended to maintain long-term profitability.
Combining the Micro Channel with the Main Market Trend
When a micro channel forms in the direction of the main trend, the probability of success is much higher. In practice, the trader should first identify the dominant trend and then enter in its direction. For example, in a strong uptrend, if a bullish micro channel forms, it can be a sign of trend continuation.
Combining Micro Channels with Support and Resistance Support
The strength of micro channel signals increases when they align with key support and resistance levels. When the price forms a bullish micro channel near a support level or a bearish micro channel near a resistance level, the probability of a successful trade is much higher. This confluence between price structure and key levels helps traders enter the market with greater confidence and take advantage of major price movements.
Using Order Blocks and Market Structure Alongside Micro Channels
One of the best methods to increase analysis accuracy is to combine the concept of the micro channel with order blocks and market structure. An order block refers to areas where a large volume of orders has accumulated, and the price usually reacts from those zones. When these areas align with market structure patterns such as higher highs and higher lows (HH and HL) or lower lows and lower highs (LL and LH), the strength of the signal increases.
For example, if the price enters a micro channel phase after reacting to a bullish order block, while the market structure simultaneously shows signs of trend continuation, the probability of a successful trade increases significantly. According to the article “Further Talk on Micro Channels,” the convergence of an order block, market structure, and the tight movement within a micro channel can identify the most optimal entry points in the direction of the trend.
The Role of Breakouts and Pullbacks in Confirming Signal Validity
In trading strategies based on the micro channel, paying attention to breakouts and pullbacks is crucial. Sometimes the price breaks out of the channel, giving the impression that the trend is about to reverse, but then quickly returns. This situation is usually known as a false breakout and can serve as a strong signal to enter in the direction of the main trend.
For example, if the price breaks above the upper boundary of a bullish micro channel and then pulls back, the next retracement may provide a good entry opportunity. This small return to the channel boundary often confirms that the breakout was false and that the trend is still continuing. Combining this behavior with confirming candlesticks and appropriate volume creates one of the most reliable signals for entering a trade.
Conclusion
In the end, understanding what a micro channel is can make a big difference in the accuracy of trade entries and exits. This simple yet powerful structure helps traders identify moments when the market is gathering strength to continue its movement. Using it correctly, especially when combined with concepts such as market structure and key levels, can reduce risk and increase the chances of success.
However, it is recommended to first test all these concepts on a demo account to gain a deeper understanding of price behavior and how micro channels form. By practicing repeatedly and reviewing past trades, you can enhance your skills in analyzing and executing this method with greater precision.