


One of the most essential tools for technical analysis in financial markets is the MACD indicator. It helps traders identify changes in market trends. By comparing two moving averages, this indicator generates buy and sell signals and helps traders determine entry and exit points. Using the MACD indicator can make trading decisions more precise and profitable. If you want to learn how to use this tool in your trades and find its optimal settings, don’t miss the rest of this article. In this guide, we will thoroughly examine the MACD and explain how to use it effectively.

- Using the MACD indicator alone may not be sufficient and should be combined with other tools to achieve a more accurate analysis.
- Customized MACD settings, tailored to the specific type of trading strategy, can enhance the accuracy of signals.
- The MACD indicator is primarily used to confirm trends rather than to predict market movements.
- Divergences in the MACD can signal potential trend reversals, but they should always be analyzed cautiously and in conjunction with other tools.
What is the MACD Indicator?
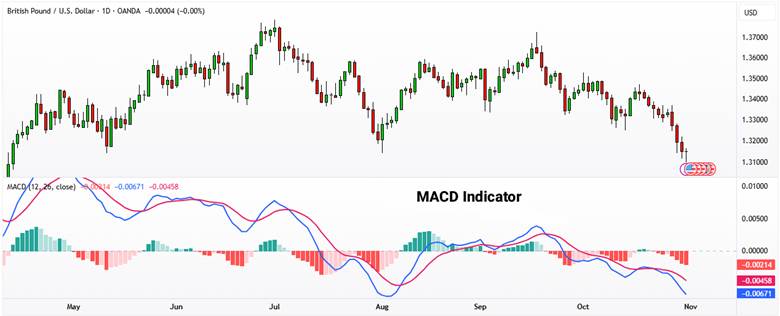
The MACD, short for Moving Average Convergence Divergence, is one of the most popular tools in technical analysis used in financial markets. It helps identify price trends and possible reversal points. The indicator compares two moving averages, one faster and one slower, to help analysts anticipate changes in market direction. The MACD is especially useful for detecting divergences and crossovers that can provide buy or sell signals.
Traders use the MACD widely because it is simple and highly accurate in recognizing market trends. It works well for both long-term and short-term analysis. The MACD can quickly detect changes in trend direction and offer trading signals for buying or selling. For this reason, it is considered an essential tool for every technical analyst.
Main Components of the MACD Indicator
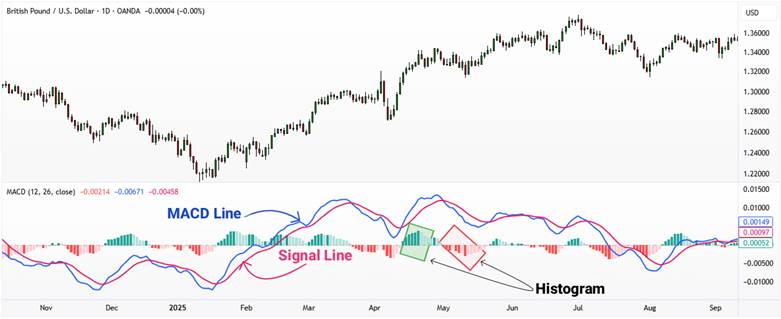
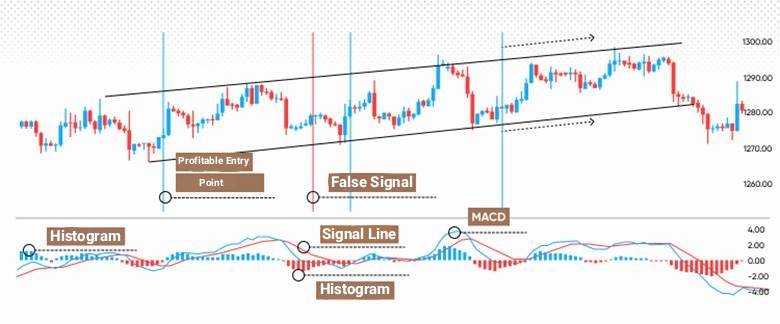
The MACD indicator consists of three main components, each playing a key role in analyzing market trends. These components are the MACD Line, the Signal Line, and the Histogram. Each one provides important information about market momentum and trend direction.
MACD Line
The MACD Line represents the difference between two Exponential Moving Averages (EMAs), one short-term and one long-term. Typically, the 12-day and 26-day EMAs are used for this calculation. This line reflects the momentum of the market.
When the MACD Line is above zero, it indicates an uptrend, and when it is below zero, it signals a downtrend. Crossing the zero level can be seen as a sign of a potential trend reversal from bearish to bullish or vice versa.
Signal Line
The Signal Line is a 9-day Exponential Moving Average derived from the MACD Line. It is used to generate crossover signals. When the MACD Line crosses above the Signal Line, it produces a buy signal. When it crosses below the Signal Line, it indicates a sell signal. These crossovers help traders identify entry and exit points more effectively.
Histogram
The Histogram shows the difference between the MACD Line and the Signal Line, displayed as bars below the price chart. These bars help traders visualize the strength of market momentum. The taller the bars, the stronger the current trend. When the histogram starts to shrink or move closer to zero, it suggests that a potential trend reversal may occur. This component is particularly useful for measuring the speed of price changes and the strength of the trend.
The settings of the MACD indicator, such as the periods used for the EMAs, can vary depending on individual trading strategies.

According to StockCharts, Contrary to popular belief, the MACD histogram is not only used to show the strength of a trend. It also helps traders anticipate when a trend might reach an exhaustion point or potentially reverse.
How to Trade Using the MACD Indicator
To use the MACD indicator effectively in Forex trading, it is important to understand how it generates buy and sell signals and how it can help identify trend changes or distinguish between short-term and long-term opportunities. Below, we will review each aspect step by step with clear explanations.
- How to Generate Buy and Sell Signals with the MACD Indicator
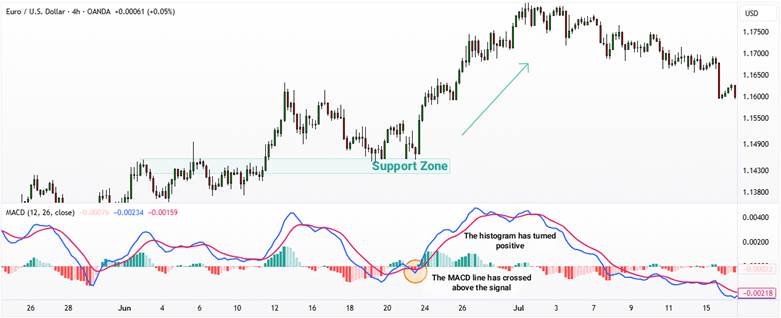
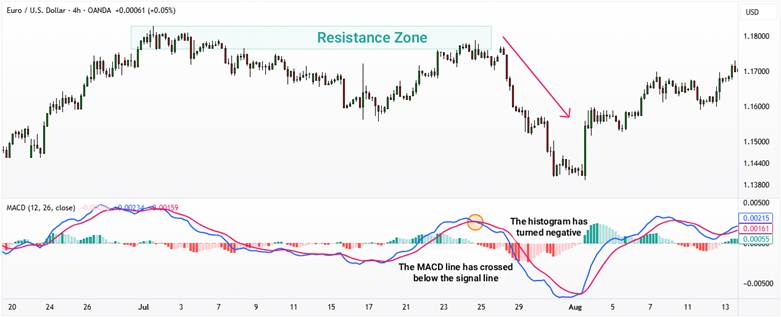
Buy Signal: When the MACD Line crosses above the Signal Line from below, it indicates a potential reversal from a downtrend to an uptrend. If the histogram also turns positive (bars move above the zero line), it provides additional confirmation for entering a buy (long) position.
Pro Tip: The buy signal becomes more reliable when this crossover occurs near a support zone or after a bullish divergence.
Sell Signal: Conversely, when the MACD Line crosses below the Signal Line from above, it signals weakening bullish momentum and a possible start of a downtrend. If the histogram falls below the zero line, it strengthens the confirmation for entering a sell (short) position.
Pro Tip: This signal tends to be stronger when the crossover happens near a resistance zone or after a bearish divergence.
Signal Confirmation: To increase the reliability of MACD signals, it is recommended to combine them with other confirming tools such as the RSI indicator, support and resistance levels, or price action analysis. This combination can significantly reduce trading errors and improve decision-making accuracy.
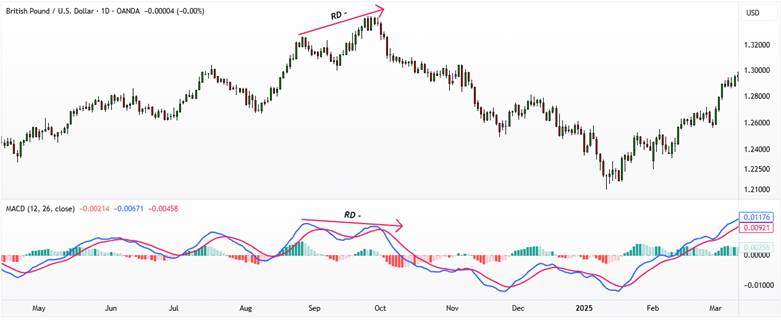
- Identifying Trend Reversals Using Divergence in MACD
Divergence is another important component of the MACD indicator that can help you identify potential trend reversals. Divergence occurs when the MACD line and the market price move in opposite directions. For example, if prices are falling but the MACD line is rising, it forms a bullish divergence, which may indicate a possible shift to an upward trend.
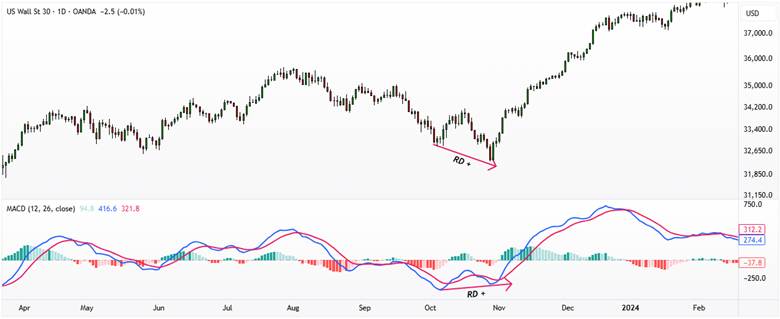
On the other hand, when prices are moving higher but the MACD line is declining, it creates a bearish divergence, suggesting a potential reversal to a downtrend. According to Investopedia, divergences that appear within stronger trends are generally considered more reliable.
- The Difference Between Short-Term and Long-Term Signals in MACD
The MACD indicator can generate signals for both short- and long-term trades, but the nature of these signals differs between the two.
In short-term signals, traders usually work with lower timeframes such as M15, M30, or H1. In these cases, a quick crossover of the MACD line above or below the signal line indicates a short-term entry opportunity. However, these signals tend to be short-lived and are more prone to market noise. The goal of such trades is often to capture a few dozen pips within a limited time period.
In contrast, long-term MACD signals are more meaningful on higher timeframes such as H4 or daily charts. In this situation, crossovers happen less frequently, but the resulting trends are stronger and more reliable. MACD divergences on higher timeframes carry more weight and often signal major shifts in market direction.
For effective use of the MACD indicator, it is best to confirm short-term signals only when they align with the overall direction of the higher timeframe. This approach reduces the risk of false signals and greatly improves the quality of trading decisions.
To avoid false signals in ranging markets, it is better to use MACD crossover signals only when the price has broken through a strong support or resistance level. This approach increases the accuracy of the analysis.
Activating and Setting Up the MACD Indicator in MetaTrader and TradingView
To use the MACD indicator effectively in technical analysis, you first need to know how to activate and adjust it on different trading platforms. Below, we explain the steps for setting up the MACD in MetaTrader and TradingView with simple instructions, followed by the best settings for day trading and long-term timeframes.
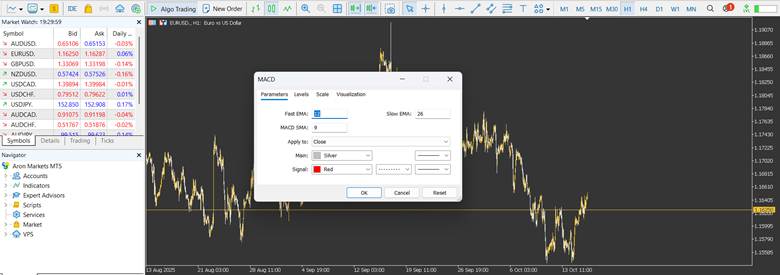
How to Activate and Adjust the MACD Indicator in MetaTrader
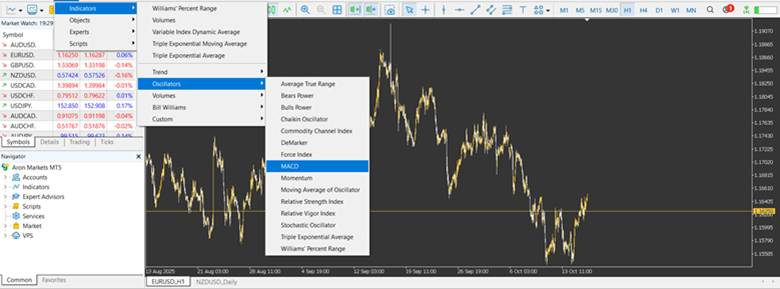
To activate the MACD indicator in MetaTrader, click on the Insert tab at the top of the platform. Then go to Indicators, select Oscillators, and finally choose MACD. After completing these steps, the indicator will appear on your chart.
The default MACD settings include EMAs with periods of 12, 26, and 9. These settings are suitable for most traders; however, you can modify them according to your specific strategy. You can also customize the colors and styles to make the chart visually clearer. With proper adjustments, the MACD indicator helps you easily identify market trends.
In MetaTrader, to reduce the number of false signals, MACD settings can be enhanced by adding an additional moving average to the signals. This method helps minimize noise and improve the accuracy of the signals.
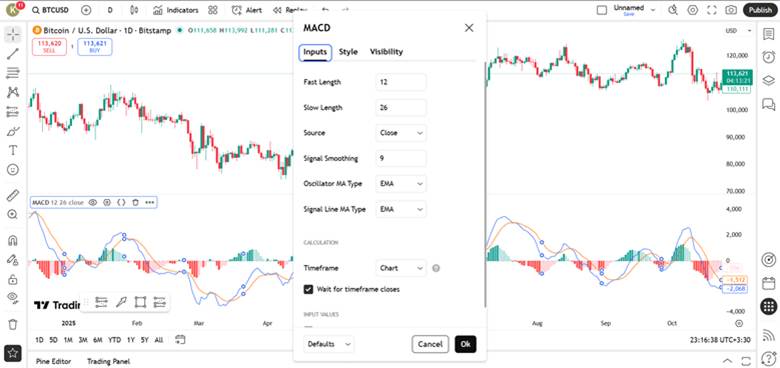
How to Activate and Adjust the MACD Indicator in TradingView
In TradingView, to add the MACD indicator, go to the Indicators section and search for “MACD.” Then, add it to your chart. Once the indicator appears, you can modify its settings as needed.
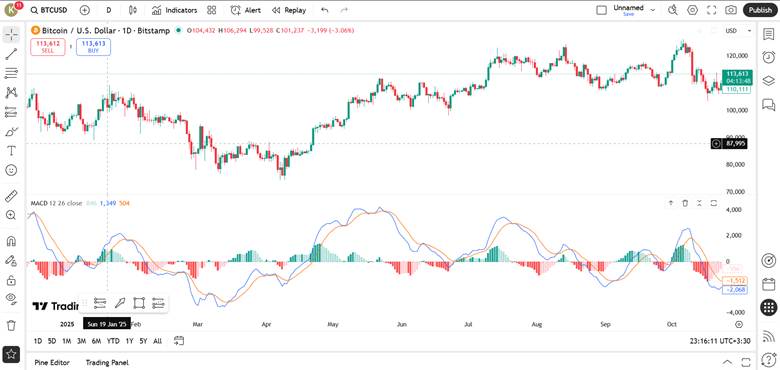
The most important parameters are Fast Length and Slow Length, which are usually set to 12 and 26. However, if you want to customize the MACD according to your trading strategy, you can change these values based on your preferences.
Best MACD Settings for Day Trading
For day trading, where faster signals are required, it is better to use settings that make the MACD more sensitive to market movements. To achieve this, change the MACD settings to 5, 13, and 9. This setup allows the indicator to react quickly to price changes, helping you enter and exit trades at the right time.
Best MACD Settings for Long-Term Timeframes
For longer timeframes, where more stable and accurate signals are preferred, the recommended settings are 19, 39, and 9. These parameters help filter out unnecessary market noise and highlight only strong, sustainable trends. Such settings are especially useful for identifying reliable long-term trading opportunities.
The Difference Between Classic MACD and MACD Histogram
The MACD indicator comes in two main versions, known as the Classic MACD and the MACD Histogram. Each version has its own specific use in market analysis. Below is an explanation of their differences.
Classic MACD Version
The classic version of the MACD indicator includes two main lines: the MACD line and the signal line. Until 1986, this version did not include the histogram. Its main focus is on crossovers between the MACD line and the signal line to identify buy and sell signals. The classic MACD is mostly used for long-term analysis and for identifying major market trends.
MACD Histogram Version
In the histogram version of MACD, in addition to the two main lines, a histogram is displayed that shows the difference between the MACD line and the signal line as bars. The histogram helps traders detect changes in market momentum more quickly and recognize potential trend shifts in time. This version is especially useful for short-term timeframes.
Which MACD Version Is More Accurate for Traders?
For short-term traders who need faster signals, the MACD histogram version is more accurate because the histogram can detect market changes earlier than the classic version. However, for long-term analysis, the classic MACD provides greater accuracy in identifying stable trends.
In conclusion, each version of the MACD is designed for different trading strategies, and the choice between them depends on the trader’s needs. When comparing its accuracy to other indicators such as the RSI, it can be said that the precision of each depends on how it is used and the selected timeframe.
Advantages and Limitations of the MACD Indicator
The MACD indicator is a powerful tool for identifying trends and analyzing market momentum. One of its main advantages is its ability to detect trend changes across different markets. It can effectively simulate entry and exit points, making it highly useful in MACD training and technical analysis.
However, the MACD also has certain limitations. One of its main drawbacks is that it is a lagging indicator, meaning its signals usually appear with some delay. In ranging market conditions, the MACD may also generate false signals, which can confuse traders. Despite these limitations, the MACD remains one of the most practical and reliable tools in technical analysis.
The MACD indicator is more suitable for analyzing trending markets. In range-bound or volatile markets, it usually does not provide accurate signals, and the reliability of the analysis decreases.
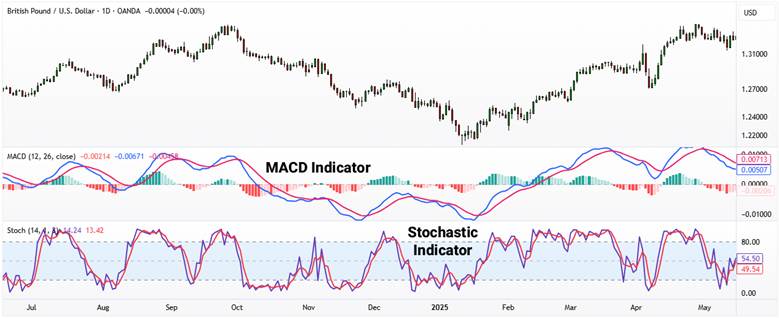
The Difference Between MACD and Stochastic
َAccording to FXSSI, the MACD indicator is mainly known as a trend-following indicator. It generates buy and sell signals based on the crossover of two lines (the MACD line and the signal line) as well as crossovers through the zero line. This indicator is better suited for identifying market trend changes and generally produces lagging signals. For this reason, MACD works best in markets that move within a clear trend.
On the other hand, the Stochastic indicator is an oscillator designed to identify overbought and oversold conditions in the market. It compares the closing price of an asset to its price range over a specific period. As a result, the Stochastic can generate buy and sell signals more effectively in markets without a clear trend or in range-bound conditions. It also performs better in detecting divergences.
In conclusion, both MACD and Stochastic are powerful tools, and the choice between them depends on the market conditions and the trader’s strategy.
Conclusion
The MACD indicator is a powerful tool for analyzing trends and identifying changes in market momentum. It can help traders simulate buy and sell signals effectively. In this article, we explained how to use this indicator in detail and examined its application in different market conditions. To gain more experience, it is recommended to practice using the MACD indicator in a demo environment and combine it with other analytical tools such as candlestick patterns and moving averages. With practice and proper use of this indicator, you can perform more accurate analyses and improve your trading strategies.