


The Fisher Transform Indicator, developed by John F. Ehlers, is one of the key analytical tools used in financial markets. This indicator transforms price data into a Gaussian normal distribution (a bell-shaped curve), helping traders identify market turning points more easily.
Simply put, the Ehlers Fisher Transform amplifies price movements, making overbought and oversold zones more visible. As a result, it becomes highly effective for detecting trends, generating Fisher Transform buy/sell signals, and improving overall decision-making in technical analysis.

- The Fisher Transform Indicator performs best in highly volatile markets because it reacts more quickly to price changes.
- Combining the Ehlers Fisher Transform with support and resistance levels can generate highly accurate reversal signals.
- On lower timeframes (such as 1-minute or 5-minute charts), the Fisher Transform Indicator tends to produce more noise, making higher timeframes more reliable.
- This indicator allows for easy backtesting of trading strategies, making it useful for evaluating how fast a Fisher Indicator Strategy responds to market movements.
What Is the Fisher Transform Indicator and What Does It Do?
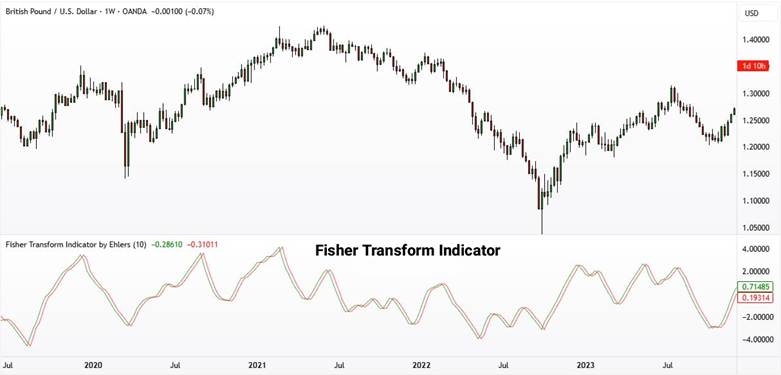
According to TrendSpider, the Fisher Transform Indicator is an oscillator that fluctuates around the zero line. Positive values indicate bullish momentum, while negative readings signal bearish strength. The main applications of the Ehlers Fisher Transform include:- Identifying trend reversal points
- Evaluating the strength and direction of momentum
- Combining it with other tools, such as MACD or the RSI indicator for more accurate signals
- Detecting Fisher Transform divergence between price and the indicator
Formula and Calculation Method of the Indicator
The calculation of the Fisher Transform Indicator consists of several steps:
- Determining the highest price (High) and lowest price (Low) over a selected period
- Finding the midpoint
- Normalizing the data using the following formula (based on the uploaded image):
Formula:

1 − [(Price − Low) × 2] ÷ (High − Low) = Value
- Applying the natural logarithm and the hyperbolic tangent function to transform the data
- Smoothing the results using a moving average
This formula magnifies even small price movements, making trend shifts easier for the trader to detect.
How to Trade Using the Fisher Transform Indicator
The Fisher Transform Indicator typically consists of two lines:
- The Fisher Line;
- The Signal Line.
These two lines oscillate above and below the zero level. Signals are usually generated when the lines cross or when the indicator crosses the zero line.
1. Buy Signal
A buy signal forms under two conditions:
- When the Fisher Line crosses above the Signal Line
- Or when the indicator shifts from negative territory to positive by crossing above zero
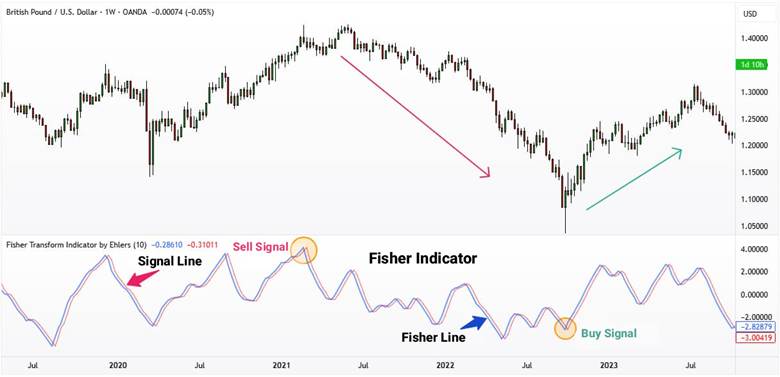
In the referenced chart, the candlestick chart is displayed at the top, and the Fisher Transform Indicator with its signal line appears below it. The label “Buy Signal” refers to the exact moment when:
- The Fisher Line crosses the Signal Line to the upside.
- The indicator rises from below zero and moves into positive territory.
This behavior suggests that buying pressure is increasing, and a potential bullish trend may be starting.
2. Sell Signal
A sell signal occurs when:
- The Fisher Line crosses below the Signal Line.
- Or when the indicator falls from positive territory into negative territory.

The chart shows one of the most common sell signal patterns using the Ehlers Fisher Transform:
- The Fisher Line was previously rising above zero.
- Suddenly, it crosses below the Signal Line.
- The indicator exits the positive zone and shows clear downward pressure.
This warns the trader that sellers are gaining strength and a bearish trend may be emerging.
In conditions where the market is moving sideways with low volatility, the Fisher Transform Indicator often generates signals earlier than RSI or Stochastic.
3. Divergences (Fisher Transform Divergence)
Like other oscillators, the Fisher Transform Indicator can reveal divergence between price and momentum:
- If price forms a new high but the indicator fails to make a new high, this indicates bearish divergence and may signal a potential drop.
- If price creates a new low but the indicator does not form a new low, this indicates bullish divergence and may signal an upcoming upward move.
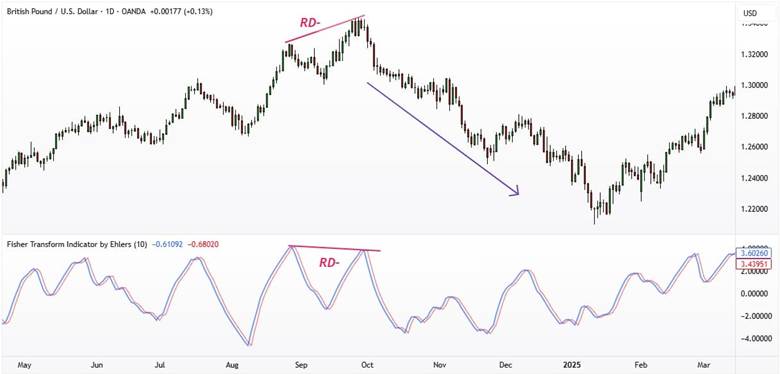
When price continues creating higher highs but the Fisher Line fails to confirm those highs, this mismatch is known as bearish divergence often considered an early warning of a possible market reversal to the downside.
Combining the Fisher Transform Indicator with the MACD Indicator
To confirm signals when combining the Fisher Transform Indicator with the MACD indicator:
- MACD is a momentum and trend indicator that shows the strength and direction of market movement.
- The Fisher Transform reveals trend changes faster than MACD.
- When both indicators generate the same signal at the same time (for example, both turning bullish or both turning bearish), the probability of a successful trade increases.
In the chart described:
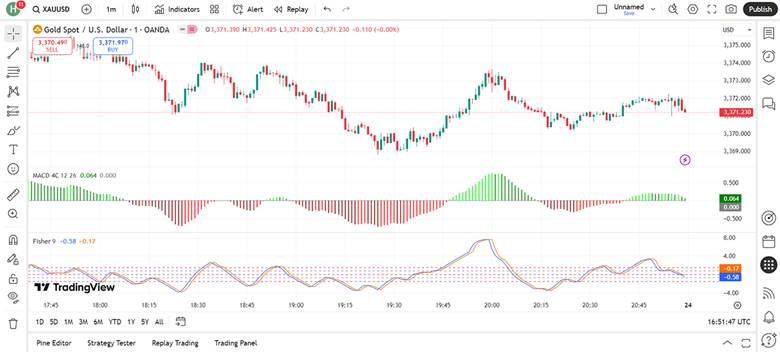
- In the middle section, the MACD (with green and red histogram bars) is displayed.
- In the lower section, the Fisher Transform appears with two lines (blue and orange).
Example:
- Around 19:45, MACD turns positive (green histogram).
- At the same time, the Fisher Transform rises from negative to positive territory.
- This alignment indicates the beginning of a short-term bullish trend and acts as a confirmed buy signal.
Conversely, when the MACD histogram moves into negative territory and the Fisher Transform drops below zero, the sell signal becomes stronger.
Combined Strategy
- Enter a trade only when the Fisher Transform and MACD are aligned.
- If both are bullish, it is a buy signal.
- If both are bearish, it is a sell signal.
- Exit the trade when one of the indicators contradicts the other.
Conclusion: Combining the Fisher Transform Indicator with MACD helps reduce false signals generated by Fisher alone and provides stronger confirmation for entry and exit points.
If the Fisher Transform Indicator is applied to volume-weighted price data, it will provide a more accurate and reliable reaction to real changes in demand, rather than producing false or distorted fluctuations.
Combining the Fisher Transform Indicator with the RSI Indicator
RSI identifies overbought zones (above 70) and oversold zones (below 30), while the Fisher Transform Indicator pinpoints price direction changes with greater accuracy.
Combining both indicators filters signals and helps reduce false alerts generated by Fisher alone.
In the chart described:
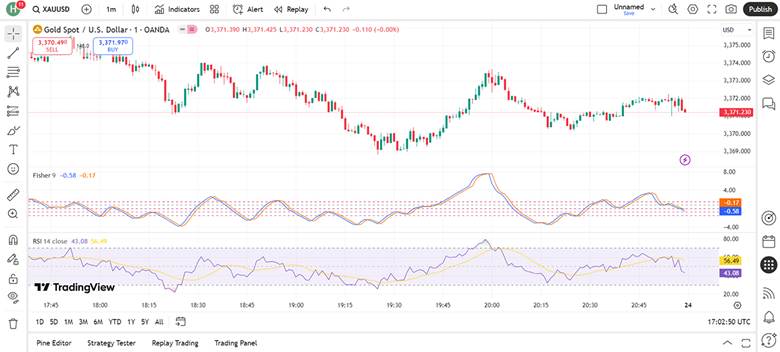
- In the second section (Fisher Transform), the blue and orange lines are shown.
- In the third section (RSI), the central 30–70 range is highlighted.
Example:
Around 18:30:
- RSI approaches the oversold zone (below 30).
- At the same time, the Fisher Transform turns upward from negative territory.
The combination of these signals shows that bearish momentum is weakening and a potential bullish move may begin, forming a stronger buy signal.
Around 20:00:
- RSI moves toward the overbought zone (above 70).
- Fisher also forms a peak and begins to turn downward.
This alignment creates a confirmed sell signal.
The Fisher vs RSI combination helps traders reduce fake signals and enter trades only when both momentum and trend-shift confirmation align.
Advantages and Disadvantages of the Fisher Transform Indicator
Like any technical tool, the Fisher Transform Indicator has its own strengths and limitations. Below is a detailed breakdown of both.
Advantages of the Fisher Transform Indicator
The main benefits of this indicator include:
- Fast identification of reversal points: It amplifies small price movements, allowing it to generate reversal signals earlier than many other indicators.
- Ease of use: Despite involving complex calculations, its output is simple and easy to interpret (values moving above or below the zero line).
- Ability to combine with other indicators: Especially effective when paired with MACD or RSI, which helps reduce false signals.
- Useful across multiple timeframes: Applicable to short-term scalping, as well as medium- and long-term analysis.
- Clear visualization of overbought/oversold conditions: Like other oscillators, it clearly highlights when the market is in overbought or oversold territory.
Applying the Fisher Transform Indicator to a Renko chart or a Kagi chart removes a significant portion of market noise, turning it into a highly effective tool for identifying price cycles.
Disadvantages of the Fisher Transform Indicator
The main limitations of this indicator include:
- False signals in ranging markets: In sideways and low-trend conditions, line crossings can easily generate misleading signals.
- Lag in signal confirmation: Like most indicators, it requires confirmation from price action or additional tools.
- High dependency on period settings: Choosing too short or too long a lookback period can significantly affect the accuracy of the signals.
- Excessive sensitivity to small fluctuations: On lower timeframes, it may generate considerable noise.
- Should not be used alone: Relying on the indicator by itself can be risky; it is best used alongside price action or other technical indicators.
Installing and Configuring the Fisher Transform Indicator in MetaTrader and TradingView
To use the Fisher Transform Indicator effectively, you first need to install it on your trading platform and adjust the basic settings. The process differs slightly depending on whether you are using MetaTrader or TradingView. Below, you’ll find a step-by-step guide for installing and customizing the indicator on both platforms so you can get the most accurate Fisher Transform signals.
Installing and Configuring the Fisher Transform Indicator in MetaTrader (MT4/MT5)
Follow the steps below to install and set up the Fisher Transform Indicator in MetaTrader:
- Installation
- Copy the indicator file (with the .ex4 or .mq4 extension) into the Indicators folder located in the MQL4 or MQL5 directory.
- Restart MetaTrader.
- From the menu, go to Insert > Indicators > Custom and select Fisher.
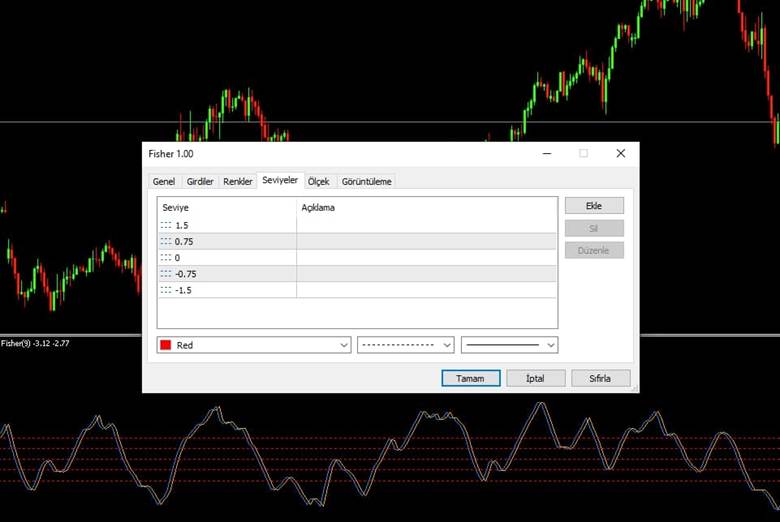
Main Settings in MetaTrader
- Period: Usually set to 9.
- Levels: Adding ±0.75 or ±1.5 helps highlight overbought and oversold areas.
- Line colors: For better readability, the main line is often set to blue, and the signal line to orange.
Installing and Configuring the Fisher Transform Indicator in TradingView
Follow the steps below to add and customize the Fisher Transform Indicator in TradingView:
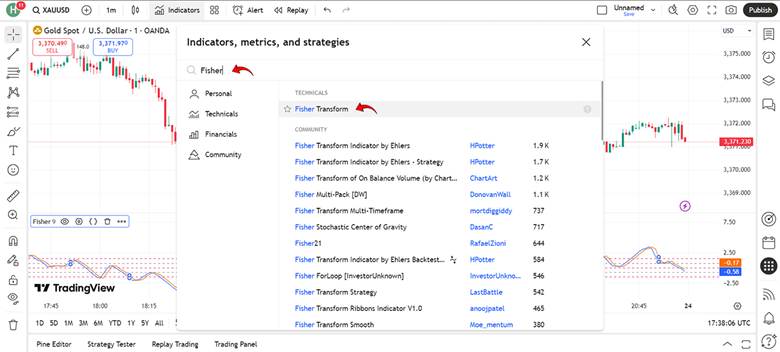
- Adding the Indicator
- Log in to your TradingView account.
- Click Indicators on the top bar of the chart.
- In the search box, type Fisher Transform.
- Select Fisher Transform by Ehlers or other similar versions.
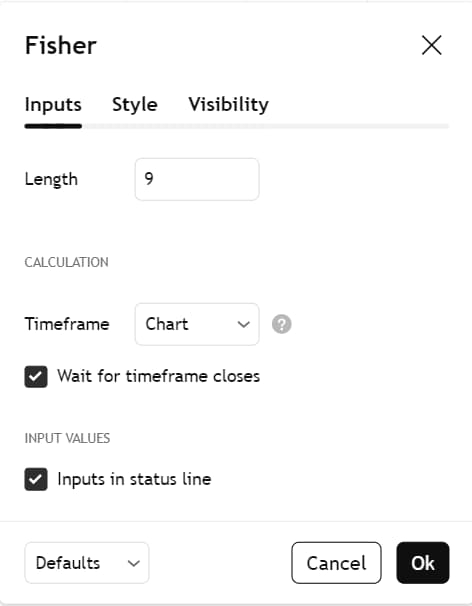
- Fisher Settings in TradingView
- After adding the indicator, click on it to open the settings window.
- Length: The default is 9 (you may adjust to 10 or 13 depending on your strategy).
- Style: Customize the line colors and the appearance of positive/negative zones.
- Visibility: Choose the timeframes on which the indicator should be displayed.
Common Mistakes When Using the Fisher Transform Indicator
To better understand the effectiveness of the Fisher Transform Indicator, it’s important to recognize the mistakes traders often make when working with it. Below are the most common errors and how to avoid them.
1. Using Fisher Alone
Many beginner traders rely solely on Fisher signals for entering trades. This is risky because the Fisher Transform Indicator by itself cannot determine the overall market trend.
2. Ignoring Ranging Market Conditions
In sideways or low-volatility markets, Fisher frequently generates multiple signals, many of which are false.
3. Incorrect Period Settings
Choosing a period that is too short increases noise and creates inaccurate signals.
On the other hand, selecting a period that is too long causes significant delays in signal generation.
4. Lack of an Exit Strategy
Some traders focus only on entry signals from Fisher and fail to define an exit point or stop-loss. This often leads to large losses when a signal fails.
5. Misinterpreting Divergences
Beginners sometimes treat every small difference between price and Fisher as a divergence.
This can result in premature entries and unnecessary losses.
Conclusion
The Fisher Transform Indicator is a powerful tool for identifying reversal points, overbought and oversold conditions, and trend confirmation. By amplifying small price movements, it gives traders a clearer view of momentum shifts. However, like any technical indicator, it is not sufficient on its own.
The Fisher Transform performs best when combined with other tools, such as MACD, RSI, or price action analysis. When used correctly and as part of a complete trading strategy, it can significantly reduce trading errors and provide more reliable entry and exit points.