


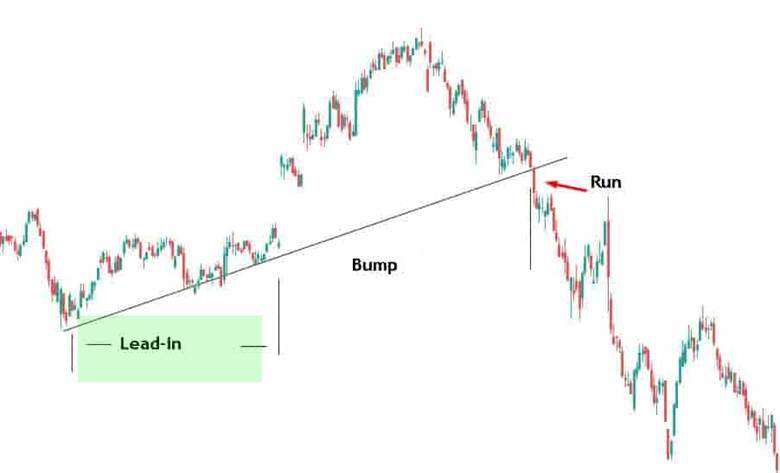
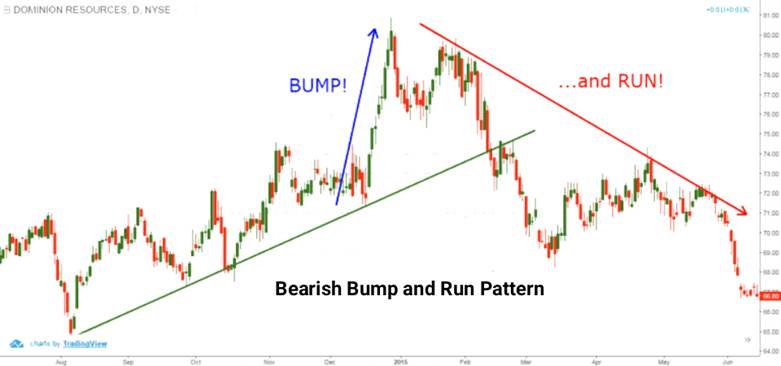
- The Bump and Run pattern helps traders spot sudden, abnormal price moves early and identify areas where the probability of a trend reversal is higher.
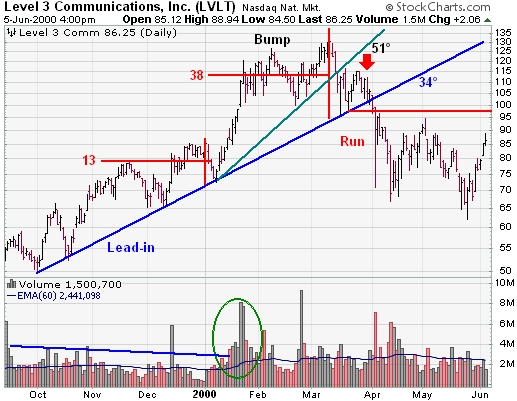
- The reliability of the pattern depends on specific criteria such as the slope of the price move, the intensity of the spike, and trading volume. These objective factors often make it easier to recognise than some more complex chart patterns.
- The Bump and Run pattern is not limited to a single timeframe and can be applied to both short-term and long-term charts.
- Analysing volume together with the pattern is crucial for confirming whether the reversal signal is credible.

Pro Tip
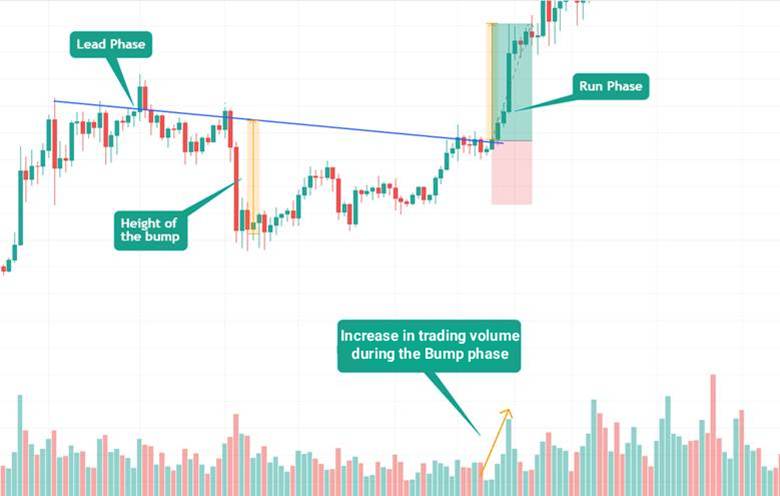
According to Investingoal, one reason this pattern is so powerful is that the Bump phase represents a climax of market euphoria that occurs just before the real reversal begins. The way the market reacts to the surge in volume during the Bump to the start of the Run phase often serves as a handy trigger for taking a trade.
Key Insight
According to Warrior Trading, trading volume is essential for confirming the Bump and Run pattern. Volume is typically low during the initial trend, but spikes sharply when the Bump appears on the chart.
Key Insight
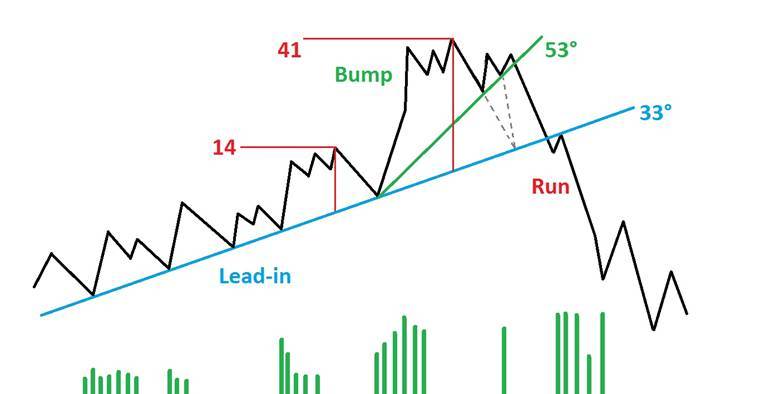
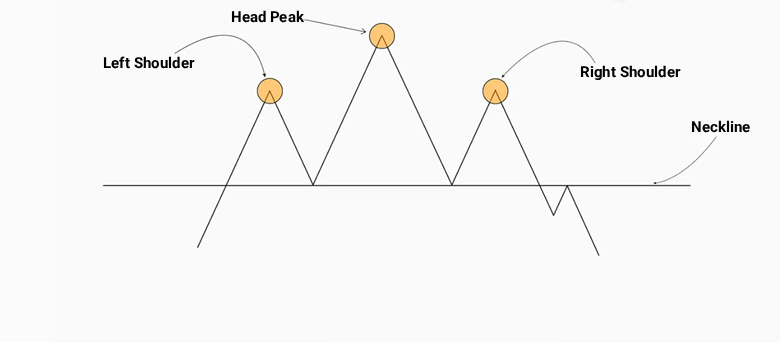
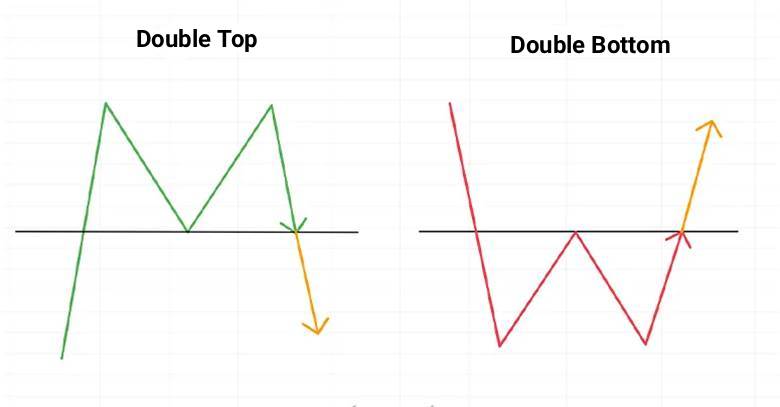
According to StockCharts, in some cases, the Bump phase does not form a single, clean peak. Instead, it may develop as a double top or a series of lower highs. After this structure forms, the price begins to decline and approaches the original trendline, completing the right side of the Bump and initiating the Run phase.