


In Decision Point Trading, identifying decision points is one of the fundamental skills for traders. As the name suggests, these are the moments when the market reaches a critical decision, often showing significant reactions. These reactions can manifest as price reversals, trend continuations, or even breakouts of previous market structures. Recognizing these decision points allows traders to enter or exit the market at the right time. If you’re eager to understand where and how these decision points are identified and the impact they have on trading decisions, stay with us until the end of this article.

- Decision points help traders improve the timing of their entries and exits by identifying critical moments in the market, preventing impulsive decisions.
- By using price action trading alongside volume analysis and candlestick patterns, traders can enhance their ability to identify decision points and increase the likelihood of successful trades.
- Support and resistance levels are recognized as areas on the price chart where the market tends to halt or change direction. These levels can act as decision points, guiding traders on when to enter or exit trades.
What Are Decision Points in Price Action Trading?
In price action trading, decision points refer to specific areas on the price chart where the market makes critical decisions. These points typically occur at levels where price has previously shown strong reactions, such as reversal decision points or support and resistance levels. When the price reaches these areas, traders expect the market to either reverse, continue its current trend, or even break through previous structures.
These decision points are directly tied to trader psychology. Whenever the price approaches a decision point, buyers and sellers begin to react, and these reactions can cause price direction changes. In price action trading, traders pay close attention to these points because they can present excellent trading opportunities.
The price action trading strategy focuses on raw price movements without relying on indicators, highlighting decision points as moments when market emotions, such as fear or confidence, influence price reactions. For example, a resistance level that has consistently halted price action can become a decision point, signaling potential opportunities for reversal or breakout.

According to Investopedia, decision points are levels where the market shows significant reactions, helping traders determine the precise timing for entries and exits.
Comparing Decision Point Trading with Supply and Demand
In technical analysis, Decision Point Trading and supply and demand zones are both used to identify critical areas on the price chart, but they serve different purposes and have distinct characteristics. Understanding the differences between supply and demand vs decision point can significantly improve a trader’s strategy.
Supply and demand zones are broader areas where buying or selling pressure is notably higher than the opposite side. These zones often act as key support or resistance levels, indicating where the price might reverse or consolidate. On the other hand, decision points are more specific levels where the market makes critical decisions, such as whether to reverse, continue, or break through previous structures. These decision points can include reversal decision points, continuation decision points, or breakout decision points.
By mastering the Decision Point Trading strategy, traders can gain a more precise understanding of where the market is likely to make a significant move. This is particularly helpful when identifying key levels in forex, where price action trading zones play a crucial role in determining potential price reversals or trend continuations. Recognizing these decision points allows traders to make better-informed decisions, whether they are looking for a breakout or a trend continuation.
Comparing Decision Point Trading with Order Blocks
Both Decision Point Trading and order blocks are essential concepts in technical analysis, but they have fundamental differences. Understanding the distinctions between decision points and order blocks can help traders make more informed decisions.
Order blocks are typically identified on higher timeframes, such as daily or weekly charts. These zones represent areas where large orders from institutional traders have been placed, often leading to price reactions. In contrast, decision points are more commonly identified on lower timeframes, providing traders with more immediate, actionable signals.
While order blocks are generally considered support or resistance levels where price may reverse, decision points refer specifically to price reactions at critical levels that help traders make more precise trading decisions. For example, decision points might indicate a potential reversal decision point, a continuation decision point, or a breakout decision point based on the behavior of the price in specific areas.
By using the Decision Point Trading strategy, traders can better assess price behavior at these specific levels, providing them with the tools to make more accurate decisions when entering or exiting trades.
Types of Decision Points in Decision Point Trading
In Decision Point Trading, decision points are categorized into three main types, each playing a vital role in analysis and trading decisions. Understanding these decision points helps traders make informed decisions about when to enter or exit the market.
1. Reversal Decision Points
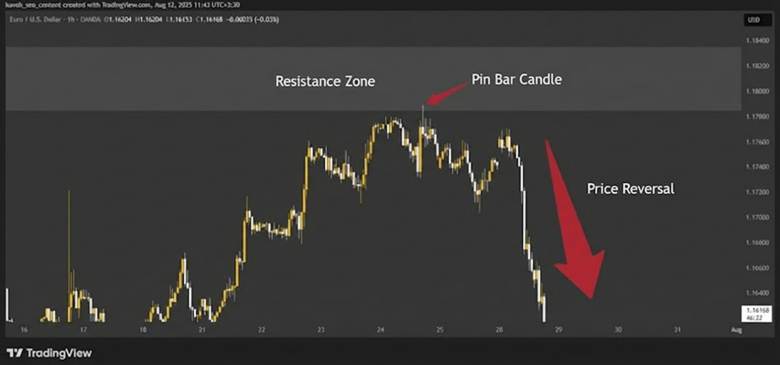
Reversal decision points occur when the price reverses direction after reaching a key level, such as support or resistance. These points are often identified using specific price action trading zones and candlestick patterns, such as pin bars or engulfing candles.
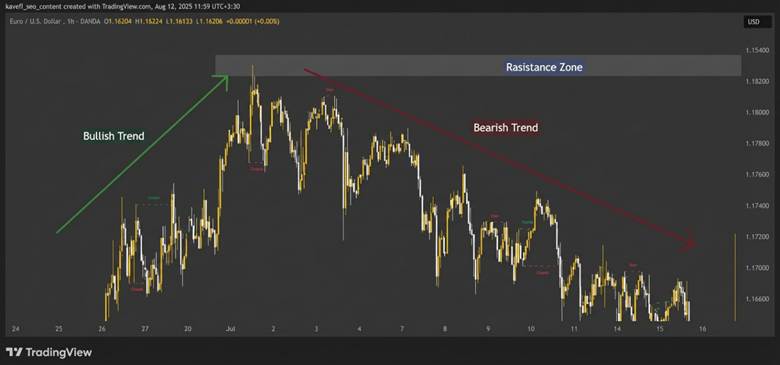
For example, in an uptrend, if price reaches a resistance level and forms a strong bearish candle, this becomes a key decision point for entering a short position. Recognizing reversal decision points is essential for spotting market turns and acting accordingly.
2. Continuation Decision Points
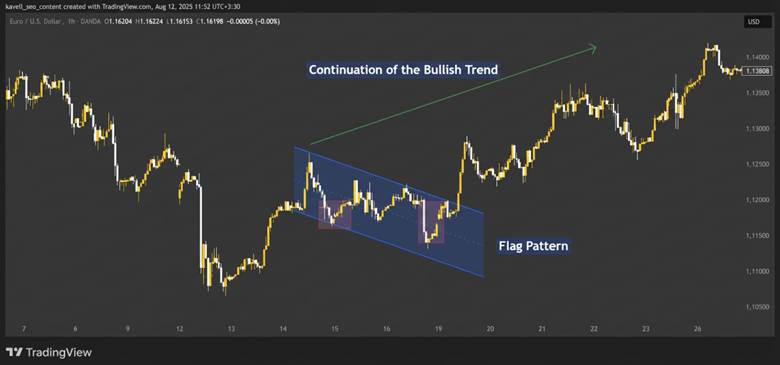
Continuation decision points indicate areas where the market is likely to continue its prevailing trend. These decision points often form after periods of consolidation or price correction and may appear in patterns like triangles, flags, or rectangles.
For example, in an uptrend, after a strong move upward, the price might enter a bullish triangle pattern, and once it breaks to the upside, the trend continues. Traders can use the decision point trading strategy to enter trades aligned with the existing trend, especially when identifying key levels in forex.
3. Breakout Decision Points
Breakout decision points occur when price breaks through significant levels, such as a trendline or resistance, signaling the start of a new trend. These decision points serve as strong signals for entering trades. For example, when price breaks above a resistance level following a consolidation period, it becomes a decision point to enter a long position.
Breakouts must be accompanied by volume to ensure the move is legitimate and not a false breakout. Recognizing breakout decision points allows traders to capitalize on new market phases and potential momentum shifts.
Methods for Identifying Decision Points in Decision Point Trading
Identifying decision points on price charts is an essential skill in Decision Point Trading, helping traders recognize critical moments when the market is likely to make significant moves. These decision points, which can signify potential price reactions, are detected using various technical analysis methods. In this section, we’ll explore practical ways to identify decision points in trading.
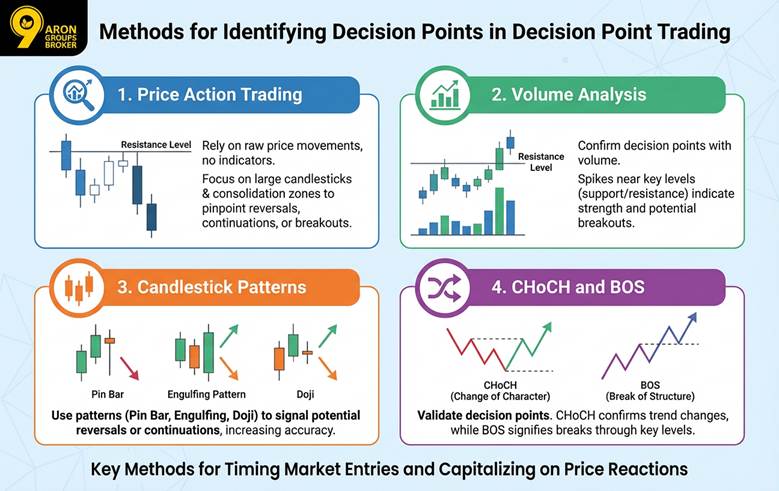
How to Find Decision Points Using Price Action Trading
To successfully identify decision points, traders can rely on raw price movements, a core concept of price action trading. This method doesn’t require indicators and focuses on price changes like large candlesticks or consolidation zones. For example, a significant bearish candlestick near a resistance level could act as a reversal decision point, suggesting that sellers have rejected the price at that level. By analyzing price action trading zones, traders can identify areas where price is likely to reverse, continue, or break out, thus pinpointing potential decision points.
Identifying Decision Points with Volume Analysis
Volume analysis plays a vital role in confirming decision points. When trading volume spikes near key levels such as support or resistance, it can confirm the strength of these levels. For instance, if the price approaches a resistance level and volume increases, this could indicate a potential breakout, signaling a breakout decision point.
By combining volume analysis with price action trading zones, traders can improve their ability to spot decision points and refine their decision point trading strategy.
Identifying Decision Points Using Candlestick Patterns
Candlestick patterns are another important tool for identifying decision points. Combining these patterns with other technical analysis tools can increase the accuracy of recognizing price reactions. Patterns such as pin bars, engulfing candles, or doji candles can signal potential reversal decision points or continuation decision points.
For example, an engulfing pattern near a support level could indicate a reversal, while a continuation decision point could form after a price correction in a trending market. Using these patterns alongside volume analysis and key levels helps traders develop a more comprehensive approach to decision point trading.
The Role of CHoCH and BOS in Confirming Decision Points
Concepts like CHoCH (Change of Character) and BOS (Break of Structure) are essential in confirming decision points. CHoCH reflects a change in market behavior or trend, while BOS signifies price breaking through key levels like support or resistance. These concepts can validate decision points, confirming whether the market is likely to reverse or continue. Traders can apply these tools to refine their decision point trading strategy, allowing them to enter the market at the right moment and take advantage of price movements effectively.
Success in Decision Point Trading requires patience to wait for confirmation signals and effective risk management through stop-loss orders and a trading journal.
Common Mistakes in Decision Point Trading Analysis
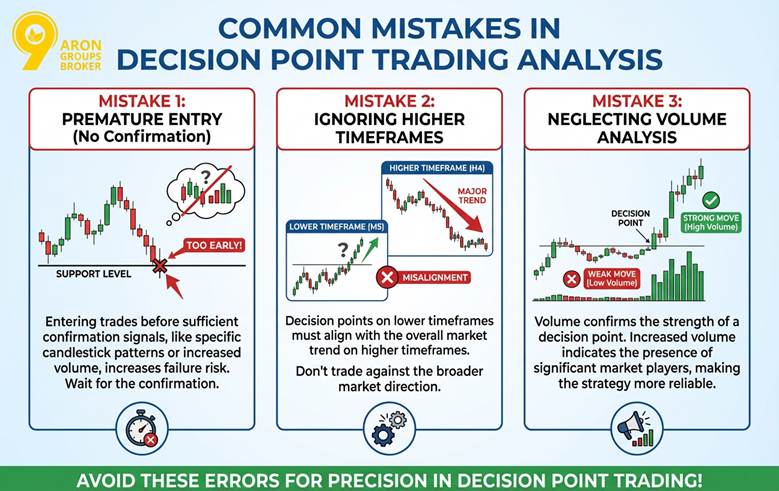
Analyzing decision points in price action trading requires precision and experience. However, traders often make mistakes that can lead to financial losses. Some of the most common errors include:
- Entering trades too early: Many traders jump into a trade without waiting for sufficient confirmation signals, such as specific candlestick patterns or increased trading volume. For example, entering a trade solely based on price approaching a support level, without any confirmation, can result in a failed trade.
- Ignoring higher timeframes: Decision points on lower timeframes may not align with the overall market trend. Always consider identifying key levels in forex and ensure that the decision points on smaller timeframes match the broader market direction.
- Neglecting volume analysis: Failing to pay attention to volume can cause traders to miss the strength of a decision point. Increased volume near key levels indicates the presence of significant market players, making the decision point trading strategy more reliable.
Ignoring the impact of economic events can make decision point trading analysis misleading, as news can alter price reactions and invalidate previously identified decision points.
Conclusion
Ultimately, decision points play a crucial role in enhancing trading strategies. Accurately identifying these decision points can help traders enter the market with greater precision and capitalize on price movements. For success in Decision Point Trading, continuous practice, using multiple timeframes, and combining price action trading tools are essential. It’s recommended that traders improve their skills in recognizing and analyzing decision points through study and practice to make better decisions in the market and reduce their trading risks.