


The Connors Relative Strength Index (Connors RSI) is an advanced technical indicator designed for traders who seek precise entry and exit points in short-term trading. Developed by Larry Connors, this indicator combines three key components, delivering greater sensitivity and accuracy than the classic RSI. As a result, it is particularly well-suited to high-volatility markets such as forex and cryptocurrencies.
By focusing on momentum analysis and rapid price changes, the Connors RSI helps traders identify reliable buy and sell signals, especially in short-term and mean-reversion strategies. If your goal is to refine your trading approach and make more disciplined decisions, understanding how to use the Connors RSI can meaningfully improve your technical analysis toolkit.

- Connor's RSI uses short lookback periods and three components to generate fast signals for short-term trading in volatile markets.
- With overbought/oversold levels at 90/95 and 10/5, the Connors RSI identifies price reversals more precisely than the classic RSI.
- Combining the Connors RSI with price action or indicators such as ADX helps reduce false signals.
- The Connors RSI performs best in range-bound and highly volatile markets, including crypto and forex.
What Is the Connors Relative Strength Index (Connors RSI)?
The Connors RSI, commonly abbreviated as CRSI, is a momentum oscillator developed by Larry Connors and the Connors Research team. Unlike the classic RSI, which is better suited to longer-term analysis, the Connors Relative Strength Index is built by combining three key components:- Relative Strength Index (RSI);
- UpDown Length (the duration of consecutive upward or downward price movements);
- Rate of Change (ROC).

Backtests show that using very short lookback periods (2-3 days) combined with extreme thresholds, such as entering trades below 10 and exiting when CRSI reaches 50-70, delivers significantly better trading performance compared with standard settings.
What Is the Difference Between the Connors RSI and the Classic RSI?
The Connors RSI, compared with the classic RSI developed by Welles Wilder, is optimised for short-term trading. The Connors Relative Strength Index is composed of three components:
- a 3-period RSI of price,
- a 2-period RSI of trend length,
- and a percentile rank of the price rate of change,
which makes it well-suited for rapidly identifying market shifts. In contrast, the classic RSI typically uses a 14-period lookback and is designed for longer time horizons.
This difference in calculation periods causes the classic RSI to react more slowly in short-term trading and generate more false signals. By comparison, the Connors RSI adjusts overbought and oversold levels to 90 and 10 (instead of 70 and 30), delivering greater accuracy in intraday trading and making it ideal for high-volatility markets such as forex and cryptocurrencies.
| Feature | Classic RSI | Connors RSI |
|---|---|---|
| Developer | Welles Wilder | Larry Connors |
| Primary purpose | Long-term trend analysis | Short-term overbought/oversold conditions |
| Components | RSI only | RSI + trend length + rate of change |
| Best suited for | Long-term trading | Short-term trading |
How the Connors Relative Strength Index (Connors RSI) Is Calculated
The Connors RSI is calculated by combining three independent components, each of which analyses a different aspect of price behaviour:
- Price RSI (3-period): A classic RSI calculated with a short 3-day lookback, making it highly sensitive to recent price fluctuations.
- Trend Length RSI (2-period): Measures the persistence of an upward or downward trend by calculating RSI based on the number of consecutive days of price increases or decreases.
- Rate of Change Percentile Rank (100-period): Compares today’s price change with those of the past 100 days and expresses its position as a percentile value (0–100).
According to StockCharts, the final value of the Connors Relative Strength Index is obtained by taking the average of these three components, using the following formula:
Connors RSI = (Price RSI + Trend Length RSI + Rate of Change Percentile) ÷ 3
The resulting value oscillates between 0 and 100. For example:
If Price RSI = 70, Trend Length RSI = 30, and Rate of Change Percentile = 40:
(70+30+40) ÷ 3= 46.7
This value represents the final Connors RSI reading.
How to Set Up the Connors Relative Strength Index (Connors RSI) on Platforms Such as MetaTrader or TradingView
To use the Connors RSI on trading platforms, you only need to follow a few simple steps.
How to Enable and Configure the Connors RSI on TradingView
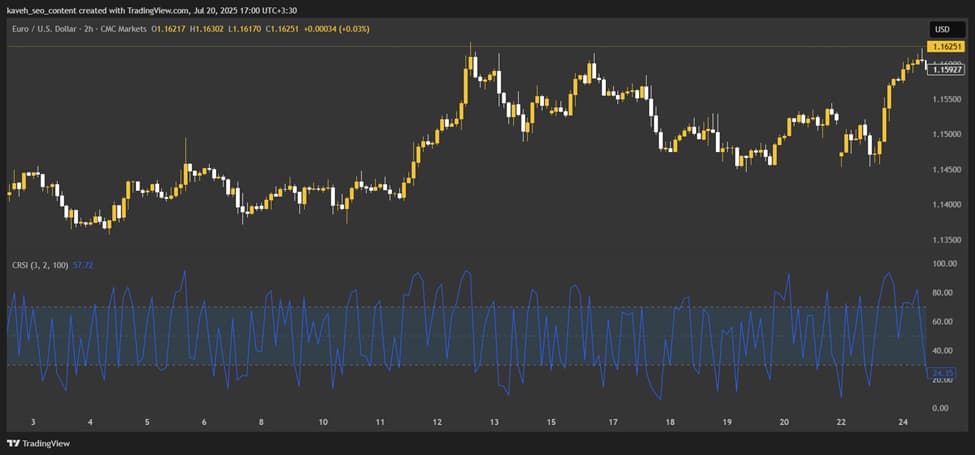
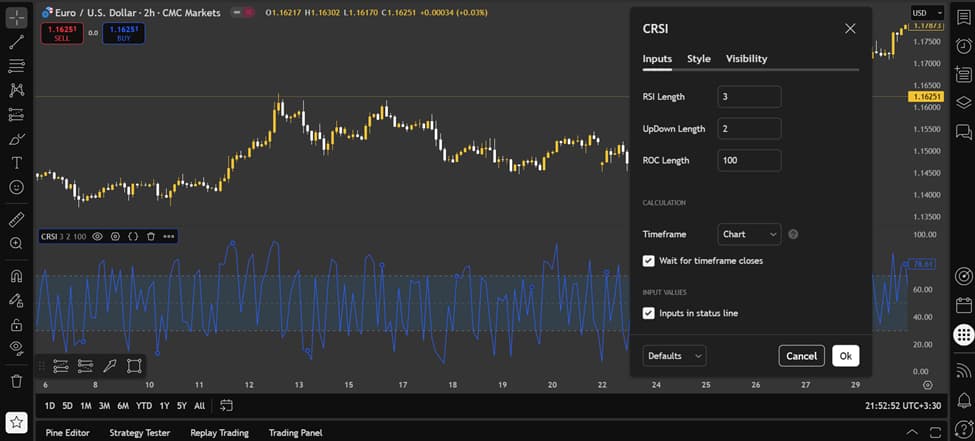
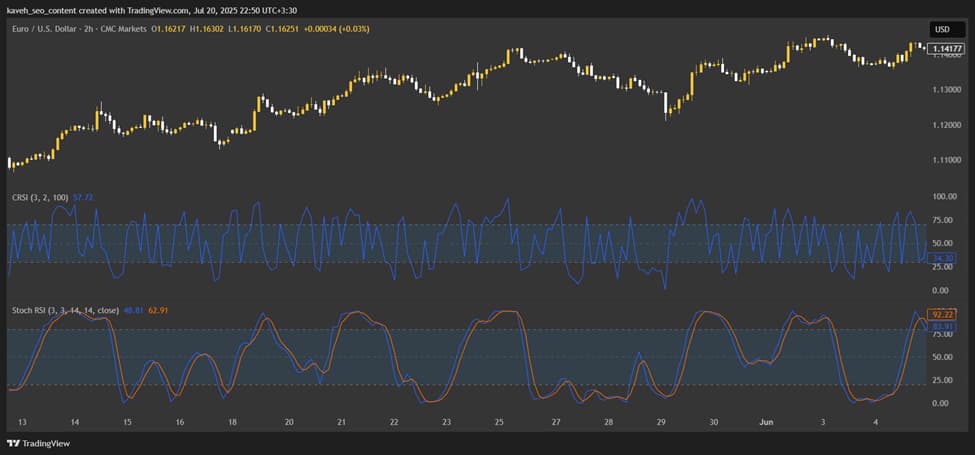
Open your desired chart in TradingView, then select “Indicators” from the top toolbar. In the search box, type “Connors RSI” or “CRSI” and add the indicator to the chart. The default settings of the Connors RSI include a 3-period price RSI, a 2-period trend length RSI, and a 100-period rate of change percentile rank.
These settings generate values between 0 and 100, where readings above 90 typically indicate overbought conditions and readings below 10 indicate oversold conditions. For highly volatile markets such as cryptocurrencies, you may adjust the parameters to 2,2,100 or 3,3,100 to achieve more precise signals.
How to Enable and Configure the Connors RSI on MetaTrader 4 and 5
First, download the indicator file (.mq4 or .ex5) from a reliable source and copy it into the platform’s “Indicators” folder. After restarting MetaTrader, select the indicator from the “Navigator” panel and apply it to the chart. The default Connors RSI settings use periods of 3, 2, and 100. These parameters can be adjusted to better suit markets such as forex or equities.
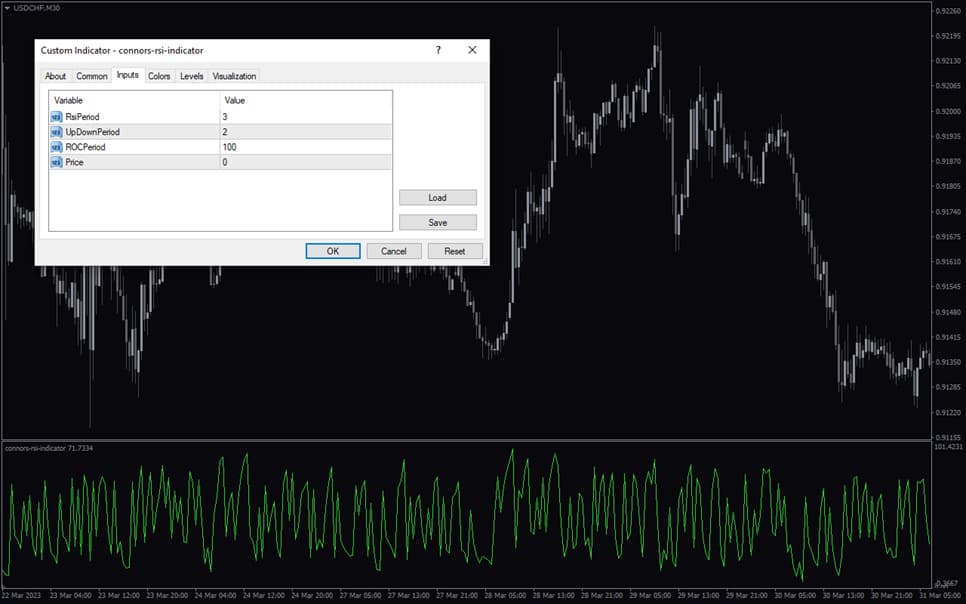
By applying these settings, the Connors RSI becomes a powerful tool for identifying entry and exit points in short-term trading strategies.
Pro Tip:
Even with the default settings, it is recommended to retest and optimise the RSI periods and the sequence of consecutive up or down days according to the specific market (such as cryptocurrencies or forex) in order to reduce the risk of false signals.
Advantages and Disadvantages of the Connors Relative Strength Index (Connors RSI)
The Connors RSI is a popular tool among traders due to its high sensitivity in short-term trading. By using shorter lookback periods and additional components such as trend length and rate of change, it generates fewer false signals than the classic RSI and is well-suited to high-volatility markets such as forex and cryptocurrencies. The Connors Relative Strength Index helps traders identify entry and exit points with greater precision.
However, this indicator is not an ideal standalone momentum tool and should be combined with other indicators. In extremely volatile markets, especially when used without complementary analysis such as price action or volume analysis, it may produce misleading signals. To manage risk effectively, combining the Connors RSI with other technical analysis tools is essential.
How Can You Use the Connors Relative Strength Index (Connors RSI) to Find the Best Entry and Exit Points?
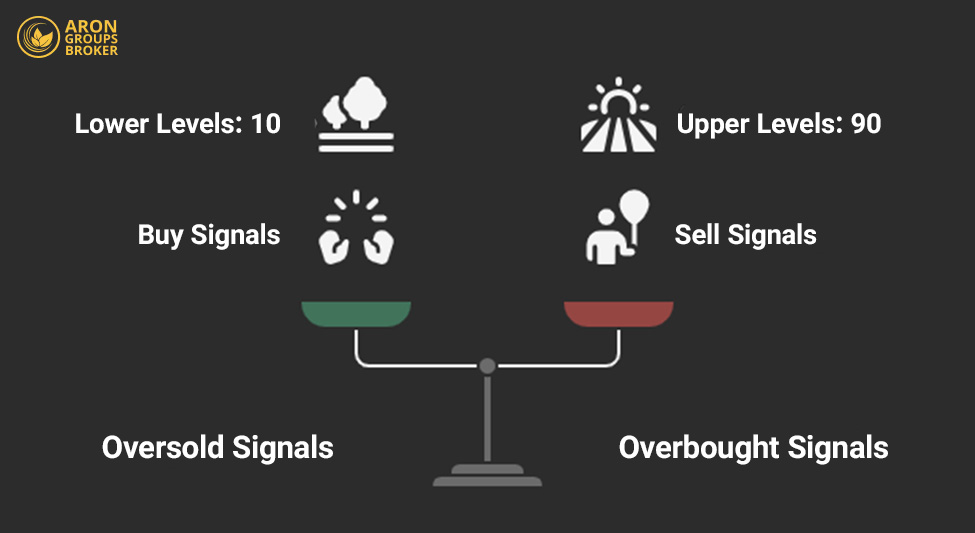
The Connors RSI is an excellent tool for short-term trading. When its value drops below 10 or 5, it signals oversold conditions and a potential buying opportunity. When it rises above 90 or 95, it indicates overbought conditions and is typically considered a signal to exit or sell.
For greater accuracy, these levels should be confirmed with tools such as moving averages, volume, or support and resistance. Relying solely on Connor’s RSI, without confirmation from other analyses, can lead to incorrect signals.
How to Identify Overbought and Oversold Zones Correctly with the Connors RSI
The Connors RSI highlights overbought levels (90 or 95) and oversold levels (10 or 5). A reading below 10 indicates selling pressure and a higher likelihood of a price rebound. A reading above 90 suggests buying pressure and a potential pullback. For more reliable signals, wait for the Connors RSI to reverse direction after reaching these extremes.
More Accurate Entries by Combining Connors’ RSI with Price Action
Combining the Connors RSI with price action improves precision. For example, in an oversold zone (below 10), the appearance of a bullish pin bar can provide a strong buy signal. In an overbought zone (above 90), a bearish candle pattern can confirm a sell signal. This approach reduces the risk of poor entries.
How to Filter Weak Signals Using the Connors’ RSI
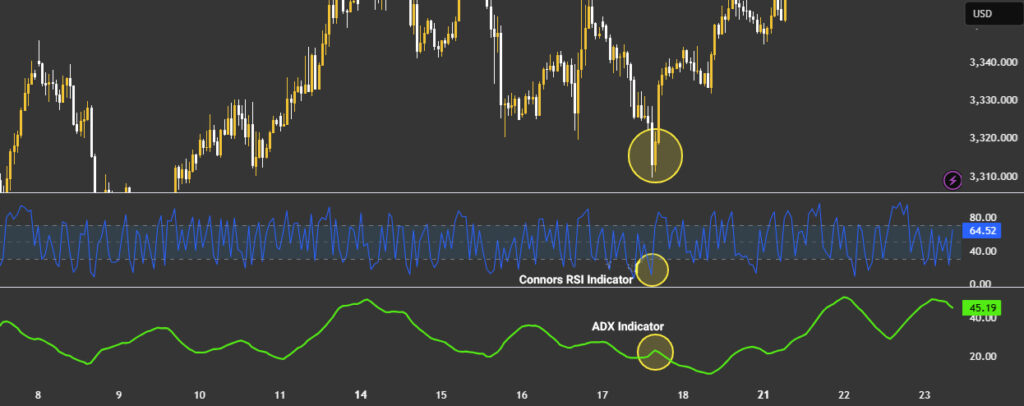
To reduce false signals from the Connors RSI, use trading volume or indicators such as the Stochastic Oscillator. A buy signal in an oversold zone becomes more credible when accompanied by rising volume. An ADX reading below 25 can also strengthen Connors’ RSI signals in range-bound markets.
Q: Does the Connors RSI work better on specific time frames?
A: The Connors RSI is optimised for lower time frames such as 5-minute, 15-minute, and daily charts. Its short lookback periods make it less reliable on weekly or long-term charts. For higher time frames, classic RSI or trend-based indicators are usually more effective.
What Is the Difference Between the Connors RSI and the Stochastic Oscillator?
The Connors RSI and the Stochastic Oscillator are both momentum oscillators, but they differ in their structures and practical uses. The Connors Relative Strength Index, developed by Larry Connors, is built from three components: price RSI, trend length, and rate of change, and is designed for short-term trading in high-volatility markets such as forex and cryptocurrencies.
With shorter lookback periods (such as 3 and 2) and more extreme overbought and oversold levels (90 and 10), it is highly sensitive to rapid price movements.
In contrast, the Stochastic Oscillator, which compares the closing price to the price range over a given period, performs better in range-bound markets without a strong trend and generates more frequent signals using the 80 and 20 levels. The Connors RSI produces fewer but more precise signals, while the Stochastic Oscillator tends to be more effective in calmer, sideways markets.
In What Conditions Does the Connors RSI Perform Better Than Other Indicators?
The Connors RSI performs best in high-volatility, short-term, and non-trending (sideways) markets. Because it is highly sensitive, it is designed for day trading and short-term swing/mean-reversion trading, reacting faster to price moves than many classic indicators. If you are looking for more precise entries and exits on lower time frames, the Connors RSI can be a suitable choice.
Best Combination Strategies with the Connors RSI for More Accurate Trades
Combining the Connors RSI with a 50-day moving average or ADX can improve trade accuracy. For example, entering a trade in the oversold zone (below 10) with ADX confirmation (below 25) helps reduce false signals.
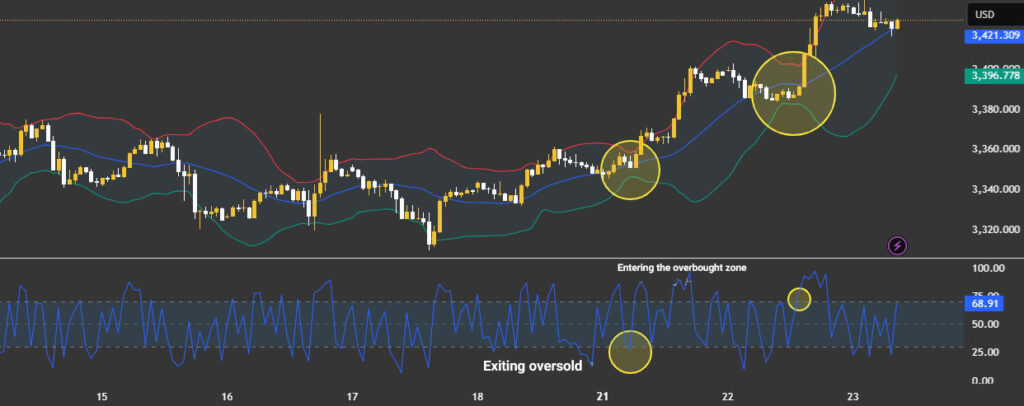
Using the Connors RSI with Bollinger Bands to Capture Volatility
During Bollinger Band contraction, if the Connors RSI moves into overbought or oversold territory, the probability of a strong price move increases. This combination can help identify early entries at the start of new volatility expansions.
Q: Is the Connors RSI suitable for trending markets, or only for range-bound conditions?
A: The Connors RSI can function in trending markets, but it performs best during pullbacks rather than trend continuation. In strong trends, extreme CRSI readings often signal temporary exhaustion instead of full reversals. Traders should align Connors RSI signals with the higher-timeframe trend to avoid premature counter-trend entries.
Q: Can the Connors RSI be automated in algorithmic or rule-based trading systems?
A: Yes, the Connors RSI is well-suited for algorithmic trading due to its precise numerical thresholds. Its fixed overbought and oversold levels simplify rule-based entries and exits. However, adding filters such as volatility or trend conditions is essential for robust automation.
Conclusion
The Connors Relative Strength Index (Connors RSI) is a key tool for short-term trading in volatile markets such as forex and cryptocurrencies. Accurately identifying overbought and oversold zones helps traders spot potential opportunities. However, to reduce risk and improve precision, it should be combined with tools such as price action, moving averages, or Bollinger Bands. It is recommended that traders test the Connors RSI on a demo account first to become familiar with the best settings and strategies before applying it in live trading.
Source: TradingView, TrendSpider


