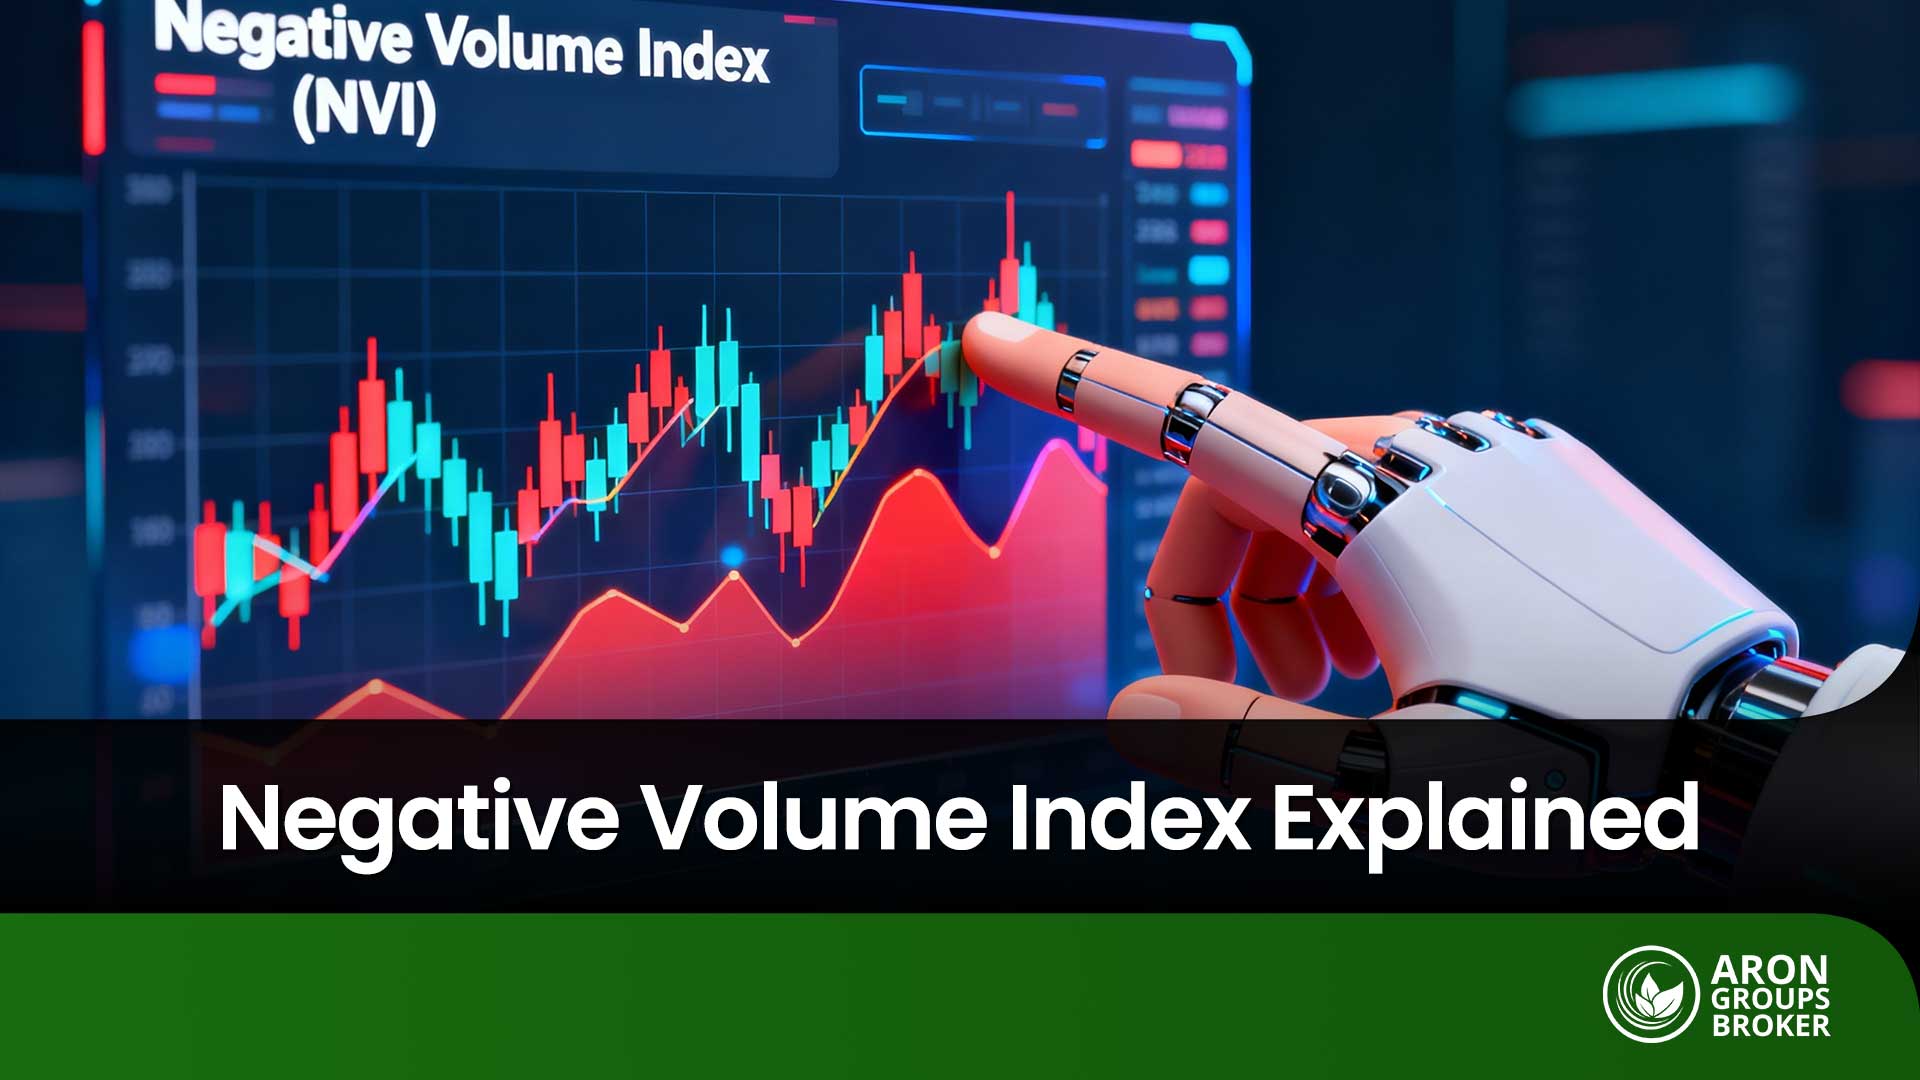


Unlike many volume indicators that focus on busy, high-volume days, the Negative Volume Index (NVI) takes a different view. It helps you track meaningful market activity on days when trading volume falls. NVI is not just a volume gauge; it is a window into spotting smart money (large, professional investors).
With this distinctive approach, NVI can help traders detect subtle, under-the-surface trends before they become obvious to everyone. As a result, it may highlight trade opportunities that many market participants miss during quieter sessions.

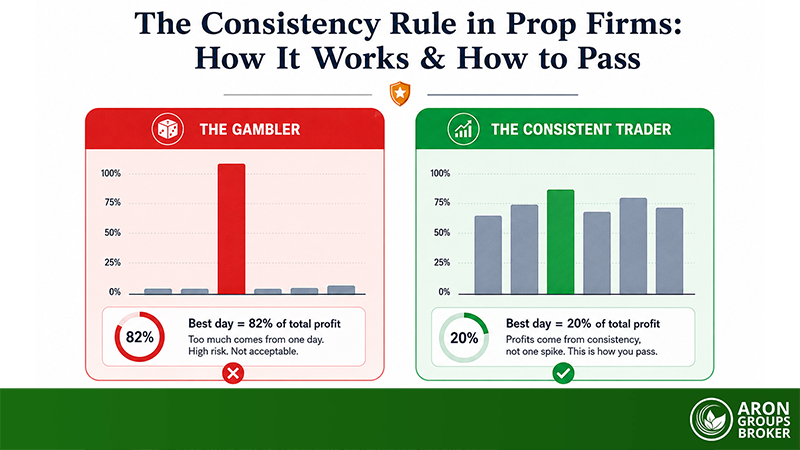
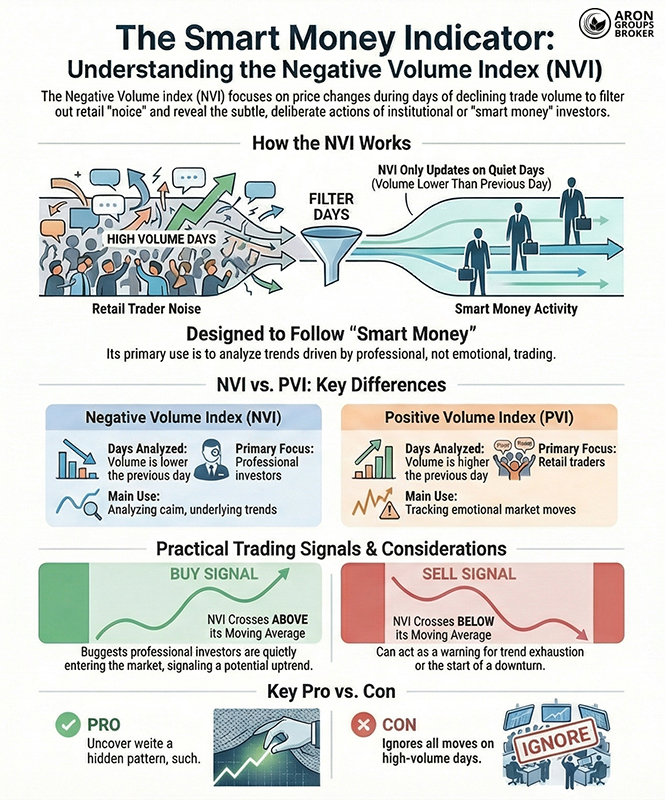
- The Negative Volume Index (NVI) ignores high-volume days and focuses on price behaviour during quieter, lower-activity periods.
- Its main use is filtering out “noise” from emotional retail trading, so the underlying market direction becomes clearer.
- A major drawback is that NVI completely overlooks important moves and events that happen on heavy, high-volume days.
What is the Negative Volume Index (NVI)?
The Negative Volume Index (NVI) is a technical analysis indicator that combines price and volume to study market behaviour. Specifically, it updates on days when trading volume is lower than the previous day.
This helps you detect hidden movements that can occur in low-volume conditions, where smart money often operates.
Scenario: The Whale in the Quiet Room Imagine a noisy party (High Volume). Retail traders are shouting and trading on news. It’s chaos. Now, imagine the morning after (Low Volume). The room is quiet. A “Whale” (Institutional Investor) walks in and quietly buys 10,000 shares.
- PVI watches the party.
- NVI watches the quiet room.
- Key Insight: NVI tracks what the “Whales” do when the crowd isn’t watching.
What is the difference between the Negative Volume Index (NVI) and the Positive Volume Index (PVI)?
The Negative Volume Index (NVI) and the Positive Volume Index (PVI) are both volume indicators that link price and volume. However, they differ in one crucial way: they update under opposite volume conditions.- NVI changes only when trading volume is lower than the previous day’s volume.
- PVI changes only when trading volume is higher than the previous day’s volume.
- NVI tells you how price behaves on low-volume days, which are often driven by smart money and institutions.
- PVI shows what happens to price on high-volume days, which retail traders and news-driven emotion more influence.
| Feature | Negative Volume Index (NVI) | Positive Volume Index (PVI) |
|---|---|---|
| Days analysed | Volume is lower than the previous day | Volume is higher than the previous day |
| Primary focus | Professional investors | Retail traders |
| Sensitivity | Lower, but often more precise | Faster, but with more noise |
| Main use | Analysing calm, underlying trends | Tracking emotional market moves |
Using both indicators together can give a fuller view of how volume influences price direction across different market conditions.
Formula and calculation method for the Negative Volume Index (NVI)
The Negative Volume Index (NVI) updates only when today’s trading volume is lower than the previous day’s volume. Otherwise, the NVI value remains unchanged for that day.
Step-by-step calculation of the Negative Volume Index
- Set the starting NVI value, typically 1,000, as the initial baseline.
- If today’s volume is lower than yesterday’s, apply the formula below.
- If today’s volume is higher than, or equal to, yesterday’s, the NVI does not change.
NVI(today) = NVI(yesterday) + NVI(yesterday) × [(Price(today) − Price(yesterday)) ÷ Price(yesterday)]
A practical example to understand the NVI formula
Assume the following values:
- Yesterday’s price = 100
- Today’s price = 105
- Yesterday’s volume = 10,000
- Today’s volume = 9,000 (volume has decreased)
Then:
NVI(today) = 1,000 + 1,000 × (105 − 100) ÷ 100 = 1,050
If volume had increased instead, the NVI would have stayed at 1,000 for that day.
Q: When can NVI become unreliable due to volume definition issues, and how can traders validate the volume input?
A: NVI can become unreliable in markets where accurately traded volume is not available, such as the FX market, which relies on tick volume as a proxy. Since tick volume does not represent actual transaction size, NVI signals may lose accuracy. To validate the input, traders should assess whether NVI signals behave consistently across markets with real exchange-reported volume, such as equities or futures, or compare signal behaviour on correlated instruments rather than relying on direct volume comparisons.
Tools and charting platforms that provide the Negative Volume Index (NVI)
Many technical analysis platforms and charting tools offer the Negative Volume Index (NVI) as a standard built-in indicator. Below are some of the most common platforms that make NVI available to users.
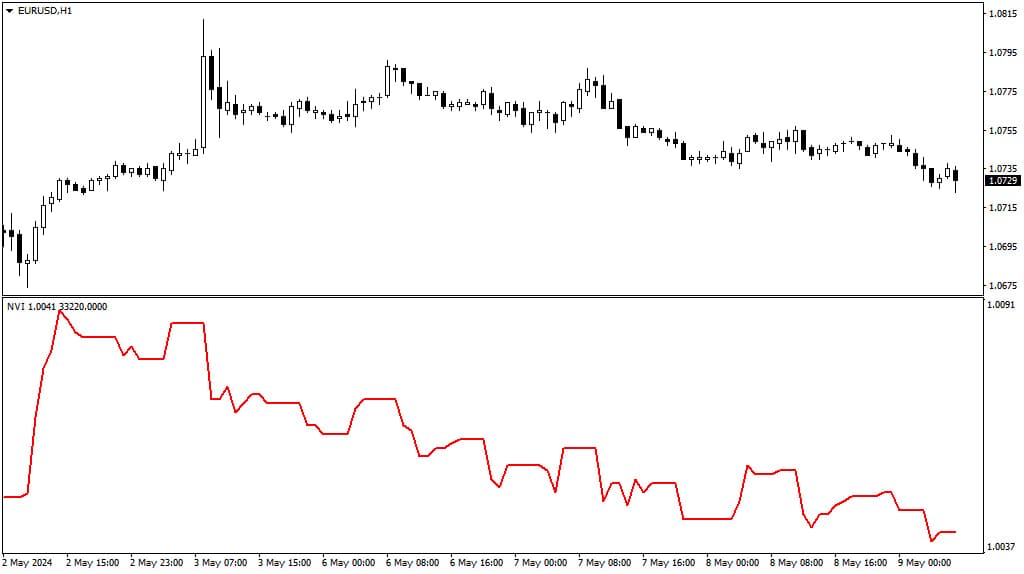
- TradingView: This popular charting platform includes NVI by default, and you can add it from the Indicators menu.
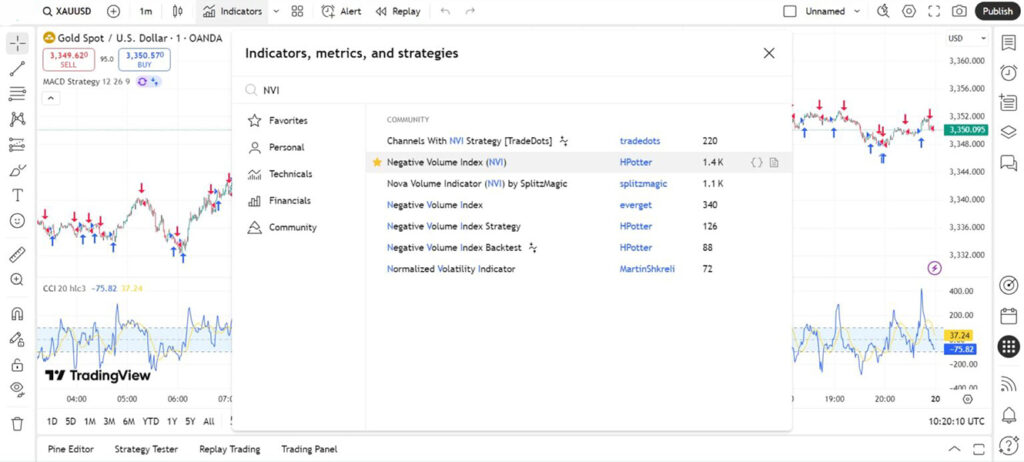
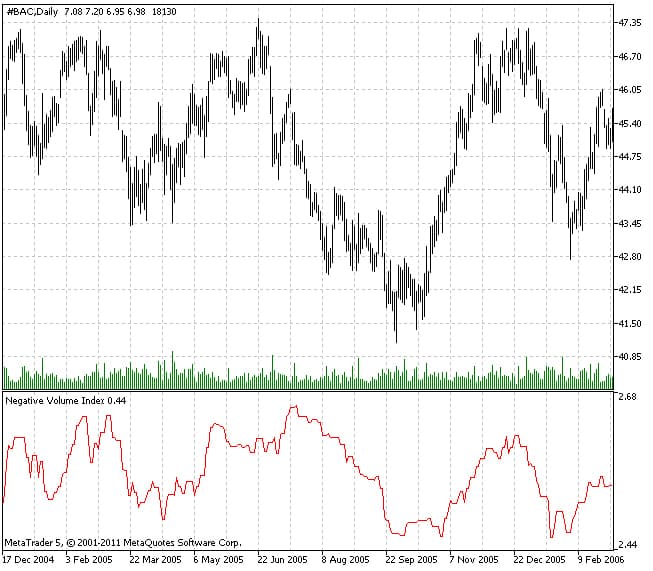
- MetaTrader: MetaTrader platforms also support NVI, allowing traders to use it for deeper chart-based market analysis.
- StockCharts.com: This comprehensive analysis website provides NVI as an available indicator for charting and technical overlays.
- MetaStock: This long-established technical analysis software includes NVI as one of its default, pre-installed indicators.
- EquityFeed Workstation: A professional equities platform that offers NVI alongside other advanced tools for market analysts.
- Fidelity Investments: Some major brokers, including Fidelity, provide analytical tools that can include NVI within their platforms.
- TrendSpider: This platform includes NVI plus tools like market scanners, strategy testing, and multi-factor alert systems.

Pro Tip
For clearer trend shifts, compare NVI alongside a moving average (MA) to spot crossovers and potential reversals more easily.
Applications and interpretation of the Negative Volume Index in financial markets
When used correctly, the Negative Volume Index (NVI) helps identify trends, buy and sell signals, and potential market reversal points.
Below, we review its most important practical applications.
How to use the Negative Volume Index (NVI) to identify trends
One of the main uses of the NVI indicator is identifying long-term market trends.
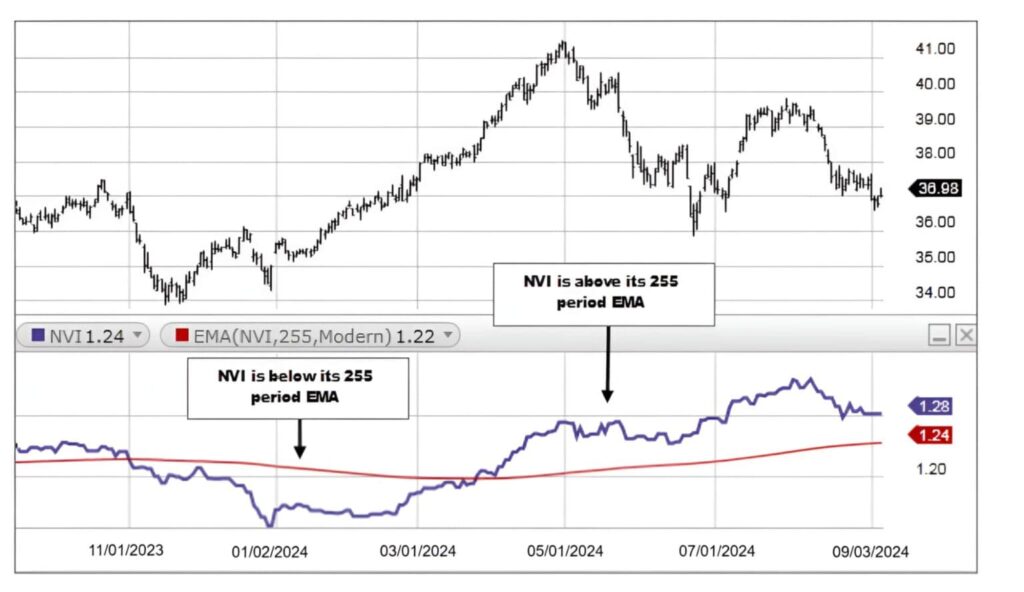
Analysts usually apply a 250- or 255-day exponential moving average (EMA) as a confirmation line.
Based on experience and research:
- When NVI stays above the EMA (often shown as a red line), the probability of price growth is very high.
- When NVI moves below the EMA, the likelihood of a price decline and a bearish phase increases.
Q: Why does the NVI use a 255-day EMA instead of the standard 200-day EMA?
A: Historically, the stock market had about 255 trading days per year. Using a 255-day EMA smooths exactly one year of data, filtering out short-term noise and highlighting the primary trend.
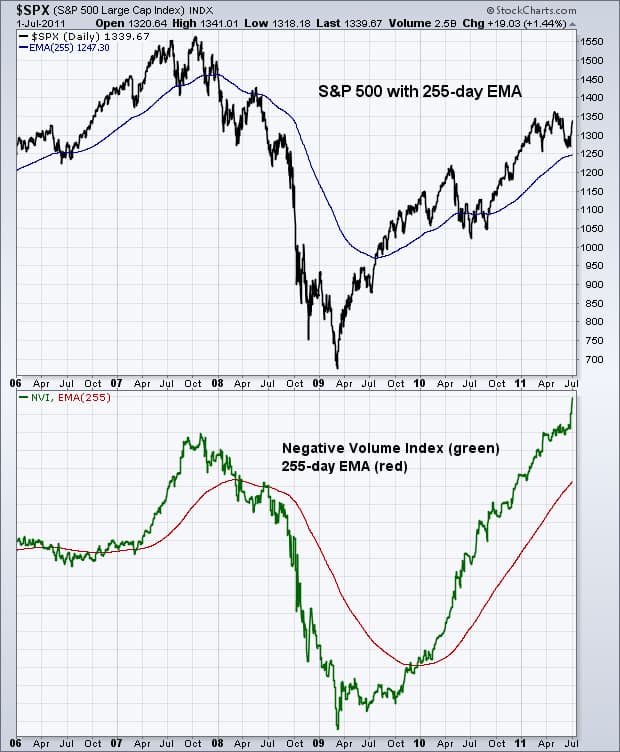
In the chart below, you can see the S&P 500 alongside the NVI indicator.
After NVI crossed above the EMA, a strong bullish trend began.
How to find buy and sell signals using the Negative Volume Index
Below is a clear explanation of how NVI-based trading signals are typically identified.
Buy signal using the NVI indicator
When the NVI line crosses the 255-day EMA upward, this move can signal the start of a new bullish trend. This condition often signals that professional investors are entering the market quietly before the main price expansion begins.
Sell signal using the NVI indicator
Conversely, when NVI drops below the 255-day EMA, this situation can act as a warning signal. Such a crossover often indicates trend exhaustion or the beginning of a price correction.
Warning
During sideways or ranging markets, NVI may cross the EMA repeatedly without forming a strong trend. These rapid back-and-forth moves, known as false signals, often lead to unstable and misleading trading decisions.
In the chart below, you can see NVI crossing the EMA several times, yet no meaningful trend develops.

Q: How can the Negative Volume Index be used to detect institutional accumulation before earnings announcements?
A: By monitoring NVI trends in the weeks leading up to earnings, unusually consistent upward moves on low-volume days may indicate quiet accumulation by institutional investors. This can provide an early signal of potential post-earnings price strength before retail traders react.
Comparison of the Negative Volume Index (NVI) with other indicators
The table below provides a simple, practical comparison of NVI with several popular technical indicators.
| Indicator | Main focus | Strengths | Limitations |
|---|---|---|---|
| NVI (Negative Volume Index) | Price behaviour on low-volume days | Accurate detection of smart money entry, suitable for long-term analysis | Ignores price movements during high-volume days |
| OBV (On-Balance Volume) | Direction of volume accumulation and price | Simple, fast, and effective with price action analysis | Highly sensitive to short-term volume fluctuations |
| MACD | Trend strength and direction | Useful for spotting divergences, trend changes, and crossovers | Lagging signals and weaker performance in ranging markets |
| RSI | Identifying overbought and oversold levels | Strong reversal signals at key levels, suitable for scalping | Does not consider volume, relies only on price movement |
Pro Tip
An indicator alone is never sufficient, but combining NVI with tools like MACD or RSI offers clearer market insight. For example, if NVI crosses above its moving average while RSI enters overbought territory, bullish probability increases significantly.
Q: How do you combine NVI with OBV without double-counting volume and getting false confidence?
A: Use them for different jobs, treat NVI as a “quiet-days trend bias” and OBV as a “confirmation of participation”. If NVI turns bullish but OBV fails to make higher highs, interpret it as early positioning rather than full confirmation, and size smaller until OBV confirms.
Advantages and limitations of the NVI indicator
Below, we review the key strengths and weaknesses of this indicator in practical market analysis.
Advantages of the Negative Volume Index (NVI)
- Tracking professional investor behaviour: On low-volume days, institutional investors are often more active, and NVI targets these sessions directly.
- Useful for long-term trend analysis: When combined with the 255-day EMA, NVI can help signal the start or end of major trends.
- Relatively simple and easy to use: The NVI calculation is not complex, and it is easy to apply in platforms like TradingView.
- Works well with other indicators: You can pair NVI with MACD, RSI, or OBV to improve confirmation and overall signal quality.
Limitations of the NVI indicator
- It ignores high-volume days: Because NVI reacts only when volume declines, it may miss important signals formed during heavy trading sessions.
- False signals in choppy markets: In range-bound conditions, NVI may repeatedly cross the moving average, producing unstable, misleading signals.
- Delayed response to fast changes: Due to reliance on a long-term moving average, NVI can react slowly when trends shift quickly.
Key tips for optimising your use of the Negative Volume Index
To use the Negative Volume Index (NVI) effectively, reading its moving-average crossovers alone is not enough. You should also evaluate declining-volume structure within the context of the market’s broader trend.
The following practices can help you achieve better results with the NVI indicator:
- Combining NVI with trend-confirmation indicators such as ADX or KST can strengthen signal reliability, especially in directional markets.
- In volatile markets, applying a time filter to NVI changes (e.g., waiting several days above the EMA) reduces false swings.
- In accumulation and distribution analysis, a falling NVI alongside a stable price can signal that smart money is gradually exiting before the direction shifts.
- Real optimisation of NVI depends on understanding price action, volume behaviour, and the market’s dominant timeframe.
Q: How can NVI be adapted for multi-asset portfolio risk analysis?
A: By tracking NVI across multiple correlated assets, traders can identify which instruments are attracting smart money quietly. Comparing NVI trends helps in assessing relative strength, potential hedging
Conclusion
The Negative Volume Index (NVI) focuses less on confirming obvious price moves and more on hidden flow during low-volume sessions. This matters because major players often make key decisions quietly, without attracting attention, on exactly those quieter days.
What makes NVI valuable is its ability to reveal underlying trend strength or weakness before price action shows a clear reaction. When combined with price structure, adaptive moving averages, and tools like OBV or KST, NVI becomes harder to misread.
This combination reduces the chance of being misled by signals and makes the path of smart money clearer. That path often starts silently, yet it can determine whether the broader trend continues or breaks down.