


Technical analysis helps traders make better decisions by identifying price patterns in the market. The symmetrical triangle pattern, a powerful tool, shows market indecision through price compression and converging lines. This pattern often leads to strong price movements after consolidation. Understanding the symmetrical triangle pattern helps traders find precise entry and exit points and avoid stop-hunting traps. In this article, we will explore the identification of the symmetrical triangle pattern, trading strategies, and market psychology. Stay with us until the end to master this pattern and achieve success in trading.

- A real breakout in a symmetrical triangle pattern often shows a sudden volume surge, while weak volume can signal a fakeout.
- A symmetrical triangle pattern is not just consolidation; it reflects a gradual supply and demand battle at a sensitive price zone.
- The best risk-to-reward setup forms when entry is near the broken side, with the stop-loss placed beyond the opposite side.
What is a symmetrical triangle pattern and why does it matter?
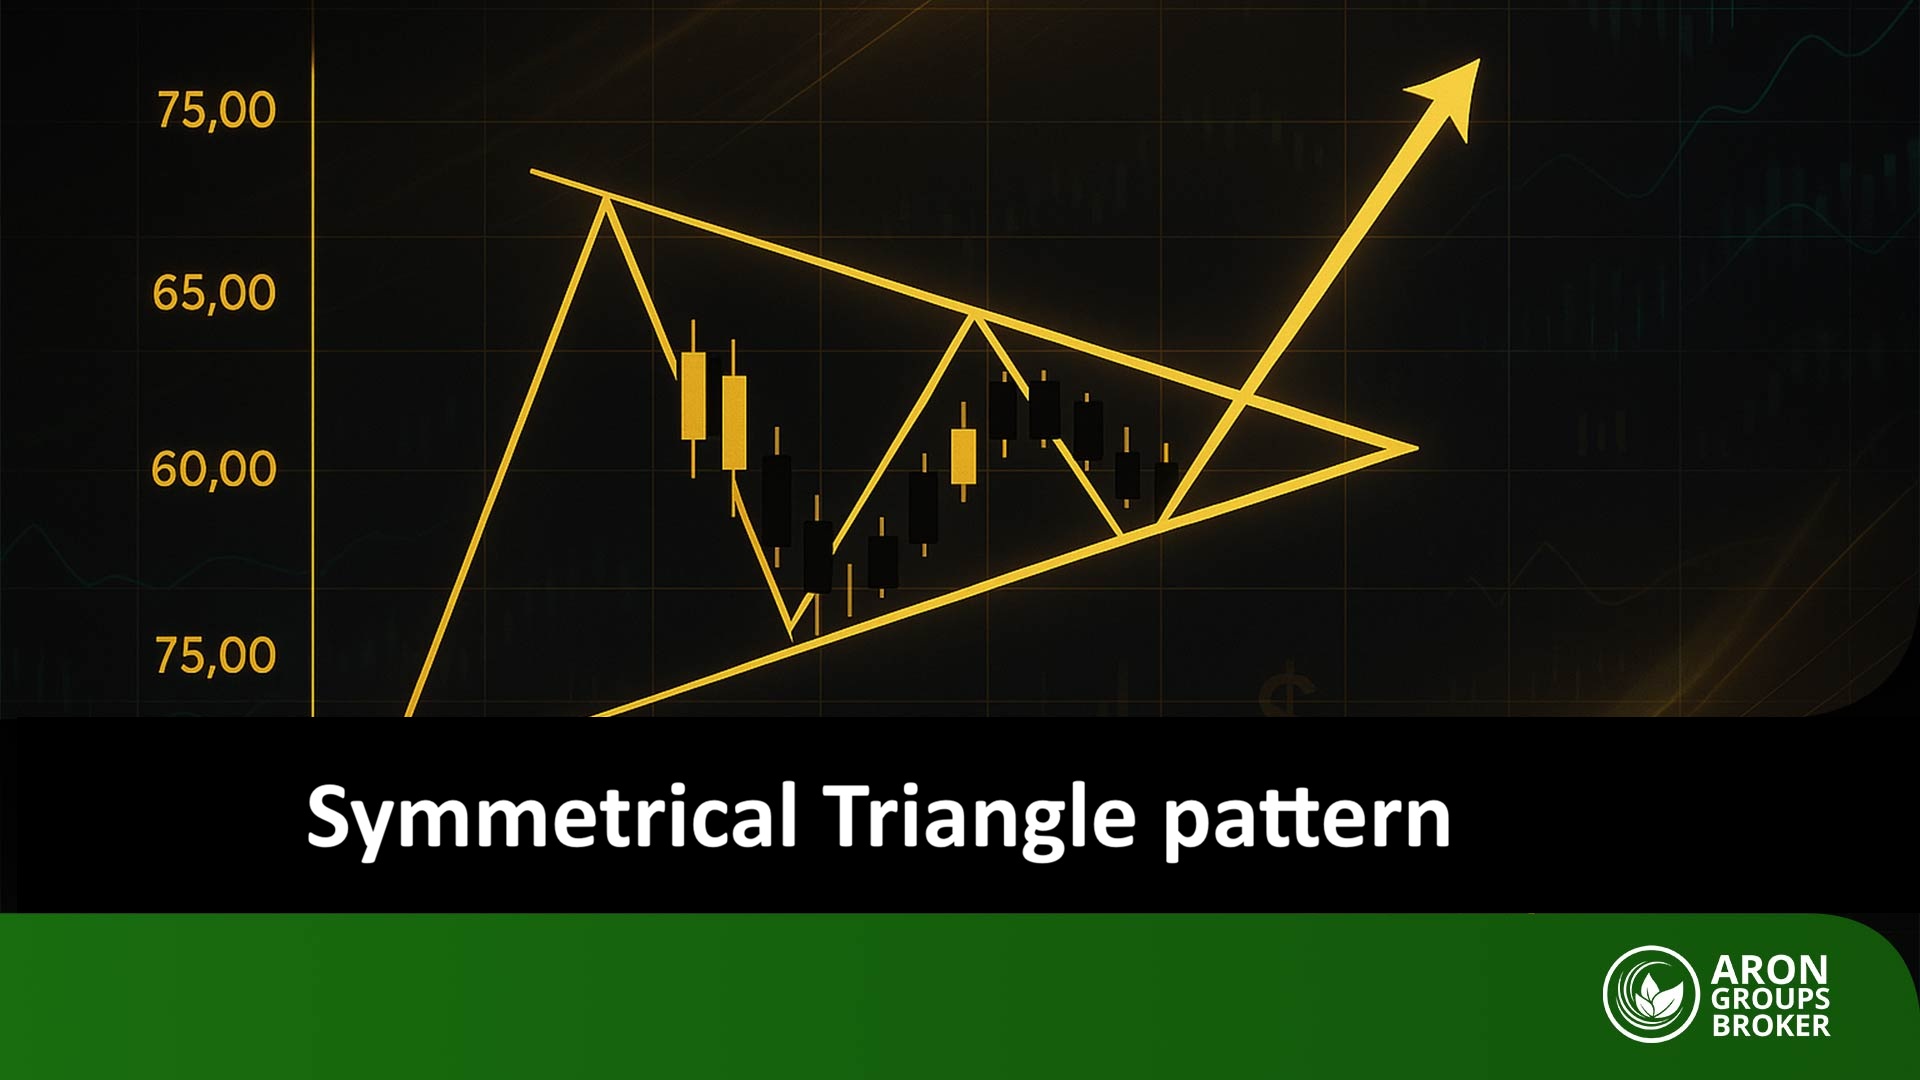
A symmetrical triangle pattern is a classic technical analysis structure formed by two converging trendlines. Lower highs and higher lows move toward each other, showing price compression inside a tightening range.
This symmetrical triangle pattern is often treated as a continuation setup after a phase of consolidation. However, it can also hint at reversal when market context shifts and momentum changes quickly. The symmetrical triangle pattern reflects indecision, as traders wait for the next decisive move.
Falling volatility in this pattern signals balance between buyers and sellers in a sensitive zone. This balance often breaks when one side gains control and forces a Symmetrical Triangle Breakout. The key value is anticipating a large move after confirmation, not predicting direction early.
With the symmetrical triangle pattern, traders can define entries, exits, and risk with clearer structure. It also helps avoid stop-hunting traps when breakout strength is weak or inconsistent. Because it appears across timeframes and markets, it remains a core tool for many analysts.
Symmetrical Triangle vs Pennant and other triangle patterns
A symmetrical triangle pattern differs from ascending, descending, and expanding triangles in structure and trading bias. In a Bullish Symmetrical Triangle setup, both trendlines still converge, so direction stays neutral until breakout confirmation.
In a Bearish Symmetrical Triangle setup, the same neutrality applies until sellers force a clean close below support. By contrast, an ascending triangle has flat resistance and rising support, so upside breaks are more common. A descending triangle has flat support and falling resistance, so downside breaks are more common.
An expanding triangle uses diverging lines and rising volatility, which is harder for beginners to manage. The symmetrical triangle pattern stays balanced, so it demands stricter confirmation before entering. That is why it fits well within Consolidation Patterns and broader Continuation Chart Patterns frameworks. Traders often rely on clearer rules, because symmetrical triangles can break either direction.

How to Identify a Symmetrical Triangle on a Chart
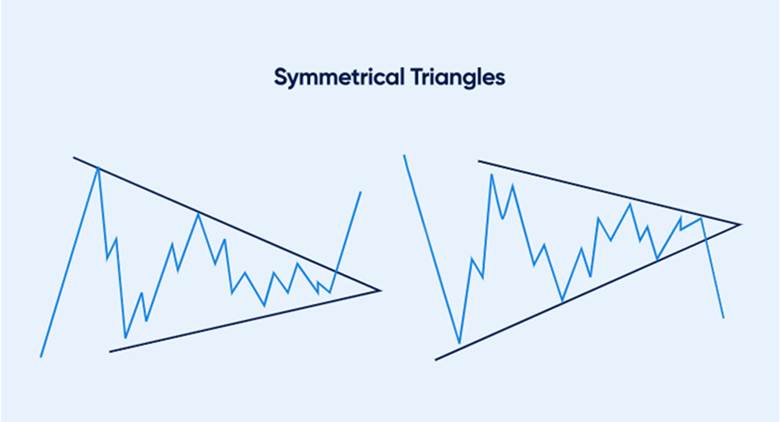
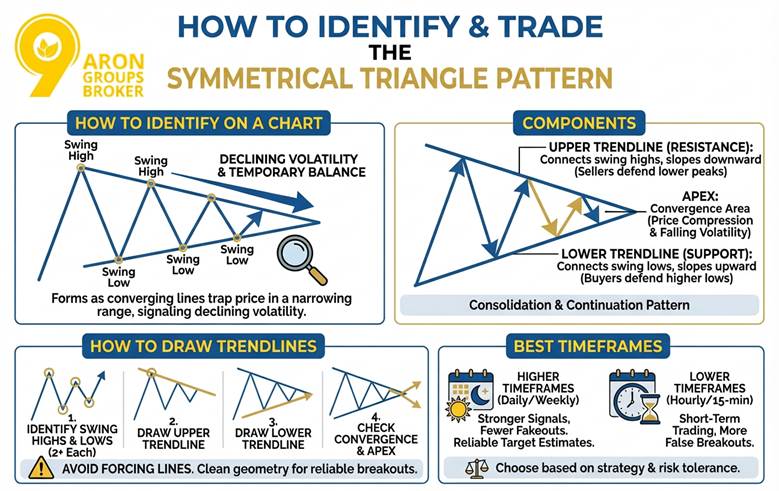
A symmetrical triangle pattern forms when two converging trendlines trap price inside a tight, narrowing range. The structure signals declining volatility and a temporary balance between buyers and sellers during consolidation. To confirm a symmetrical triangle pattern, identify at least two valid touches on each trendline. Clean touches reduce noise and improve the quality of a potential Symmetrical Triangle Breakout.

To draw a symmetrical triangle pattern on platforms like TradingView or StockCharts, first identify swing highs and lows, then draw the trendlines.
Components of a Symmetrical Triangle pattern
A symmetrical triangle pattern includes two converging trendlines, repeated touchpoints, and a final convergence area called the apex. These parts help traders classify it within Consolidation Patterns and broader Continuation Chart Patterns.
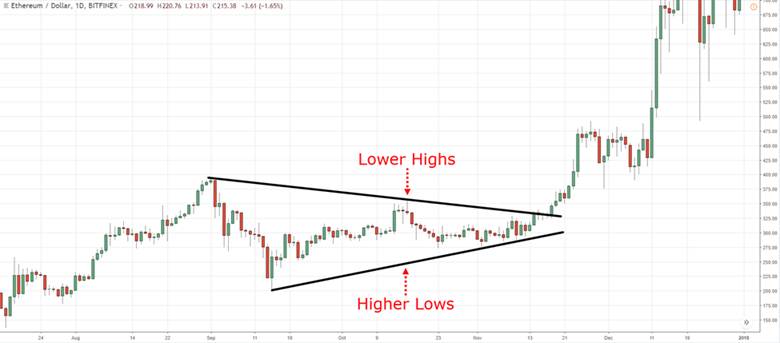
- Upper trendline (resistance): This line connects swing highs and slopes downward as sellers defend lower peaks.
- Lower trendline (support): This line connects swing lows and slopes upward as buyers defend higher lows.
As the lines converge, price compression increases and volatility falls toward the apex. A strong move often follows when price breaks one trendline with conviction. That move can become a Bullish Symmetrical Triangle or a Bearish Symmetrical Triangle after confirmation.
How to Draw Trendlines for Symmetrical Triangle pattern Detection
Use these steps to draw accurate trendlines for a symmetrical triangle pattern. This approach also supports How to Trade Symmetrical Triangle with consistent rules and risk placement.
- Identify swing highs and swing lows, and find at least two of each inside the structure.
- Draw the upper trendline by connecting the swing highs with a clear downward slope.
- Draw the lower trendline by connecting the swing lows with a clear upward slope.
- Check that the two lines converge and meet near a single apex point.
Avoid forcing lines to fit wicks that break structure repeatedly. Clean geometry improves the odds of a reliable Symmetrical Triangle Breakout.
Best Timeframes for Symmetrical Triangle pattern Recognition
A symmetrical triangle pattern can appear on many timeframes, but higher timeframes often provide stronger signals. This matters for estimating Symmetrical Triangle Target Price and filtering false breaks.
- Higher timeframes (daily or weekly): Signals are usually stronger, and fakeouts are less frequent.
- Lower timeframes (hourly or 15-minute): Useful for short-term trading, but false breakouts happen more often.
Choose the timeframe based on your strategy style and risk tolerance. Many traders also compare Symmetrical Triangle vs Pennant to match the pattern with their holding period.
A symmetrical triangle pattern is only tradable when structure, touches, and timeframe align. Use clean trendlines, confirm a Symmetrical Triangle Breakout, then manage risk with a clear Symmetrical Triangle Target Price.
Price and Volume Behavior in the Symmetrical Triangle Pattern
The symmetrical triangle pattern compresses price between two converging trendlines, shaping distinct price and volume behavior. It shows balance between buyers and sellers, while the market waits for a major move. During formation, volatility declines and trading volume usually falls, reflecting trader caution.
Volume Decline During the Price Compression Phase Signals Market Expectation of a Breakout
During the symmetrical triangle pattern, trading volume usually decreases. This decline shows reduced trader activity and anticipation of the next major move. Traders wait in this phase until the next market direction becomes clear.
Falling volume alongside price compression is seen as a sign of market indecision and a likely Breakout in the near future.
Volume Surge at Breakout Signals Strong Confirmation of the Triangle Break
After the symmetrical triangle pattern forms, a valid breakout can trigger a sudden volume surge. This rise confirms the price move and shows the strength of the new trend. To confirm validity, price should break a trendline with a noticeable increase in volume. If volume supports the breakout direction, the chance of trend continuation becomes higher.
Identifying Trend Continuation or Reversal by Analyzing Volume and Triangle Structure Together
Combining volume data with symmetrical triangle structure helps determine trend direction. A high-volume break in the prior trend direction suggests continuation. A break in the opposite direction can signal a possible reversal. For example, on Bitcoin, an upside break with strong volume after a downtrend can suggest reversal risk.
Trading Strategies Using the Symmetrical Triangle Pattern
The symmetrical triangle pattern is a strong price structure, but effective trading requires precise and flexible execution rules. Traders can use several methods to benefit from this setup, which we explain in the sections below.
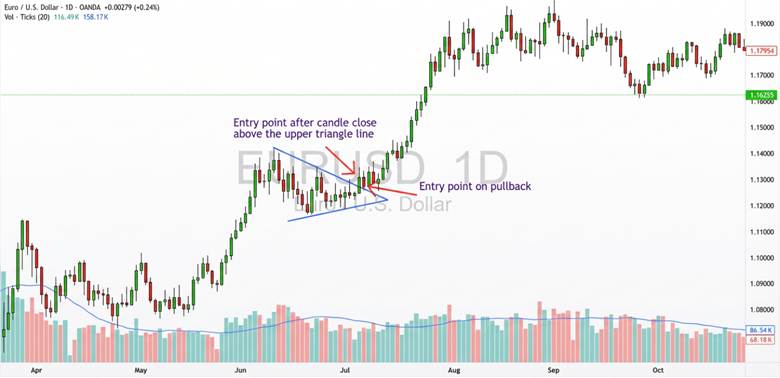
Best Entry Point After the Symmetrical Triangle Breakout
After spotting the symmetrical triangle pattern, enter only after breakout confirmation is clear. Confirmation often includes a candle close beyond the trendlines and a noticeable rise in trading volume.
Some traders wait for a pullback to the broken trendline, now acting as support or resistance. This retest entry can reduce risk and improve execution during a Symmetrical Triangle Breakout.
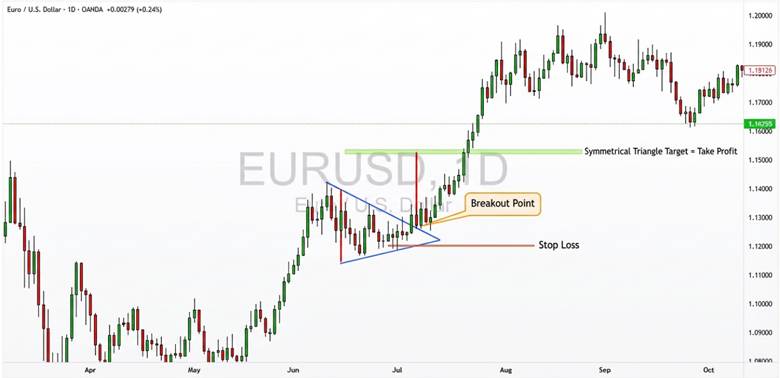
How to Set Stop Loss and Targets Using the Symmetrical Triangle Target Price Method
To set profit targets and stops, measure the triangle height from the highest high to the lowest low. Apply that distance from the breakout point upward or downward, based on the breakout direction.
For example, in EUR/USD, a 210-pip height and a bullish break at 1.13000 targets 1.15100. The stop loss is usually placed beyond the opposite boundary, such as below 1.12300. The EUR/USD chart often shows price moving toward the target after a confirmed breakout.
This method helps manage risk and reduce stop-hunting damage during unexpected volatility in Consolidation Patterns.
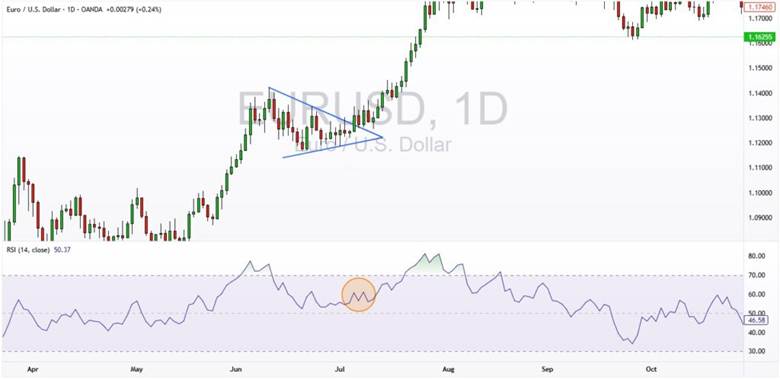
Combining the Symmetrical Triangle Pattern With Indicators for Higher Accuracy
Combining the symmetrical triangle pattern with indicators like RSI and MACD can strengthen confirmation signals. If RSI stays above 50, it supports bullish strength, while below 50 suggests bearish control.
MACD can confirm breakout strength through a signal-line crossover and momentum expansion. For example, on the EUR/USD chart, the triangle breaks at 1.12830 and RSI remains above 50. This combination supports a buy signal after confirmation, similar to Bullish Symmetrical Triangle behavior.
Common Mistakes When Analyzing the symmetrical triangle pattern
Analyzing the symmetrical triangle pattern can be powerful, but common mistakes reduce accuracy and can lead to losses. Many traders, especially beginners, misread the symmetrical triangle pattern because they rush entries or ignore confirmation signals.
Poor analysis often comes from inaccurate trendlines, impatience during consolidation, or weak risk discipline. These mistakes can trap traders in stop-hunting, where price moves falsely and triggers stop losses.
Mistake 1: Drawing converging lines incorrectly
A frequent error in symmetrical triangle pattern analysis is drawing trendlines the wrong way. To draw correctly, identify at least two swing highs and two swing lows and connect them as converging lines. Using too few touches or selecting the wrong points can create a false pattern and a bad decision.
For better precision, use drawing tools on TradingView to align trendlines with clean structure. This also helps separate valid setups from messy Consolidation Patterns noise.
Mistake 2: Entering too early before a confirmed Symmetrical Triangle Breakout
Another common mistake is entering before the Symmetrical Triangle Breakout is confirmed. Many traders see price compression and expect a fast move, so they enter inside the triangle. However, early entry can cause large losses if price breaks the opposite direction unexpectedly.
To avoid this, wait for a decisive close beyond the trendline, not just a wick. Confirmation matters even more when comparing Symmetrical Triangle vs Pennant, because pennants can resolve faster. A Bullish Symmetrical Triangle or Bearish Symmetrical Triangle becomes valid only after a confirmed breakout close.

Ignoring Volume During Analysis
Trading volume is an important tool for confirming the validity of a symmetrical triangle pattern breakout. A volume increase during the breakout can signal stronger price momentum and higher breakout reliability. Ignoring volume can lead to false signals, early entries, and unnecessary financial losses. To confirm a breakout, watch volume expansion alongside price, not price alone.
Another pattern you can use to analyze market moves is the Rejection Block pattern.
Conclusion
The symmetrical triangle pattern is a valuable technical analysis tool that offers unique trading opportunities across many markets. It helps you spot key market moments and plan trades with clearer structure and stronger discipline. By focusing on confirmed breakouts, solid risk management, and complementary indicators, you can trade this pattern more effectively.
A Symmetrical Triangle Breakout becomes more reliable when you confirm price action and volume together. Consistent practice and attention to valid signals help you avoid common traps like stop-hunting and premature entries. For best results, study real charts and test strategies before risking meaningful capital. Over time, this process can deepen your mastery of the symmetrical triangle pattern and improve decision-making.