


Markets rarely move cleanly through obvious levels because the heavy concentration of orders creates significant friction for the price action. This phenomenon is not a market conspiracy, but rather a mechanical outcome of how orders cluster at psychological price points.
Trading without respecting spreads, slippage, and specific order types will likely make standard patterns fail you on schedule. Understanding these mechanics allows you to identify where retail stops are hidden and how professional volume interacts with those levels.
Key Takeaways
- A robust liquidity-grab study should separate results by session, because the same setup behaves differently across liquidity regimes.
- Consider tracking time-to-reclaim after a sweep, because quicker reclaims often imply stronger participation than slow drifts.
- Add a field for venue conditions in crypto logs, since fragmentation and outages can distort otherwise valid setups.
- Use a simple liquidity proxy, like spread percentile, to avoid trading the same pattern when trading costs quietly explode.
What is a Liquidity Grab?
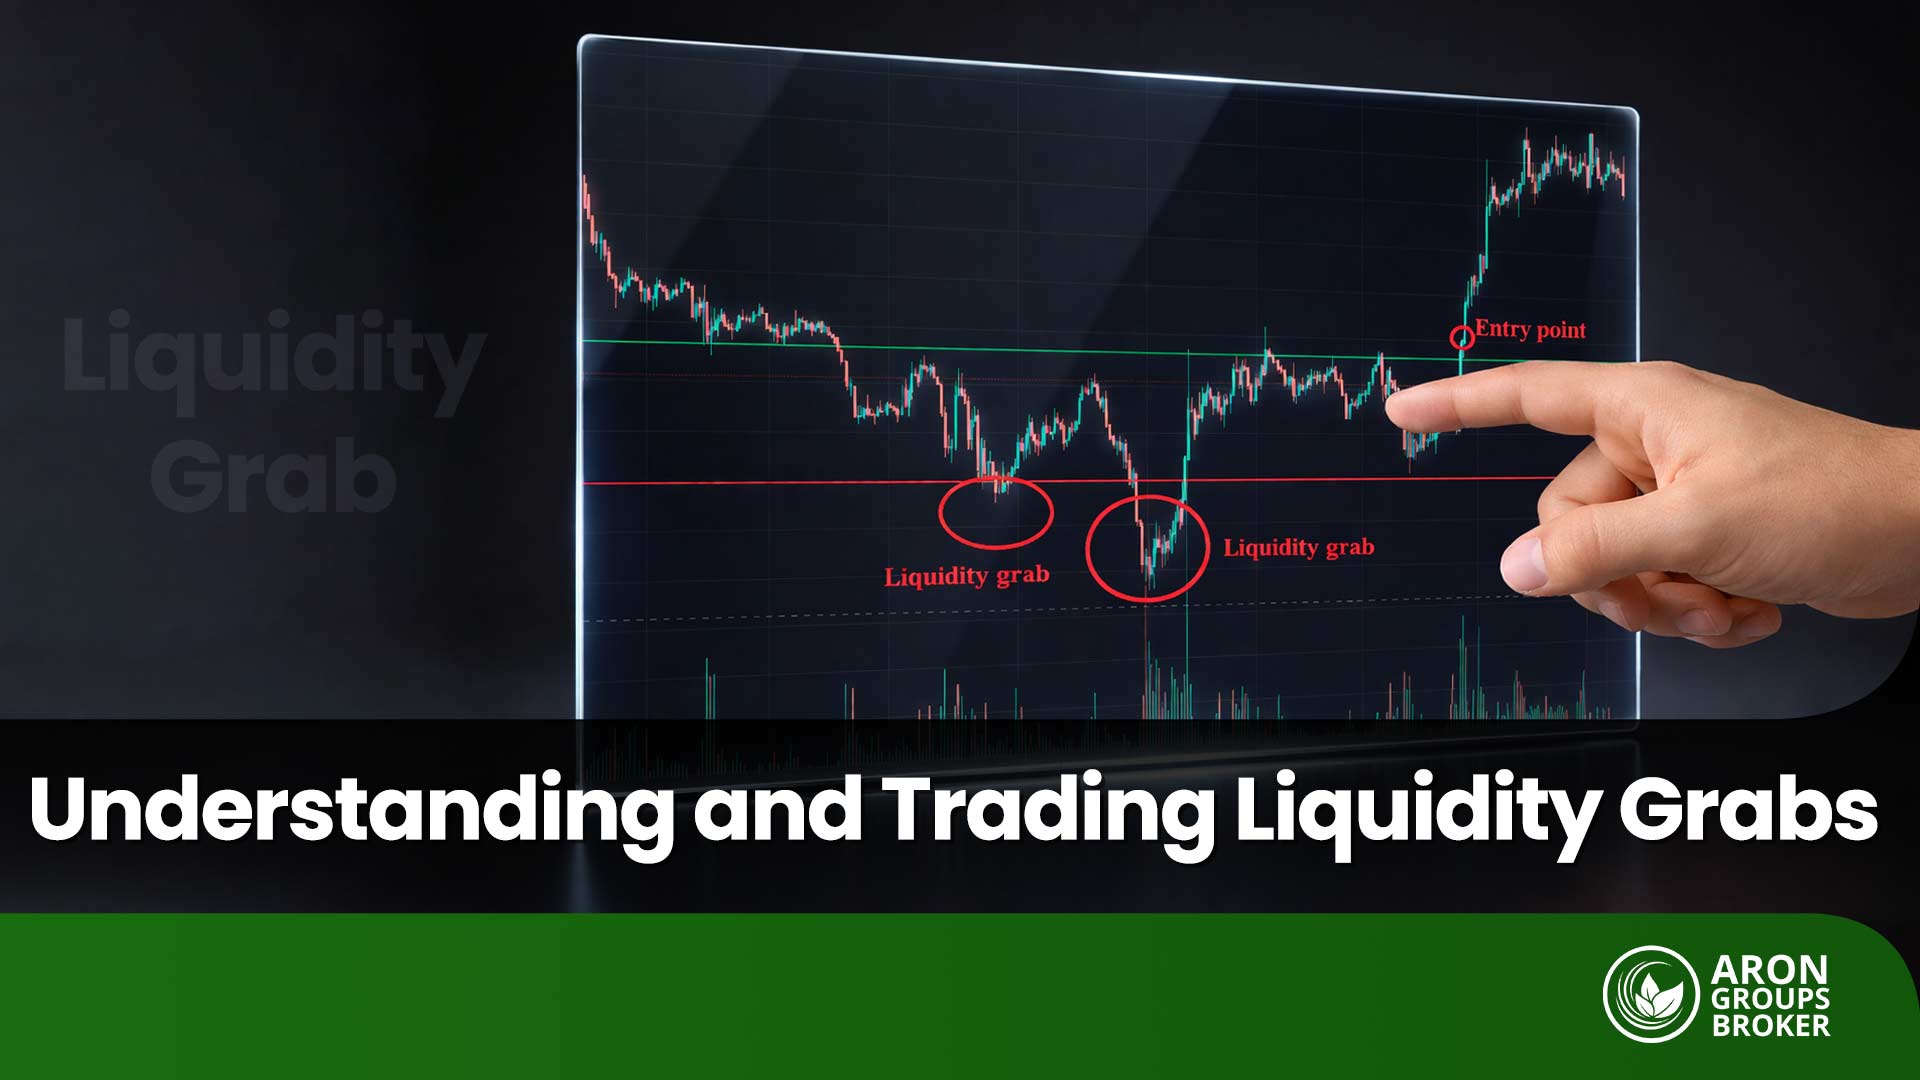
According to How to Trade, A liquidity grab occurs when the price intentionally moves beyond obvious technical levels to trigger a high concentration of clustered orders. After these orders are executed, the price typically snaps back quickly, leaving behind a long wick and trapping retail traders in losses.
In other words:
This event is a brief push through key highs or lows designed to activate resting stop-losses and various pending orders. It should be viewed as a mechanical collection of market volume rather than a definitive signal for future price direction.
Did You Know:
Regulators and central banks often describe liquidity in terms of depth, breadth, and resilience rather than a single metric.
Why Liquidity Grabs Happen?
Large institutional flows require significant counterparties, so price naturally gravitates toward specific levels where many orders are concentrated. These obvious technical levels consolidate market volume, making it easier for large players to fill positions without moving the price.
Liquidity Pools and Resting Orders
Resting orders are limit orders waiting at specific prices, creating deep pools that can absorb heavy trading volume when hit.
When these clusters are triggered, they provide the liquidity needed for major institutions to enter or exit their positions.
Volatility and Execution Risk
During volatile periods, providers widen spreads and reduce depth, which often makes stop-loss executions less predictable for retail traders. Once a stop price is triggered, it becomes a market order and fills at the next available price regardless of slippage.
Q: Why do stops fill at worse prices during fast moves?
A: Since triggered stops become market orders, your final fill depends entirely on the liquidity available at that specific moment.
Risk Note:
Using a stop-limit order offers price control, but the trade might not execute if the market gaps past your limit.
Where do Liquidity Zones Form?
Liquidity zones appear where traders subconsciously agree on safe stop placements, creating predictable areas of high order concentration.
These visible clusters form because retail habits repeat across different strategies, leading many participants to share nearly identical rules.
Common Chart Locations
- Equal Highs/Lows: Points where breakout traders cluster their stops, creating a target for the price to sweep through.
- Range Extremes: Areas where mean-reversion traders defend positions, often resulting in heavy order density at the boundaries.
- Round Numbers: Psychological levels that naturally attract significant attention and a high volume of pending limit orders.
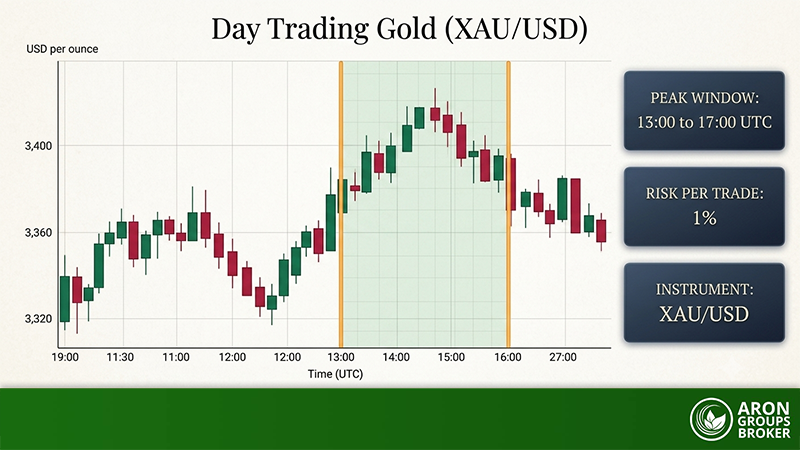
- Session Levels: Previous daily or session highs and lows, where intraday positioning usually concentrates before the next move.
Liquidity Types
Buy-side liquidity sits above highs where short-sellers place stops and breakout buyers position their entry orders for potential moves.
Sell-side liquidity resides below lows where long-biased traders place protective stops, and breakdown sellers wait for the price to drop.
| Liquidity Type | Typical Location | Common Orders | Common Mistake |
| Buy-Side | Above swing highs | Buy stops, short stops | Chasing the breakout candle |
| Sell-Side | Below swing lows | Sell stops, long stops | Selling the first spike down |
Q: What is the cleanest definition of market liquidity?
A: It represents how easily an asset trades without significantly impacting the price, especially during periods of high volume.
Trading Tip:
The bid-ask spread serves as a proxy for liquidity, as tighter spreads usually indicate a deeper, more efficient market.
Liquidity Grab vs. Liquidity Sweep
While these terms often overlap in trading communities, the most useful distinction concerns how price behaves after liquidity is taken.
- A liquidity sweep describes a price moving beyond a specific level to clear out pooled orders before potentially continuing its original path.
- In contrast, a liquidity grab emphasises a sharp rejection and a rapid return to the prior trading range after stops are hit.
Comparison Table
| Feature | Liquidity Sweep | Liquidity Grab |
| Trigger | Clears a known level | Clears a known level |
| Typical Candle | Can trend for several candles | Often shows a pronounced wick |
| Confirmation | Structure stabilises after the sweep | Re-entry into range with rejection |
Key Point:
Treat this terminology as a labelling system rather than evidence, as labels alone do not improve your trade execution.
Liquidity Grab vs. Break of Structure (BOS)
- A liquidity grab describes a brief price move, while a break of structure focuses on how the price behaves relative to swings.
- A BOS indicates a meaningful shift in market trend, whereas a liquidity grab often occurs without changing the underlying direction.
Comparison Table
| Feature | Liquidity Grab | Break of Structure (BOS) |
| Primary Focus | Taking liquidity beyond a level | Changing the swing structure |
| Typical Duration | Often brief and reactionary | Often persists and trends longer |
| Best Use | Identifying specific events | Managing context and bias |
| Failure Mode | Mistaking a wick for a reversal | Mistaking market noise for structure |
Q: Liquidity grab vs. BOS: which comes first?
A: Either can appear first, but many traders view the grab as context and wait for a BOS as confirmation.
Key Insight:
Timeframe alignment is critical because a structural break on a 5M chart may appear as a simple wick on a higher timeframe.
The Liquidity Grab Candle
A liquidity grab candle typically features a long wick that pierces a level before the price closes back inside the range. This footprint represents rapid trading through thin liquidity followed by a swift rebalancing of the market price.
The Wick Rule and Close Location
A testable rule requires the wick to break the zone while the candle body re-enters the original boundary. For stronger confirmation, the following candles should fail to reclaim the wick’s extreme point, indicating a successful rejection of that level.
Common False Positives
News spikes often create long wicks that reflect high volatility and wide spreads rather than a genuine institutional liquidity grab. Trading during illiquid hours can exaggerate wicks because smaller order flows move the price much further than during active sessions.
More Info:
Market depth describes how much volume a market can absorb without causing sharp, erratic price movements.
Liquidity Grabs Across Markets
The same patterns behave differently across markets because unique participant mixes and venue structures influence how orders are filled.
Execution quality depends heavily on the concentration of liquidity providers and the specific design of the trading venue.
Market Variations
- Forex: As a decentralised market, liquidity is dispersed across multiple global venues, often leading to rapidly changing prices during thin sessions.
- Crypto: Liquidity is highly fragmented across various exchanges, making stop-losses sensitive to temporary liquidity gaps and exchange-specific microstructure.
- Stocks: Equity markets utilise central auction mechanics and face higher gap risks, especially during earnings reports or at the market open.
Comparison Table
| Market | Typical Hours | Liquidity Behavior | Gap Risk | Slippage Risk |
| Forex | 24/5 | Deep but dispersed | Lower | Medium |
| Crypto | 24/7 | Fragmented and variable | Medium | High |
| Stocks | Exchange hours | Concentrated on one venue | Higher | Medium |
Q: How does a crypto liquidity grab differ from one in stocks?
A: Crypto involves significant venue fragmentation, while stocks are heavily influenced by centralised auctions and gaps tied to scheduled disclosures.
Liquidity Grab in ICT and SMC
In ICT and Smart Money Concepts, liquidity grabs are often framed as engineered moves targeting obvious retail orders. This narrative is useful only if you convert it into objective, testable rules rather than relying on market speculation.
Keeping the Framework Testable
Instead of trying to read institutional intent, you should use clear definitions that rely solely on visible price behaviour.
- The Level: A prior swing point or range boundary clearly visible on a higher timeframe chart.
- The Sweep: A brief excursion beyond that level that successfully triggers resting orders.
- Displacement: A strong, energetic move away from the level that indicates a clear shift in market urgency.
- Retest: A controlled return to the original sweep zone to confirm market acceptance of the new direction.
Key Point:
A defensible “smart money” approach must prioritise evidence over narrative because while theories are cheap, execution is expensive.
How to Trade Liquidity Grabs
A repeatable framework focusing on mechanical risk controls allows you to engage with liquidity events without relying on subjective signals.
By following a structured process, you can maintain discipline and avoid impulsive reactions when the price approaches major technical levels.
Step-by-Step Framework
- Identify Zones: Mark significant higher-timeframe liquidity pools, such as session highs, equal lows, or major range boundaries.
- Observe the Sweep: Wait for a clear price excursion or a pronounced wick to pierce beyond your identified zone.
- Seek Confirmation: Shift to a lower timeframe to identify a structural break or a shift in market momentum.
- Define Execution: Choose your entry type, market, limit, or stop-limit and establish a clear price point for trade invalidation.
- Manage Risk: Calculate your position size based on a predefined percentage of capital and set a hard stop-loss.
Example:
- Set up Context: Price approaches a daily resistance level where buy-side liquidity has been building for several sessions.
- Liquidity Taken: A fast spike triggers buy stops above the resistance before quickly reversing back into the range.
- Confirmation: A 5M candle closes below the previous swing low, confirming that the upward momentum has stalled.
- Entry Plan: A limit order is placed at the displacement’s origin to catch a corrective retest of the zone.
- Risk Logic: The stop-loss is set above the sweep high, while targets are placed at the nearest opposing liquidity pool.
How to Avoid Becoming the Liquidity
Most retail traders fail because they place stops in predictable locations that large players use to facilitate their own fills.
Stop Placement Mistakes
Placing a stop-loss just a few pips beyond an obvious high or low makes your position a primary target.
Consider using wider stops or waiting for the sweep to occur before entering a position to avoid being prematurely stopped.
Execution and Timing Risks
Stop orders often trigger during fast moves, leading to slippage where your realised fill is worse than your intended price.
To minimise these risks, avoid trading during major news releases or thin liquidity windows like the daily session rollover.
Liquidity Grab Indicators
Many traders look for a liquidity grab indicator in MetaTrader or on TradingView to automate detection. In practice, no indicator can reliably confirm intent or separate random noise from true liquidity events.
What can indicators do about Liquidity Grab?
Indicators can scan for equal highs, equal lows, and wick sweeps beyond recent swing points. They can also trigger alerts, which support discipline, but only when your trade rules are already defined.
What can’t indicators do about Liquidity Grab?
They cannot guarantee a wick is meaningful, because news and market microstructure can produce similar shapes. They also cannot replace risk controls, because poor sizing and weak order selection can ruin a valid setup.
Q: Is there a reliable liquidity grab indicator for TradingView?
A: Tools can flag candidates, but you still need context, confirmation, and a clear invalidation level.
Common Trap:
Backtesting wick patterns without realistic spreads inflates results, especially during thin sessions and fast conditions.
Liquidity Zone Indicators in MetaTrader and TradingView
Liquidity zone tools can help you highlight likely liquidity pools, but they do not confirm a liquidity grab by themselves. Use them to mark zones, then apply your own rules for sweep, rejection, and invalidation before you trade.
Liquidity Grab Indicator in TradingView
Log in to your TradingView account and open the chart for your chosen market.
From the top menu, open Indicators, then search for terms like “liquidity”, “liquidity zones”, or “liquidity grab”.
Review the results and choose a tool that clearly plots zones, not one that promises perfect signals.
Click the indicator to add it to your chart, then open its settings to adjust sensitivity and lookback length.
Liquidity Grab Indicator in MetaTrader
MetaTrader (MT4/MT5) does not include a liquidity grab or liquidity zone indicator by default. You must download a third-party liquidity zone or liquidity finder indicator compatible with your platform version.
In MetaTrader 5, click File from the top menu, then select Open Data Folder.
Copy the downloaded indicator file into the correct folder for your platform:
- MT4: MQL4 → Indicators
- MT5: MQL5 → Indicators
Restart MetaTrader or refresh the Navigator to load the new indicator.
Then go to Insert → Indicators → Custom, and select the liquidity zone indicator to apply it.
Once zones are plotted, treat them as areas of interest, not trade commands.
Confirm a sweep-and-rejection with price action, and define invalidation before you place any order.
Common Mistakes and Misconceptions
- Treating every wick as manipulation.
A wick can come from news, thin liquidity, or spreads, so assuming intent blocks real analysis. - Ignoring higher-timeframe context.
Trading every sweep in isolation is risky because a grab against a strong trend often becomes a continuation of that trend. - Skipping confirmation and trading the first spike.
Entering on the initial excursion invites whipsaws, because the first move is frequently the liquidity-taking move. - Placing stops in obvious locations.
Stops just beyond equal highs or lows often sit inside liquidity pools, so you get removed before the trade develops. - Overfitting rules until the past look perfect.
If your method needs many exceptions, it is curve-fitting, not a repeatable trading rule.
Did You Know:
Many frameworks separate market liquidity from funding liquidity because each can break under different conditions.
Conclusion
Treat liquidity grab analysis as an objective research process rather than a belief system or a search for market conspiracies. Utilise high-quality educational materials and official market research to understand the mechanics of order types and trade execution.
Patterns are irrelevant if your method cannot survive the reality of spreads, slippage, and uncertain fills during live trading.