icon icon Home
icon icon Accounts
icon icon Quick start
icon icon Symbols

The 1% vs 2% Risk Rule: How Much Risk Per Trade Is Sensible?

Author
Abe Cofnas
Abe Cofnas
calendar Last update: 2 February 2026
watch Reading time: 16 min

Markets rarely destroy traders with one bad idea. They destroy them through repeated sizing mistakes

Risk per trade is the budget that keeps your process stable, even when the market is noisy and your confidence swings.

The real objective is equity preservation, because surviving drawdowns is what allows skill and edge to compound over time. A stable risk budget protects decision quality during losing streaks, and it also makes your performance data clean enough to review.

Risk per trade is the maximum amount of capital a trader is willing to lose on a single position, expressed as a percentage of account equity and calculated before entering the trade, including stop-loss distance and realistic trading costs.

bookmark
Key Points:
  • Track your total open risk daily, because correlation can exceed your per-trade rule without warning.
  • Build a “risk downgrade” rule for bad sleep, stress, or rushed sessions, because execution quality drops.
  • Use a fixed review ritual after loss limits, because reflection beats revenge trading every time.
  • Avoid changing risk after a winning streak, because variance often reverses when confidence peaks.
risk per trade

What Does Risk Per Trade Mean?

According to sources like Pepperstone, Risk per trade is the maximum loss you accept on one position, including realistic trading costs, before you enter. It is a decision you make in advance, and it should not be renegotiated once the trade is live.

Many traders assume risk equals the stop-loss distance, but that is only one piece of the picture. The executed loss can be larger than planned, even when your stop is correct and your setup is valid.

Execution can move against you during entry or exit, especially when spreads widen around news or low liquidity. Slippage can also occur when fills deviate from your expected price, which increases the realised loss.

Lorem ipsum dolor sit amet, consectetur adipiscing elit. Ut elit tellus, luctus nec ullamcorper mattis, pulvinar dapibus leo.

sms-star

Key Point:
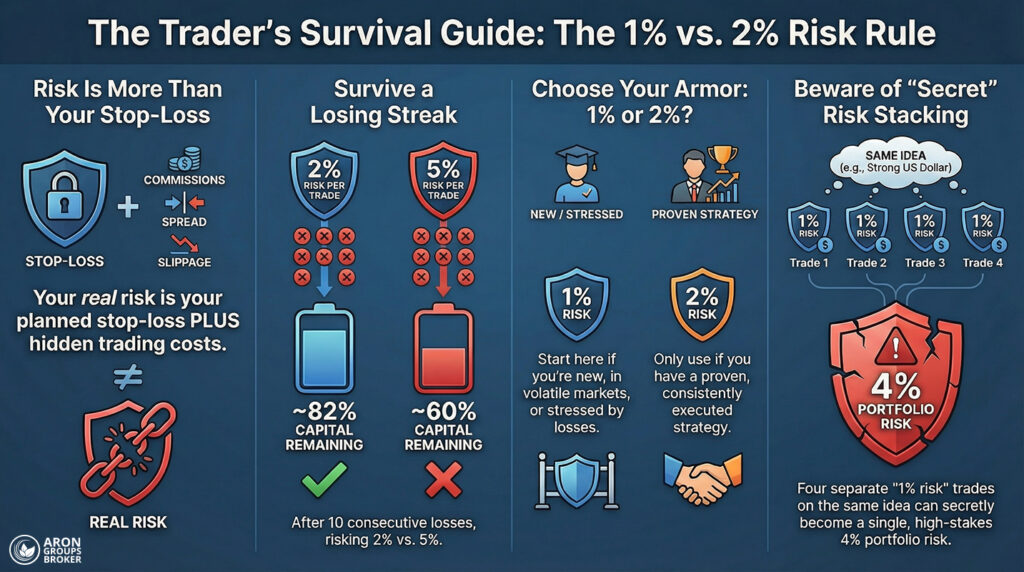
If you cannot state the risk in cash terms before entry, you do not have a risk-per-trade rule.

Q: Is risk per trade the same as a stop-loss?
A: No, because trading costs and slippage can change the realised loss, even with a fixed stop.

Three Risk Layers To Separate

Risk is not one number, because your losses come from several linked mechanisms that can stack in the same session. Separating these layers prevents false confidence, especially when a “safe” percentage hides multiple sources of exposure.

  • Planned risk: Your stop distance and position size, which define the loss if the stop is reached.
  • Execution risk: Spread, commission, and slippage, which can increase the realised loss beyond your plan.
  • Portfolio risk: Several positions are losing together because they share one driver, such as USD strength or risk sentiment.

Portfolio risk is the silent account killer, because two different symbols can still be the same trade in disguise. This is common in USD pairs and risk-on assets, where one macro move can hit several positions at once.

sms-star

Key Insight:
Correlation can turn “1% per trade” into 4% portfolio risk when multiple trades rely on the same idea.

Q: How much of your account should you risk per trade if you hold several positions?
A: Reduce the per-trade number, or cap total open risk across positions and themes so one move cannot dominate your account.

Why 1% and 2% Risk Rules Exist

risk per trade

The 1% rule and 2% rule are forms of fixed fractional money management, where you risk a set percentage of current equity. Because the risk is tied to equity, your position size adapts automatically as the account rises or falls over time.

This approach solves a structural problem by preventing one trade from inflicting career-level damage on your account. It also scales risk down during drawdowns, which reduces the chance that losses accelerate into a spiral.

The hidden goal is survival while you improve, because skill develops only if you stay in the game long enough. Smaller risk keeps behaviour consistent and makes your journal data meaningful, so you can diagnose mistakes without noise.

sms-star

More Info:
If your system is unproven in live conditions, start at 1% and earn 2% through stable execution.

Q: How much do day traders risk per trade?
A: Many aim for 0.25% to 1% because frequent trading increases exposure to streaks, costs, and execution errors.

When To Risk 1% Vs 2% Per Trade

Percentages are not moral rules, because they are engineering choices designed to control variance and behaviour under pressure. The right number depends on how volatile your market is, how reliable your execution is, and how you react to losses.

When 1% Risk Per Trade Fits Best

1% is usually safer when you are new to live execution, trade high-volatility markets like gold or crypto CFDs, or face high costs. It is also the better default if one losing trade makes you feel stressed, because stress often leads to stop-moving and revenge trades. 

In practice, 1% reduces behavioural interference and limits the damage from inevitable mistakes during the learning phase.

When 2% Risk Per Trade Is Reasonable

2% can be reasonable when you have a verified edge over a large sample and place stops based on structure, not discomfort. It also helps if your fills are stable in your trading session and you cap total open risk across positions and themes. 

However, 2% is still aggressive for many accounts, and it becomes reckless when correlation and trading costs are ignored.

sms-star

Key Point:
Use 2% only if you can follow it after three losses in a row without changing the rules.

Q: Should I ever risk more than 2% per trade?
A: It is rarely necessary, and it often signals poor selectivity, unmeasured variance, or an attempt to force outcomes.

Survival Maths: Losing Streak Impact

A losing streak is not a moral failure because it is simply a statistical event that every strategy experiences sooner or later. Your job is to make the streak survivable, so you can keep executing the same rules until probability has time to work.

With fixed fractional sizing, equity shrinks multiplicatively, which means losses compound rather than add up in a straight line. After n losses, equity becomes (1 − risk)ⁿ, and that compounding is why high risk per trade breaks accounts quickly.

Equity After Consecutive Losses

Risk per tradeAfter 5 lossesAfter 10 lossesAfter 20 losses
1%95.1%90.4%81.8%
2%90.4%81.7%66.8%
4%81.5%66.5%44.2%
5%77.4%59.9%35.9%
10%59.0%34.9%12.2%

At 2%, ten losses still leave roughly 80% equity, which is painful but usually recoverable with consistent execution. At 5%, the same streak cuts you near 60%, and that drawdown often triggers rule-breaking and defensive decision-making.

At 10%, you end up fighting your nervous system rather than the market, because each loss feels existential. Even a good strategy becomes hard to execute, and you start protecting your ego rather than the process.

sms-star

More Info:
Correlation can create a “streak” from one macro event, not ten separate decisions across independent ideas.

Q: Is a 4% risk per trade terrible?
A: It is often too high because a normal losing streak can force defensive trading and rule-breaking before your edge recovers.

Risk Of Ruin And Drawdown

Traders often quote win rate, but win rate alone cannot describe survival because payoff and drawdown tolerance matter just as much. Risk of ruin depends on how often you win, how much you win when right, and how quickly losses compound when wrong.

Risk of ruin is the chance of hitting an unacceptable drawdown, which can mean liquidation or a level that breaks your plan. Many traders never reach zero, yet they still become “ruined” because drawdowns force them to trade smaller and make poorer decisions.

Example: 80% Drawdown Risk

The table below is illustrative, using simple assumptions to show how risk per trade changes outcomes under variance. Assumptions include a 1:1 payoff and fixed fractional risk, with “ruin” defined as an 80% drawdown.

Win rate1% risk2% risk5% risk10% risk
40%Very lowModerateVery highNear certain
50%Very lowVery lowMeaningfulHigh
60%Very lowVery lowLowMeaningful

This table is not prophecy, but it is a useful lens for understanding variance and compounding under stress. High risk per trade turns variance into a deadline, because you may hit a critical drawdown before your edge can recover.

sms-star

Key Insight:
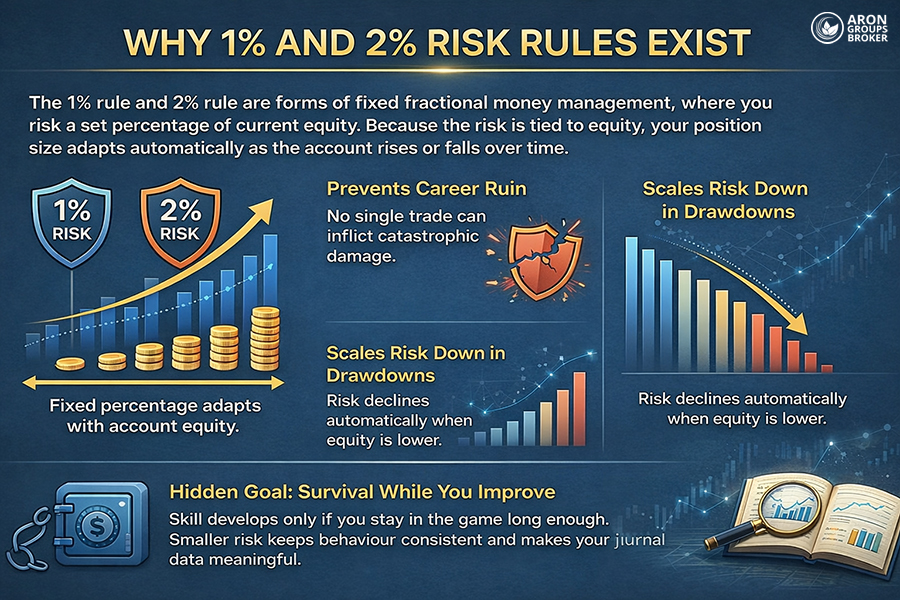
Your edge needs time to express itself, and higher risk shortens the time you can stay consistent.

Q: Why does 5% become dangerous even with a decent strategy?
A: Loss clustering can arrive early, and a few bad sequences can overwhelm long-run probabilities before they have time to balance.

Hidden Costs That Increase Risk Per Trade

Most platforms show stop distance clearly, but they rarely display total trading friction as part of your risk budget. Real trading includes costs and execution effects, so your realised loss can exceed the number you planned.

Slippage is the difference between the expected price and the executed price, and it is more common in fast markets. It also appears more often with market orders, because the fill must chase available liquidity during quick moves.

Spread can widen during news or thin liquidity, and commission may look small but compounds with frequent turnover. If you ignore these costs, you mislabel your true risk per trade and overestimate the safety of your sizing.

Table: Planned Vs Realised Risk Per Trade

ComponentExample valueWhy it matters
Stop-loss risk2.0%Your intended loss ceiling
Spread cost0.3%Often higher in volatile minutes
Commission0.2%Fixed friction per round trip
Slippage0.5%Common during fast moves
Real risk3.0%What your account actually experiences

The numbers vary by instrument and session, but the point is structural rather than precise. If you ignore costs, your 2% rule may be fiction, especially around news or illiquid trading hours.

sms-star

Key Point:
Budget a small friction buffer, particularly around news releases or thin liquidity, where spreads and slippage worsen.

Q: Can slippage be positive?
A: Yes, but risk management should budget for adverse outcomes, not occasional lucky fills.

Risk Per Trade Vs Leverage

Leverage changes exposure, while risk per trade controls your loss at the stop, so the two concepts must be separated. You can trade higher leverage with low risk by using a smaller size and a structurally valid stop, not by hoping.

A simple exposure check prevents hidden blow-ups: 

  • First, calculate your cash loss at the stop, 
  • Then the total open risk. 

Many accounts fail because traders size one position correctly, then stack several correlated trades that amplify the same move.

sms-star

More Info:
If two trades rely on the same USD move, treat them as one idea for sizing and cap the total risk accordingly.

How To Calculate Risk Per Trade

This is the part most traders want, and it is also where most mistakes hide because the sequence matters. If you calculate size before defining the stop, you are guessing risk rather than controlling it.

Step 1: Set Maximum Risk Per Trade

Pick a number you can follow on a bad day, not only on a confident day after a win. For many traders, that range is 0.5% to 2%, depending on experience, costs, and volatility. If you feel compelled to increase risk to make it worth it, your process is not ready.

Step 2: Set Stop-Loss From Structure

Stops should sit where your trade idea is invalid, such as beyond a swing level or range boundary. A stop is an engineering decision because it defines the scenario where you accept being wrong and exit.

Step 3: Convert Stop Distance To Cash Risk

Risk amount = Account equity × Risk percentage

, which gives the maximum cash loss you will tolerate. The stop cost per unit depends on the instrument, so forex requires pip value calculation before sizing.

Step 4: Calculate Position Size

Position size = Risk amount ÷ Stop distance 

In cash terms, this makes risk consistent across different setups. This is the risk per trade formula you can execute repeatedly, without changing behaviour under pressure.

sms-star

Learn More:
A risk per trade calculator is useful, but only if your stop distance and cost assumptions are honest.

Example: Calculate Forex Risk Per Trade In Pips

Assume a USD 5,000 account and a 1% risk per trade rule, so your risk amount is USD 50. If your stop is 200 pips, you can risk USD 0.25 per pip on that setup, before costs are added. Your lot size must convert that pip risk into volume, turning pips into a cash risk you can control.

Lot sizes as a practical reference

Lot typeUnitsTypical label
Standard100,0001.00 lot
Mini10,0000.10 lot
Micro1,0000.01 lot

Some brokers support smaller units, and smaller units make precise sizing easier when you are building consistency. They also reduce the temptation to force a nice round lot size that does not match your stop distance.

Q: How many pips should I risk per trade?
A: Pips are not risk, because risk depends on lot size, pip value, and your planned cash loss at the stop.

Volatility Trap And Position Sizing

risk per trade

Fixed stops feel tidy, but they are often wrong in volatile markets because volatility changes across regimes and sessions. A stop that works in a quiet session can be too tight in a fast one, even when the setup is valid.

A volatility-adjusted method starts with actual movement rather than ego, and many traders use Average True Range (ATR) for this. Stops are placed relative to recent movement, so the stop adapts when the market expands or contracts.

The critical step is resizing, because a wider stop must be matched with a smaller position to keep cash risk constant. If stop distance increases and size does not decrease, you silently increase risk per trade without noticing it.

Volatility-Adjusted Position Sizing Steps

Choose an ATR length that matches your holding period, so the measure reflects your trade horizon rather than noise. Place the stop at a multiple that suits the instrument, then recalculate the position size from your fixed cash risk. Recompute the sizing when volatility shifts materially, especially after news-driven moves or regime changes.

sms-star

Key Insight:
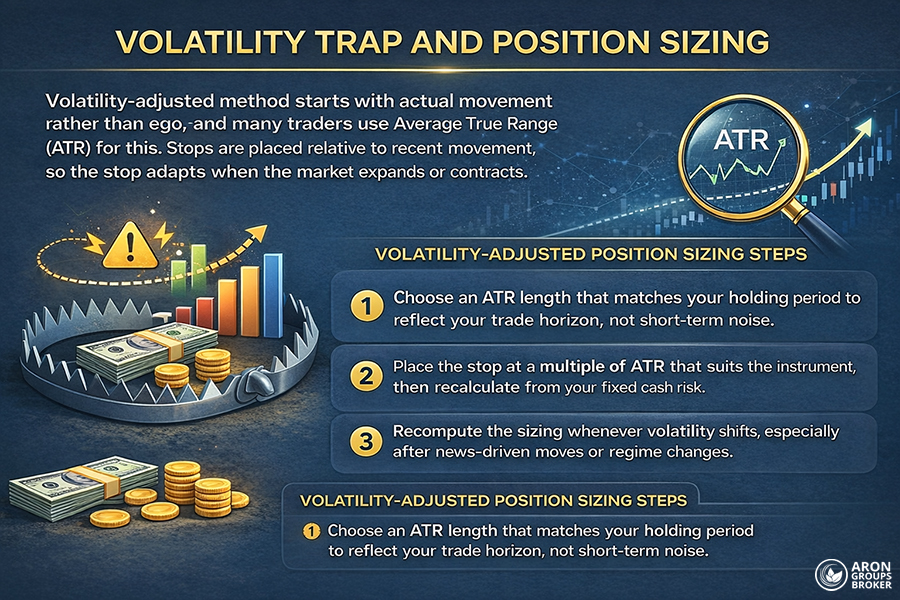
In gold and crypto, your stop method matters less than your resizing discipline when volatility expands suddenly.

Q: Why is a fixed 20-pip stop a trap?
A: The same stop can be too tight today and irrelevant tomorrow, because volatility changes across sessions and regimes.

Small Accounts: Risk Per Trade And Costs

Small accounts face a friction problem because spreads and commissions can take up a large share of the planned risk. That inflates realised risk even when your stop is correct, which makes your risk rule behave more aggressively than intended.

If your stop is very tight, spread becomes a big fraction of the trade, especially in illiquid hours or volatile minutes. In practice, a 1% risk per trade rule can behave like 1.3% once costs and execution effects are included.

Two fixes are usually better than forcing tighter stops: 

  1. Use smaller position units if available, 
  2. Or widen the stop and reduce the size. 

Both approaches keep cash risk constant while reducing cost distortion, which improves consistency over time.

sms-star

Key Point:
If costs consume a large share of planned risk, change execution timing or stop structure before raising risk.

Maximum Risk Per Trade Needs Portfolio Limits

A single-trade limit is necessary, but it is not sufficient because portfolio exposure can exceed your rule through correlation and stacking. You also need portfolio limits, so one bad session cannot turn into a week of damaged behaviour and distorted decision-making.

Add A Daily Loss Limit

A daily loss limit stops tilt trading and prevents strategy drift when you are stressed, tired, or trying to win it back. Many traders set it at two to three times their per-trade risk, then stop trading for the day when it is hit.

Add A Weekly Drawdown Limit

Weekly limits slow down spirals and create time for review, because mistakes often repeat when you keep trading through frustration. If you hit the limit, reduce size or pause trading until you can identify what changed in execution or conditions.

Add A Per-Idea Risk Limit

One macro theme can dominate several instruments, creating hidden correlations even when charts look different. Cap risk across related trades, not only symbols, so one news event cannot hit multiple positions at once.

sms-star

Key Insight:
Per-idea caps matter most during news-heavy weeks, when markets move as one system rather than separate charts.

Why 1% Risk Per Trade Improves Discipline

Risk per trade is also a nervous system control because smaller losses reduce the urge to interfere and override your plan. When traders over-risk, they move stops more often and cut winners early to relieve anxiety, which damages expectancy.

A 1% risk budget can reduce emotional pressure and improve execution without changing the strategy or adding complexity. In many cases, fewer unforced errors beat better indicators, because consistent sizing keeps your process intact.

sms-star

Did You Know:
Many traders underperform backtests because they cannot maintain consistent sizing once stress and real losses arise.

Mistakes That Break The 1% Or 2% Rule

Most failures are predictable because they feel reasonable in the moment when pressure and noise are highest. A simple checklist makes them avoidable, since it forces you to confirm risk inputs before you commit capital.

  • Measuring risk from entry, not stop: Risk is defined by stop distance and position size, not by how confident the entry feels.
  • Widening stops without resizing: A wider stop requires a smaller position; otherwise, your cash risk increases without permission.
  • Increasing risk after a winning week: Variance eventually collects that debt, and the first losing streak becomes a confidence shock.
  • Ignoring correlation: Different symbols can still be the same trade, so your “1% rule” can become 3% in disguise.
  • Trading without a cost budget: Spread and slippage inflate realised losses, especially in volatile minutes and illiquid sessions.
sms-star

Key Point:
Most blow-ups come from a short period of broken sizing, not from one bad trade.

Q: Is risking 10% per trade ever rational?
A: It is rarely rational, because one ordinary streak can remove your ability to execute the next trade calmly.

MT5 Workflow For Faster Position Sizing

Most sizing mistakes happen when you rush, so a workflow reduces cognitive load and keeps decisions consistent. The goal is fewer unforced errors, not faster clicks, because speed without control usually increases slippage and mistakes.

Use a repeatable sequence before every order: 

  • Define the stop first, then compute the position size from cash risk. 

If you use one-click execution, rely on preset volumes, and never guess a lot size in the moment.

A simple template you can reuse

  • Equity = 5000
  • RiskPercent = 0.01
  • RiskAmount = Equity * RiskPercent
  • StopPips = 200
  • CashPerPipAllowed = RiskAmount / StopPips

Then convert cash per pip into the correct lot size for that pair, and use a calculator if the conversion is uncertain. A fast calculation is valuable only when it is accurate, because incorrect sizing defeats the entire risk system.

sms-star

Key Insight:
The best risk-per-trade calculator is the one you will actually use for every order.

Conclusion

Risk per trade is not a magic percentage because it is a structural constraint that protects your learning curve under stress. Most traders improve faster by reducing sizing errors and respecting costs, rather than increasing risk to chase faster results.

Start at 1% as a practical baseline, and move towards 2% only after consistent execution and clear portfolio caps.

Continue Reading
not-found
calendar 2 February 2026
Rate this article
Plugin not installed

Leave a Reply

Your email address will not be published. Required fields are marked *

No thanks