Many traders discover why most trading strategies are fake after “perfect” backtests fail in live conditions and real execution. This disappointment often arises when marketing certainty collides with market uncertainty, where slippage, drawdown, and emotional discipline matter more than chart perfection. Read on to learn how to spot overfitting signals and how to validate a strategy for real-world trading.
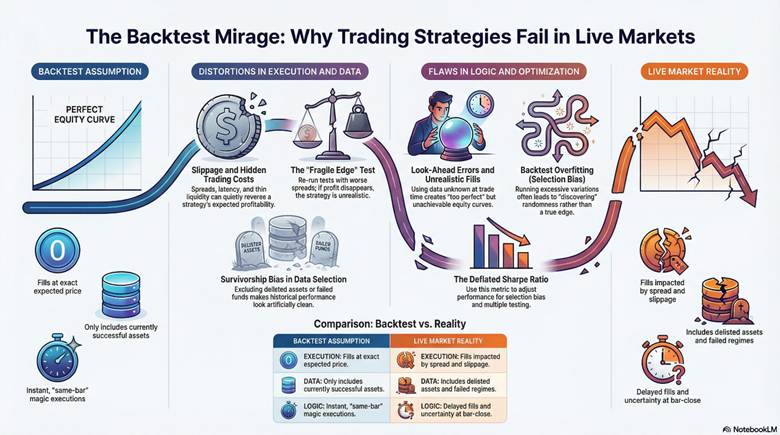
- Most “fake” strategies are not scams; they fail because over-optimisation and curve fitting create fragile, non-repeatable backtest results.
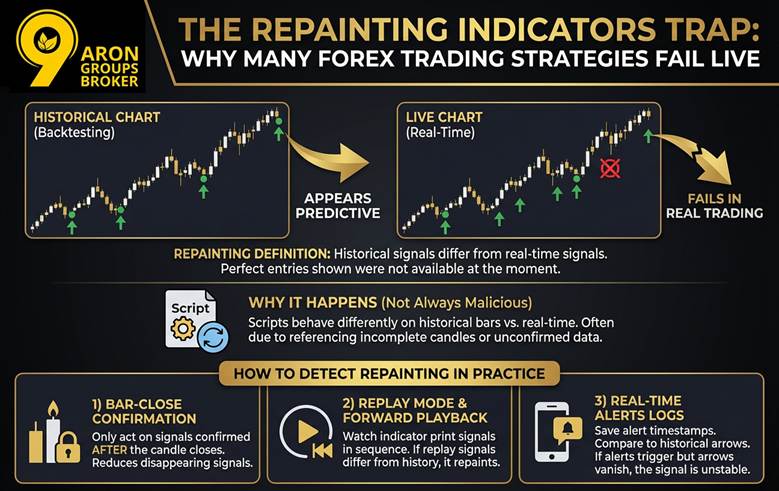
- Repainting indicators can rewrite history, so chart-perfect signals may never have existed in real time.
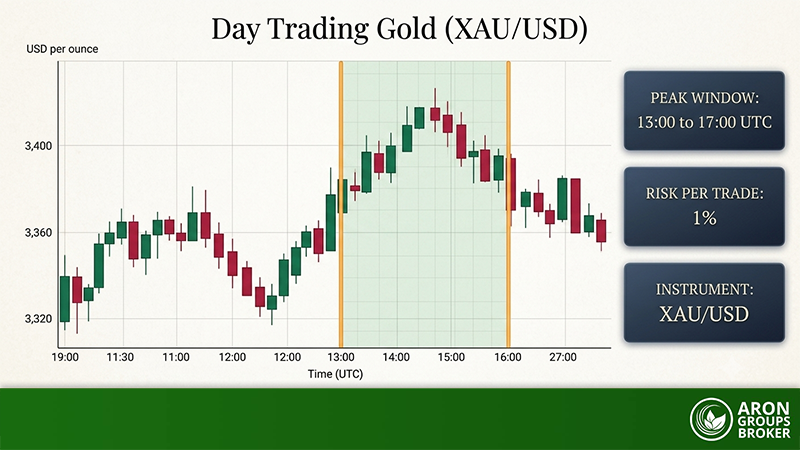
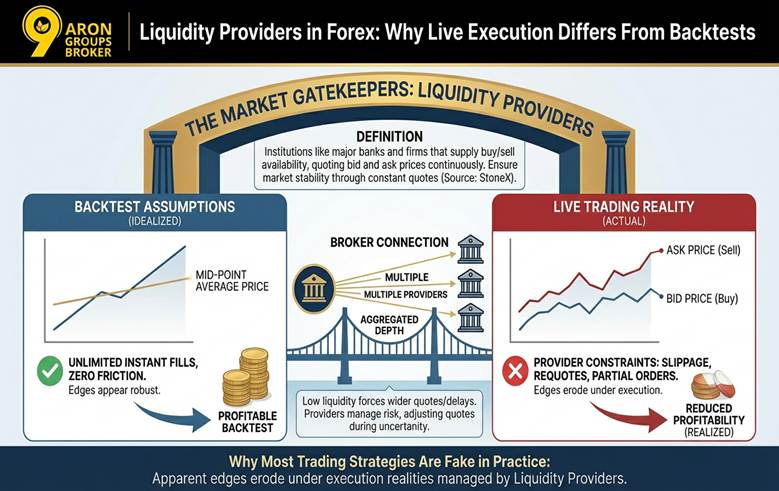
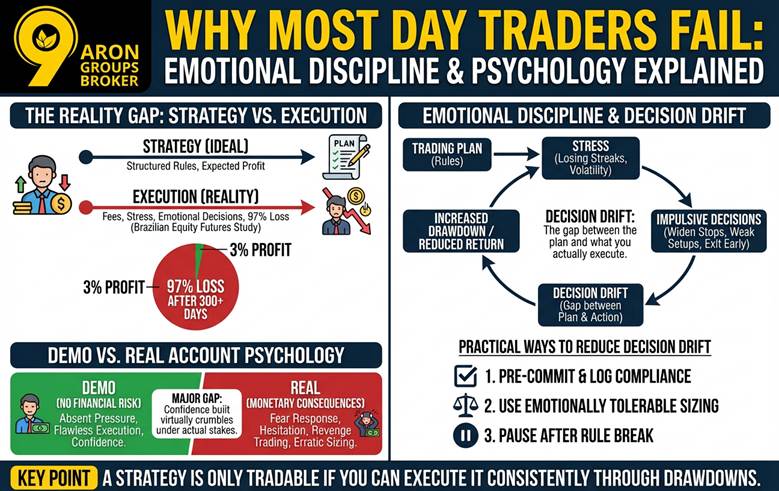
- Live execution is a gatekeeper: spreads, slippage, liquidity drops, and partial fills can erase small statistical edges.
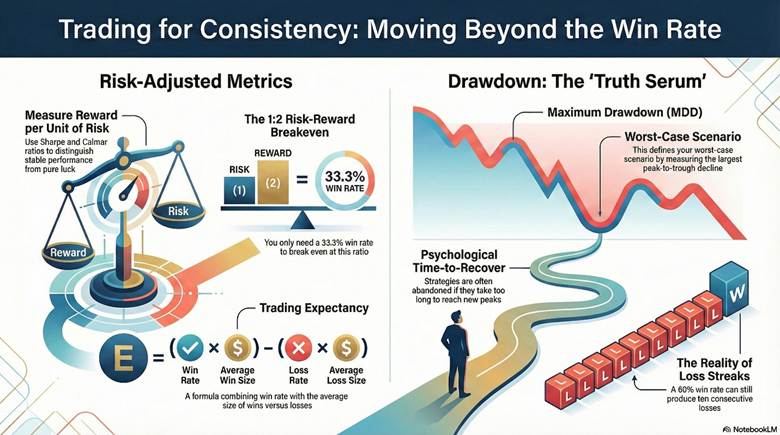
- Consistency is behavioural and risk-based: disciplined execution through drawdowns and risk-adjusted metrics matter more than win rate.
Why Most Trading Strategies Are Fake: What “Fake Strategy” Really Means in Trading
Many traders assume “fake” means fraud or a deliberate scam. In practice, “fake” often means the strategy only works because it was over-optimised for history.
A strategy can look brilliant in a backtest and still be structurally fragile. That is the core reason why most trading strategies are fake in real trading outcomes.
Did You Know:
Regulators consistently warn that many retail CFD accounts lose money due to leverage and product structure.
What “Fake” Looks Like in a Strategy Report
A “fake” strategy usually shows one or more statistical illusions. The most common are curve fitting, survivorship bias, and unrealistic execution assumptions.
It may also ignore slippage and spreads, which change the results materially. That gap becomes obvious when you compare trading strategy backtesting vs live trading.
Curve Fitting vs Robust Edge: The Real Difference
Curve fitting happens when a model memorises noise rather than capturing a repeatable market tendency. It can create a “perfect system” that fails immediately out-of-sample.
A robust edge behaves reasonably across different volatility regimes and sample windows.
It does not depend on one specific year, one pair, or one market mood.
This is where traders misread the phrase “best forex trading strategy for consistent profits.”
“Best” should mean robust and repeatable, not maximum historical profit.
Key Point:
If small rule changes destroy results, the strategy likely has no stable edge.
Repainting Indicators Trap: Why Many Forex Trading Strategies Fail Live
Repainting indicators can make charts look predictive while failing in real trading. This is one reason why most trading strategies are fake once you test them live.
Repainting means historical signals can differ from real-time signals. So the chart shows “perfect” entries that were not available at the moment.
According to TradingView, repainting occurs when scripts behave differently on historical bars than in real-time. That difference can distort the trading strategy backtesting vs live trading comparison.
Repainting is not always fraud or an intentional trick. It can happen when scripts reference incomplete candles or unconfirmed data.
This is part of the truth about forex trading strategies that marketing rarely explains.
Indicators can look precise historically while being unstable during live formation.
Key Insight:
Repainting is not always malicious; it may result from how scripts use incomplete bars.
How to Detect Repainting in Practice
You do not need advanced tools to test for repainting. You need repeatable checks that compare real-time behaviour to history:
1)Bar-close confirmation
Only act on signals confirmed after the candle closes. This reduces signals that appear and disappear on the active bar.
2) Replay mode or forward playback
Watch the indicator print signals in sequence, not as a finished history. If replay signals differ from the chart history, repainting is likely.
TradingView notes scripts can show different results after refreshing, which is a repainting symptom.
3) Real-time alert logs
Set alerts and save timestamps when signals trigger. Compare alert times to historical arrows later on the chart.
If alerts are triggered but arrows later vanish, the signal is unstable. That instability can break the “best forex trading strategy for consistent profits” claims.
Q: Are repainting indicators always useless?
A: Not always, but they are unreliable for backtest-like signal claims without strict confirmation rules.
Key Insight:
Repainting is not always malicious. It can be a by-product of how scripts reference incomplete bars.
Why Backtests Lie: Hidden Distortions in Trading Strategy Backtesting vs Live Trading
Backtests can look objective, yet they often reward unrealistic assumptions. This creates a gap between trading strategy backtesting vs live trading outcomes.
Even honest strategies can fail when real execution and market regimes change. That mismatch is a core reason why most trading strategies are fake in practice.
The four distortions below are common, measurable, and fixable. Treat them as a checklist, not an accusation.
Trading Costs and Slippage
Slippage is the difference between the expected price and the execution price.
According to Investopedia, slippage is the exact price difference on a trade.
Small friction can destroy scalping-like edges. If your average win is tiny, costs can quietly reverse expectancy.
Costs are rarely only commission. Spreads, slippage, and latency are part of real execution, especially in fast markets.
Liquidity conditions also matter. When depth is thin, large or urgent orders can be filled worse than expected.
Practical check:
Re-run tests with worse spreads and realistic slippage. If profitability disappears, the edge is fragile.
Survivorship Bias and Data Selection
Survivorship bias happens when your dataset includes only “survivors” and ignores failures. It leads to flawed decisions using data that includes only successful results.
In backtesting, that means you may exclude delisted assets or failed funds. The history looks cleaner because the worst outcomes are missing.
Data selection can also hide regime variety. A trend-heavy period can make almost any trend method look like the “best” solution.
This distortion feeds unrealistic expectations about the best forex trading strategy for consistent profits. Consistency requires robustness across conditions, not one favourable sample.
Look-Ahead Errors and Unrealistic Fills
Look-ahead bias occurs when a test uses information not available at the trade time. According to the Corporate Finance Institute, it is using data that was unknown during the studied period.
This can happen through coding mistakes or data timing errors. For example, a signal may accidentally reference a future bar index.
Unrealistic fills are another quiet issue. Backtests often assume fills at prices you could not reliably achieve.
These mistakes can produce “too perfect” equity curves. They also explain why most day traders fail when live uncertainty returns.
Practical check:
Enforce bar-close logic and realistic order rules. Assume delayed fills and reject same-bar “magic” executions.
Backtest Overfitting and Selection Bias
Overfitting happens when you test many variations and select the luckiest winner. The more trials you run, the higher your chance of “discovering” randomness.
Academic work warns that multiple testing inflates apparent performance. Some sources formalise this as the Probability of Backtest Overfitting.
Selection bias then amplifies the problem. You publish the best curve and forget the many failed variations.
This leads to disappointing out-of-sample results and larger drawdowns. It can also damage emotional discipline during live trading.
Q: What is the single biggest “backtest lie” traders overlook?
A: Multiple testing and overfitting, because the chosen winner is often a statistical fluke.
More Info:
The Deflated Sharpe Ratio was proposed to adjust performance for selection bias and backtest overfitting.
Liquidity Providers in Forex: Why Live Execution Differs From Backtests
Live markets feature gatekeepers that control order flow. Liquidity providers act as these institutions. They quote bid and ask prices continuously.
Chart prices show mid-point averages often. Actual fills occur at available bid or ask levels. This creates immediate differences from backtest assumptions.
Liquidity providers include major banks and firms. They supply buy and sell availability for smooth execution. According to StoneX, they ensure market stability through constant quotes.
Brokers connect to multiple providers. This aggregates depth for better pricing. Low liquidity forces wider quotes or delays. Trading strategy backtesting vs live trading exposes these gaps. Backtests assume unlimited instant fills. Live conditions involve real provider constraints.
This friction contributes to why most trading strategies are fake in practice. Apparent edges erode under execution realities. Slippage and partial orders reduce profitability. Liquidity providers manage risk carefully. They adjust quotes during uncertainty. Traders face requotes or worse prices.
Why Liquidity Changes Your Strategy’s Real Results
Liquidity is not constant across time, sessions, or events. When liquidity drops, spreads widen and fills become less predictable.
Low-liquidity conditions can cause partial fills or missed price levels. ThinkMarkets notes low liquidity can lead to partial fills and requotes, alongside wider spreads.
Stop-loss execution can also worsen when markets gap through levels. Your stop becomes “next available price,” not the price you planned.
News releases are a common problem zone. So are rollovers, session transitions, and holidays with thin participation.
If you are comparing trading strategy backtesting vs live trading, model liquidity stress. Otherwise, your “best forex trading strategy for consistent profits” is only “best” on a clean history.
| Topic | Backtest Assumption | Live Reality |
|---|---|---|
| Fills | Instant at close/price | Variable fills, re-quotes, partial fills |
| Costs | Often ignored | Spread, commission, and slippage apply |
| Data | Clean history | Bias risk and missing failures can skew results |
| Signals | Perfect hindsight | Real-time differences can change decisions |
Practical checklist to reduce execution surprises:
- Avoid testing only during one “easy” regime, like persistent trends.
- Add conservative spreads and slippage assumptions to every backtest.
- Limit trading during known thin-liquidity windows and major news events.
Q: What do liquidity providers actually do for retail traders?
A: They stream bid/ask quotes and provide availability so trades can execute without waiting for a matching counterparty.
Why Most Day Traders Fail: Emotional Discipline and Psychology Explained
Many traders assume a “good strategy” guarantees profit. In reality, execution quality and behaviour often decide outcomes. Research shows persistence alone does not ensure improvement.
In Brazilian equity futures, 97% who day traded for more than 300 days lost money. That finding explains why most day traders fail despite having structured rules. Fees, risk-taking, and stress can erode small edges over time.
This is also part of the truth about forex trading strategies. A method can be valid, yet untradeable for the person using it.
When a trader cannot follow rules through a drawdown, results diverge from expectations. That gap is why why most trading strategies are fake in real-world performance.
Emotional Discipline and Decision Drift
“Decision drift” is the gap between the plan and what you actually execute. It usually grows during losing streaks, volatility spikes, or missed opportunities.
Stress pushes traders to change rules midstream. They widen stops, take weaker setups, or exit winners early.
Psychology research in trading education consistently highlights that emotions trigger impulsive decisions. Those impulses often replace a process with reactive behaviour.
Decision drift often starts subtly. One skipped trade becomes a missed sequence of valid trades. Then the trader “makes up” performance with a larger size. That increases drawdown and reduces risk-adjusted return.
This cycle helps explain why a strategy that looks solid becomes inconsistent. The trader is no longer trading the same system.
Practical ways to reduce decision drift:
- Pre-commit to entry and exit rules, then log compliance daily.
- Use position sizing that keeps losses emotionally tolerable.
- Pause after a rule break to prevent a second mistake.
Key Point:
A strategy is only tradable if you can execute it consistently through drawdowns.
Demo vs Real Account Psychology
Demo accounts simulate trading without financial risk. Performance often excels due to absent pressure. Real accounts introduce monetary consequences. Risk perception shifts dramatically. Losses feel personal and painful.
Position sizing becomes conservative or erratic. Hesitation delays entries. Revenge trading increases sizes after losses.
Demo vs real account psychology creates major gaps. Confidence built virtually crumbles under actual stakes.
Studies show traders execute flawlessly in simulation. Live conditions activate fear responses absent before.
Q: What does research suggest about day trading profitability over time?
A: Evidence shows most persistent day traders lose money, and only a tiny minority earns a meaningful income.
Navigating the Reality of Consistent Profits in Financial Markets
Achieving the best forex trading strategy for consistent profits requires a shift in perspective. Many beginners fall into the trap of “win rate worship,” believing they need to be right 90% of the time. Professional trading is actually about managing the relationship between risk and return, not seeking perfection in every trade.
Replace “Win Rate” With Risk-Adjusted Metrics
A high win rate is meaningless if your occasional losses wipe out all previous gains. Instead, successful traders focus on risk-adjusted return metrics, such as the Sharpe Ratio or Calmar Ratio.
These tools measure how much reward you earn for every unit of risk taken, helping you identify if a strategy’s performance is stable or just lucky.
- Expectancy: This formula combines your win rate and the size of your average win versus loss.
- Sharpe Thinking: According to CMC Markets, the Sharpe ratio highlights which strategies perform better relative to the volatility endured.
- The Breakeven Reality: If your risk-reward ratio is 1:2, you only need a 33.3% win rate to break even.
Key Point:
Focusing on risk-adjusted metrics prevents you from being blinded by the "perfect" equity curves often used to market fake strategies.
Drawdown as the Truth Serum for Any Strategy
The drawdown is the most honest indicator of a strategy’s viability in the real world. It measures the decline from an equity peak to its lowest point before recovering.
Even the most profitable system can be unusable if it requires you to sit through a 50% loss that destroys your emotional discipline.
- Maximum Drawdown (MDD): The largest single drop your account takes; this defines your worst-case scenario.
- Time-to-Recover: A strategy that takes years to return to its previous peak is often a psychological failure for retail traders.
- Streak Length: Understanding that even a 60% win rate can produce 10 losses in a row is vital for survival.
Did You Know?
Regulators frequently highlight that leveraged derivatives can amplify losses rapidly, making drawdown control the central pillar of long-term survival.
Conclusion
Real progress starts when you accept that why most trading strategies are fake is usually a process problem, not a missing “secret setup.” Build evidence first, then protect execution quality with simple rules, realistic cost assumptions, and risk design that you can follow during drawdowns.
Treat every new idea as a testable hypothesis, document results, and reduce complexity until performance remains stable across different conditions. The most professional habit is to falsify weak strategies quickly, so your capital and confidence stay reserved for what survives reality.